Ar ticle
The Rockefeller University Press $30.00
The J
our
nal of Exper
imental Medicine
IntroductIon
Colorectal cancer is a leading contributor to cancer-related deaths in the United States and is a major complication of inflammatory bowel disease (IBD; Clevers, 2004). Colorec-tal cancer and IBD are commonly associated with the ex-aggerated production of inflammatory cytokines, which are regulated by the activation of various cell signaling pathways (Karin and Greten, 2005; Yu et al., 2009; Saleh and Trinch-ieri, 2011; West et al., 2015). It has been well established that STAT3 and IL-10 play critical roles in the regulation of intes-tinal inflammation in both IBD patients and animals with ex-perimental colitis. Genome-wide association studies indicated that STAT3 gene polymorphism is associated with increased susceptibility to IBD (Barrett et al., 2008; Jostins et al., 2012). Myeloid-derived STAT3 exerts a potent anti-inflammatory effect on chemically induced experimental colitis (Takeda et al., 1999). Meanwhile, STAT3 is important for survival and
proliferation of intestinal epithelial cells (Bollrath et al., 2009; Grivennikov et al., 2009).
Recent studies of immune system metabolism, namely immunometabolism, have identified a tight link between metabolic reprogramming and hyperinflammation. It has been well documented that activation of immune cells is ac-companied by metabolic changes toward increased glucose uptake, glycolysis, and pentose phosphate pathway activity (O’Neill and Hardie, 2013; Pearce et al., 2013). In addition to glycolysis and pentose phosphate pathway, a small portion of glucose metabolizes through the hexosamine biosynthesis pathway (HBP), which leads to the generation of its end prod-uct, UDP–N-acetylglucosamine (UDP-GlcNAc; Ruan et al., 2013). O-GlcNAc transferase (OGT) mediates the transfer of UDP-GlcNAc to serine or threonine residue of target proteins, which is called protein O-GlcNAcylation. Previous studies have discovered essential roles of protein O-GlcNAcylation in many fundamental biological activities, including signaling, transcription, and translation (Hart et al., 2011). A very re-cent study revealed a critical role of OGT in both T progen-itor cell development in the thymus and mature T cell clonal Signal transducer and activator of transcription 3 (StAt3) is a key mediator of intestinal inflammation and tumorigenesis. However, the molecular mechanism that modulates StAt3 phosphorylation and activation is not fully understood. Here, we demonstrate that modification of StAt3 with o-linked β-n-acetylglucosamine (o-GlcnAc) on threonine 717 (t717) nega-tively regulates its phosphorylation and targets gene expression in macrophages. We further found that cullin 3 (cuL3), a cullin family E3 ubiquitin ligase, down-regulates the expression of the o-GlcnAc transferase (oGt) and inhibits StAt3 o- GlcnAcylation. the inhibitory effect of cuL3 on oGt expression is dependent on nuclear factor E2–related factor-2 (nrf2), which binds to the ogt promoter region and increases gene transcription. Myeloid deletion of cul3 led to defective StAt3 phosphorylation in colon macrophages, which was accompanied by exacerbated colonic inflammation and inflammation-driven tumorigenesis. thus, this study identifies a new form of posttranslational modification of StAt3, modulating its phosphoryla-tion, and suggests the importance of immunometabolism on colonic inflammation and tumorigenesis.
Myeloid-derived cullin 3 promotes STAT3
phosphorylation by inhibiting OGT expression
and protects against intestinal inflammation
Xinghui Li,
1,2Zhibin Zhang,
3Lupeng Li,
1,2Wei Gong,
1,2,4Audrey J. Lazenby,
1Benjamin J. Swanson,
1Laura E. Herring,
5John M. Asara,
6Jeffrey D. Singer,
7and Haitao Wen
1,21Department of Pathology and Microbiology and 2Holland Regenerative Medicine Program, University of Nebraska Medical Center, Omaha, NE 68198 3Program in Cellular and Molecular Medicine, Boston Children’s Hospital and Department of Pediatrics, Harvard Medical School, Boston, MA 02115
4Department of Hepatobiliary Surgery and Liver Transplantation, Shandong Provincial Hospital Affiliated to Shandong University, Jinan 250021, People’s Republic
of China
5Proteomics Core Facility, Department of Pharmacology, University of North Carolina at Chapel Hill, Chapel Hill, NC 27599
6Division of Signal Transduction, Beth Israel Deaconess Medical Center and Department of Medicine, Harvard Medical School, Boston, MA 02115 7Department of Biology, Portland State University, Portland, OR 97201
© 2017 Li et al. This article is distributed under the terms of an Attribution–Noncommercial–Share Alike– No Mirror Sites license for the first six months after the publication date (see http ://www .rupress .org / terms /). After six months it is available under a Creative Commons License (Attribution–Noncommercial– Share Alike 4.0 International license, as described at https ://creativecommons .org /licenses /by -nc -sa /4 .0 /). Correspondence to Haitao Wen: [email protected]
Abbreviations used: AOM, azoxymethane; BMM, BM-derived macrophage; CAC, coli-tis-associated cancer; ChIP, chromatin immunoprecipitation; CRL, Cullin-RING (really interesting new gene) ligase; DKO, double KO; DMF, dimethyl fumarate; DSS, dextran sulfate sodium; GlcNAc, N-acetylglucosamine; HBP, hexosamine biosynthesis path-way; IBD, inflammatory bowel disease; MS, mass spectrometry; O-GlcNAc, O-linked
expansion in the periphery (Swamy et al., 2016). Through metabolic profiling analysis, another study indicated that HBP is required for macrophage alternative activation (Jha et al., 2015), although a genetic animal model is fur-ther required to test this concept. The overall effect of OGT- mediated O-GlcNAcylation in innate immune function and its disease relevance remain elusive (Pearce and Everts, 2015).
Cullin-RING (really interesting new gene) ligases (CRLs) represent the largest E3 ubiquitin ligase family in eukaryotes (Genschik et al., 2013). Within the CRL fam-ily, CUL3-formed CRL3 has been reported to target more than 100 substrates for protein ubiquitination and degrada-tion (Emanuele et al., 2011). Previous studies have established CUL3 as an essential regulator of a variety of important bi-ological processes, including cell cycle, development, and cell stress response (Genschik et al., 2013). Recent studies have re-vealed a critical role of CUL3 in the adaptive immune system, including promoting germinal center B cell and NKT cell differentiation (Mathew et al., 2012) and inhibiting T follicu-lar helper cell differentiation (Mathew et al., 2014). However, the role of CUL3 in the innate immune system and inflam-mation is not clear. In this study, we observed increased OGT expression and STAT3 O-GlcNAcylation in Cul3-deficient macrophages as a result of elevated Nrf2-mediated Ogt gene transcription. We also found that O-GlcNAcylation of STAT3 on T717 exerts an inhibitory effect on STAT3 phosphory-lation and IL-10 production in macrophages and promotes disease severity in chemically induced colitis and a colitis-as-sociated cancer (CAC) model. Our findings demonstrate a mechanistic link between O-GlcNAc signaling and STAT3 function during intestinal inflammation and tumorigenesis.
rESuLtS
defective StAt3 phosphorylation and IL-10 production in cul3-deficient macrophages
A previous study reported that whole-body deletion of CUL3 caused embryonic lethality (Singer et al., 1999). To examine the role of CUL3 in the innate immune system, we generated
mice with a myeloid-conditional Cul3 deletion (Cul3Δmye)
by crossing Cul3fl/fl mice (McEvoy et al., 2007) with
lyso-some M-Cre mice (Fig. S1 A). Cul3fl/fl mice were used as
WT controls. Deletion of CUL3 protein in Cul3Δmye
BM-de-rived macrophages (BMMs) was confirmed (Fig. S1 B). As a well-defined CRL3 target (Genschik et al., 2013), nuclear factor E2–related factor-2 (Nrf2) protein (Fig. S1 C) and its target gene Nqo1 transcripts (Fig. S1 D) were both dramati-cally increased in Cul3Δmye BMMs. These findings confirmed a successful CUL3 deletion in Cul3Δmye macrophages.
We tested the activation of various immune signaling pathways in Cul3Δmye macrophages. Cul3Δmye BMMs showed dramatically decreased STAT3 phosphorylation at Y705 in response to either LPS (Fig. 1 A) or IL-6 (Fig. 1 B). In con-trast, Cul3Δmye BMMs exhibited slightly decreased NF-κB (Fig. 1 C), intact MAPK (Fig. 1 D) signaling upon LPS
stim-ulation, intact STAT1 phosphorylation upon IFN-γ
stimu-lation (Fig. 1 E), and intact STAT6 phosphorystimu-lation upon IL-4 stimulation (Fig. 1 F). LPS-induced STAT3 phosphory-lation and up-reguphosphory-lation of suppressor of cytokine signaling 3 (SOCS3), a well-defined STAT3 transcriptional target, were also blunted in Cul3Δmye peritoneal macrophages (Fig. 1 G). These findings indicate a specific role of CUL3 in STAT3 phosphorylation in macrophages independent of stimuli.
It has been shown that STAT3 is a key transcriptional factor mediating IL-10 production (Takeda et al., 1999). Cul3Δmye macrophages generated significantly lower levels of Il10 but higher levels of Il12a, Cxcl1, and Cxcl2 transcripts (Fig. 2 A), and a lower amount of IL-10 and higher amount of IL-12p70 protein upon LPS stimulation (Fig. 2 B). Mac-rophages activated by TLR2 (Pam3Cys) or TLR9 (CpG) agonists showed a similar phenotype (Fig. 2, C and D),
sug-gesting a broad hyperinflammatory response in Cul3Δmye
macrophages. Chromatin immunoprecipitation (ChIP) assays showed defective STAT3 binding at the promoter region of Il10 gene in LPS-stimulated Cul3Δmye macrophages, suggest-ing that CUL3 mediates TLR-induced STAT3 activation to cause chromosomal activation of Il10 promoter (Fig. 2 E).
STAT3 is a well-established signal transducer of the cytokine–cytokine receptor signaling pathway (O’Shea and Plenge, 2012). To examine whether defective STAT3 phos-phorylation is caused by an altered extracellular cytokine environment for Cul3Δmye macrophages, we used a Transwell co-culture system in which Cul3f/fl and Cul3Δmye macro-phages placed in distinct chambers shared an identical cyto-kine environment. Despite the genotypes of co-cultured cells
in the upper chamber, Cul3Δmye BMMs in the lower chamber
showed decreased STAT3 phosphorylation (Fig. 2 F), lower levels of Il10, and higher levels of Il12a, Cxcl1, and Cxcl2 transcripts (Fig. 2 G) after LPS stimulation compared with similarly treated WT BMMs (Fig. 2 F). These findings sup-port a cell-intrinsic mechanism of CUL3 in mediating the STAT3–IL-10 signaling axis.
cuL3 negatively regulates oGt expression and protein o-GlcnAcylation
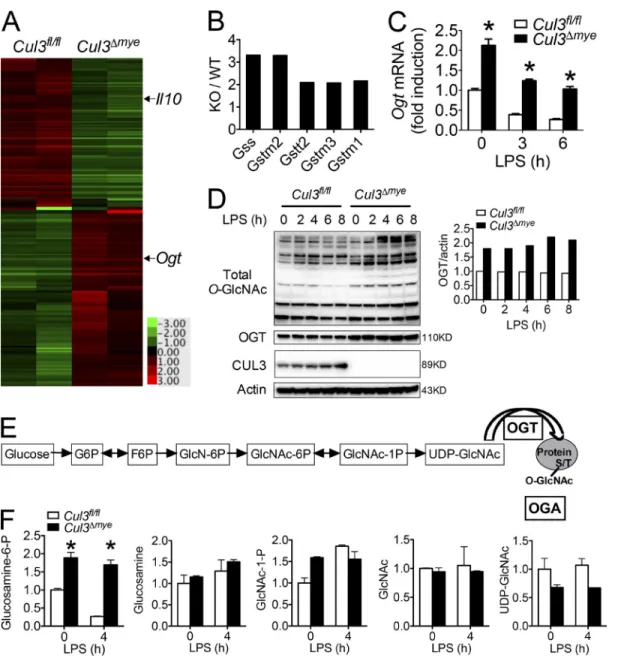
We next performed microarray analysis to explore the mech-anism by which CUL3 mediates the STAT3–IL-10
signal-ing axis. After LPS stimulation, Cul3Δmye BMMs generated
lower transcript levels of Il10 and several other STAT3 tar-get genes, including Ahr (aryl hydrocarbon receptor), Klf4 (Kruppel-like factor 4), and Ccnd1 (cyclin D1; Fig. 3 A and Table S3; Yu et al., 2009). Several Nrf2 target genes,
in-cluding Gss (glutathione synthetase), Gstm2 (GST Mu 2),
Gstt2 (GST theta 2), Gstm3, and Gstm1 were expressed in Cul3Δmye BMMs at higher levels (Fig. 3 B), presumably be-cause of elevated Nrf2 protein levels (Fig. S1 C). Interestingly, we observed higher expression of Ogt, which encodes a key enzyme for protein O-GlcNAcylation, in LPS-stimulated
Cul3Δmye BMMs compared with similarly treated WT BMMs
(Fig. 3 A and Table S3). RT-PCR analysis revealed that
threefold increase in Ogt transcript levels in naive status and upon LPS stimulation, respectively (Fig. 3 C). In line with
increased Ogt transcript levels, Cul3Δmye BMMs contained
markedly increased OGT protein levels (Fig. 3 D), as well as increased total O-GlcNAcylation (Fig. 3 D). It should be noted that despite reduced Ogt transcript levels, LPS stimu-lation up to 8 h failed to decrease OGT protein levels, indi-cating a prolonged half-life of OGT protein, as was recently reported (Yang et al., 2015a).
To gain further insight into the effect of CUL3 on HBP activity, we performed targeted steady-state metabolo-mics profiling by mass spectrometry (MS; Yuan et al., 2012) in macrophages with or without LPS stimulation (Fig. 3 E). Compared with WT macrophages, we observed two- and fourfold increases in glucosamine-6-phosphate (GlcN-6P), the product of the committed step governing entry into HBP, in Cul3Δmye BMMs in naive status and upon LPS stimulation, respectively (Fig. 3 F and Table S4). These data suggest in-creased HBP activity in the absence of CUL3.
cuL3 inhibits StAt3 o-GlcnAcylation
Previous studies suggested extensive cross-talk between O-GlcNAcylation and phosphorylation (Hart et al., 2011).
The observation of defective STAT3 phosphorylation but
increased total O-GlcNAcylation in Cul3Δmye macrophages
prompted us to test the hypothesis that increased STAT3 O-GlcNAcylation inhibits its phosphorylation. We first measured STAT3 O-GlcNAcylation in Cul3fl/fl and Cul3Δmye macrophages by STAT3 immunoprecipitation, followed by immunoblotting with anti–O-GlcNAc antibody (because of the lack of specific antibody against O-GlcNAcylated
STAT3). Cul3Δmye macrophages showed a twofold increase
in O-GlcNAcylated STAT3 normalized to total STAT3
compared with WT cells (Fig. 4, A and B). The O-GlcNAc signal on STAT3 was abolished when anti–O-GlcNAc an-tibody was preincubated with 500 mM GlcNAc, indicating the specificity of the O-GlcNAc signal (Fig. 4 A). In con-trast, LPS-induced STAT3 phosphorylation was
dramat-ically attenuated in LPS-stimulated Cul3Δmye macrophages,
suggesting a negative correlation between STAT3 O- GlcNAcylation and phosphorylation. We tested the relation-ship between STAT3 O-GlcNAcylation and phosphoryla-tion using a pharmacological HBP activator. PUG NAc is a widely used inhibitor of O-GlcNAcase (OGA) that can potently enhance protein O-GlcNAcylation (Hart et al., 2011), and we confirmed its effect on promoting protein O-
Figure 1. cuL3 is required for StAt3 phosphorylation in macrophages. (A and B) BMMs generated from Cul3fl/fl and Cul3Δmye mice were stimulated
with 200 ng/ml LPS (A) or IL-6 (B) for the indicated periods. IKK, IκB kinase. Phosphorylation of STAT3 (Y705) was assayed with immunoblotting. (C and D) Immunoblotting of NF-κB (C) and MAPK (D) signaling molecules was performed in Cul3fl/fl and Cul3Δmye BMMs left untreated or treated with LPS for the
indicated periods. ERK, extracellular signal–regulated kinase. (E and F) Immunoblotting of STAT1 phosphorylation (Y701) in response to 20 ng/ml IFN-γ (E) and STAT6 phosphorylation (Y641) in response to 20 ng/ml IL-4 (F) was performed in Cul3fl/fl and Cul3Δmye BMMs. (G) Immunoblotting of phosphorylated
STAT3 (Y705) and its target protein suppressor of cytokine signaling 3 (SOCS3) was performed in peritoneal macrophages isolated from naive Cul3fl/fl and
GlcNAcylation in macrophages (Fig. 4 C). We found that
PUG NAc pretreatment dramatically attenuated
LPS-in-duced STAT3 phosphorylation (Fig. 4 C) and IL-10 pro-duction (Fig. 4, D and E) in WT cells and abolished the
differences between WT and Cul3Δmye macrophages. We
next asked whether the inhibitory effect of STAT3 O- GlcNAcylation on its phosphorylation occurred in a physio-logical condition by lowering culture medium glucose level. Switching the glucose level from 25 to 5 mM in culture medium caused a decrease in total O-GlcNAcylation and
Figure 2. cuL3 mediates StAt3 phosphorylation and IL-10 production via a cell-intrinsic mechanism. (A–D) Cul3fl/fl and Cul3Δmye BMMs were left
untreated or stimulated with 200 ng/ml LPS (A and B) for the indicated periods, 500 ng/ml PamCy3 (TLR2 agonist), or 5 µg/ml CpG oligonucleotide (TLR9 agonist; C and D) for 6 h. Cytokine transcripts including Il10, Il12a, Cxcl1, and Cxcl2 in the cells (A and C) and IL-10 and IL-12p70 proteins in the supernatants (B and D) were measured with RT-PCR and ELI SA, respectively. NT, not treated. (E) ChIP assay of the binding of STAT3 at the promoter region of Il10 gene in Cul3fl/fl and Cul3Δmye BMMs left untreated or stimulated with LPS for 3 or 6 h. (F and G) Cul3fl/fl and Cul3Δmye BMMs were placed in either the upper or
an increase in STAT3 phosphorylation upon LPS stimula-tion (Fig. 4 F). These results indicate that glucose metabolism affects STAT3 phosphorylation through O-GlcNAc signaling.
Finally, we used siRNA-based Ogt gene knockdown to determine whether defective STAT3 phosphorylation and IL-10 production were dependent on elevated OGT expres-sion in Cul3Δmye macrophages. Transfection with siOgt mark-edly rescued defective STAT3 phosphorylation (Fig. 4 G)
and IL-10 production (Fig. 4 H) in Cul3Δmye macrophages
compared with scrambled siRNA transfection. Collectively, these results indicate that CUL3 mediates STAT3 phosphor-ylation and IL-10 production through an O-GlcNAcphosphor-ylation– dependent mechanism.
StAt3 is o-GlcnAcylated on t717
We sought to identify the O-GlcNAcylation site or sites on STAT3 through MS analysis. Mouse livers were initially used as the model system because of their abundant STAT3
Figure 3. cuL3 negatively regulates oGt expression and protein o-GlcnAcylation. (A and B) Gene profiling assay was performed with RNA samples extracted from Cul3fl/fl and Cul3Δmye BMMs stimulated with LPS for 4 h. A resultant heat map indicating Il10 and Ogt (A) and fold changes in Nrf2 target
genes (B) are shown. (C and D) Cul3fl/fl and Cul3Δmye BMMs were left untreated or stimulated with 200 ng/ml LPS for the indicated periods. (C) Ogt transcript
was measured with RT-PCR. (D) Immunoblotting (left) and densitometric analysis to quantify ratio of OGT to actin (right) in treated BMMs. (E and F) Cul3fl/fl
and Cul3Δmye BMMs were left untreated or stimulated with 200 ng/ml LPS for 4 h. LC-MS/MS metabolomics analysis was performed to profile steady-state
Figure 4. cuL3 inhibits StAt3 o-GlcnAcylation on t717. (A and B) Total STAT3 was immunoprecipitated (IP) from Cul3fl/fl and Cul3Δmye BMMs left
untreated or stimulated with 200 ng/ml LPS for 4 h. Immunoblotting (A) and densitometric analysis to quantify ratio of either O-GlcNAcylated or phos-phorylated STAT3 to total STAT3 (B) are shown. (C–E) Cul3fl/fl and Cul3Δmye BMMs were left untreated or stimulated with LPS for the indicated periods with or
protein supply. A recent study suggested that the ER stress response promotes HBP activity and protein O-GlcNAcyla-tion (Wang et al., 2014). We challenged C57BL/6 mice with vehicle or tunicamycin (Tm), a pharmacological inhibitor of protein glycosylation that is commonly used to induce ER stress (Ozcan et al., 2004). As expected, Tm challenge for 6 h caused the up-regulation of spliced X-box binding protein 1 (Xbp1s) and C/EBP homologous protein (CHOP), two ER stress target proteins (Fig. 4 I; Ozcan et al., 2004). In-terestingly, Tm challenge dramatically enhanced STAT3 O- GlcNAcylation. In line with the negative correlation between STAT3 O-GlcNAcylation and phosphorylation observed in Cul3Δmye macrophages (Fig. 4 A), Tm challenge resulted in decreased STAT3 phosphorylation, a finding similar to that previously reported (Kimura et al., 2012). Therefore, mouse liver after ER stress induction serves as an ideal subject for proteomics analysis of STAT3 O-GlcNAcylation sites.
Immunoprecipitated STAT3 in total liver lysates pre-pared from vehicle- or Tm-treated mice was analyzed by liq-uid chromatography coupled to tandem MS (LC-MS/MS). A single peptide FIC VTP TTC SNT IDL PMS PR (amino acid 710–729) was identified as carrying a HexNAc (+203.1 D) modification in liver sample from Tm-treated mouse, but not in that from vehicle-treated mouse (Fig. 4 J). Because of sufficient fragmentation by collision-induced dissociation (CID), the O-GlcNAc modification was localized to T717, whereas other potential O-GlcNAcylation sites (T714, T716, T721, and S727) in this peptide could not be confirmed. We also identified the phosphorylation of Y705 and S727, which was decreased in the Tm-treated mice (Fig. 4 J). These findings demonstrate a negative correlation between STAT3 O-GlcNAcylation and phosphorylation during ER stress. We further confirmed the aforementioned findings by an-alyzing Stat3 O-GlcNAcylation in mouse BMMs. In both nontreated and LPS-treated BMMs, the same peptide of Stat3 (amino acid 710–729), as observed in mouse liver Stat3, car-ried a HexNAc modification (Fig. S2). Therefore, the results from MS assay confirmed the biochemical analysis results of STAT3 O-GlcNAcylation (Fig. 4 A).
A series of mutant constructs of STAT3 were generated with those individual residues as potential O-GlcNAcylation sites mutated to alanine. To examine STAT3 O-GlcNAcylation
sites, we transfected STAT3 WT or mutant constructs into
Cul3Δmye macrophages, which represent a highly
permis-sive environment for STAT3 O-GlcNAcylation (Fig. 4 A). STAT3 with T717A mutation showed a loss of O-GlcNAc signal, indicating that STAT3 is O-GlcNAcylated at T717 (Fig. 4 K). Macrophages transfected with STAT3 T717A mu-tant exhibited significantly increased STAT3 phosphorylation (Fig. 4 K) and IL-10 production at the transcript (Fig. 4 L) and protein (Fig. 4 M) levels upon LPS stimulation, compared with those transfected with WT STAT3. In agreement, ChIP assay revealed an increased binding of STAT3 T717A mutant to the Il10 promoter region, indicating an increased tran-scription activity in STAT3 upon the loss of O-GlcNAcyla-tion (Fig. 4 N). Collectively, these data strongly indicate that STAT3 O-GlcNAcylation on T717 is an intrinsic inhibitory mechanism against its phosphorylation and transcriptional activity. Interestingly, STAT3 T717 and phosphorylation site Y705 are well conserved among metazoan species (Fig. 4 O), highlighting the cross-talk between O-GlcNAcylation on T717 and phosphorylation on Y705 as an evolutionarily con-served mechanism regulating STAT3 biological activity.
Previous studies suggest that OGT forms a functional protein complex with the serine/threonine phosphatase 1 (PP1; Wells et al., 2004). We therefore sought to determine whether PP1 is involved in the inhibitory effect of STAT3 O-GlcNAcylation on its phosphorylation. Pretreatment of cells with calyculin A, a widely used PP1 and PP2A inhib-itor, increased LPS-induced Stat3 phosphorylation in both WT and Cul3Δmye cells (Fig. S3), which is consistent with pre-vious study showing an antagonizing effect of protein phos-phatase in STAT3 phosphorylation (Zgheib et al., 2012). However, decreased STAT3 phosphorylation was still observed in Cul3Δmye cells compared with WT cells in the presence of calyculin A, suggesting that PP1 or PP2A is not involved in the inhibitory effect of O-GlcNAcylation on phosphorylation of STAT3. Therefore, the mechanism whereby STAT3 O- GlcNAcylation inhibits its phosphorylation remains unidentified.
Elevated nrf2 protein mediates increased ogt transcription in cul3Δmye macrophages
It is reasonable to hypothesize that certain CUL3-regulated transcriptional factors are responsible for elevated OGT
lev-protein (E) were assayed by immunoblotting, RT-PCR, and ELI SA, respectively. (F) STAT3 phosphorylation (Y705) was measured in WT BMMs left untreated or stimulated with LPS for 3 or 6 h in the presence of 5 or 25 mM glucose. (G and H) Cul3fl/fl and Cul3Δmye BMMs transfected with siScr or siOgt were left
un-treated or stimulated with LPS for 6 h. STAT3 phosphorylation (G) and IL-10 production (H) were assayed. (I and J) Total STAT3 was immunoprecipitated from liver tissue lysates of vehicle- or Tm-treated C57BL/6 mice. (I) Immunoblotting (left) and densitometric analysis (right) to quantify STAT3 O-GlcNAcylation and phosphorylation (Y705). (J) LC-MS/MS analysis was performed to identify T717 as a STAT3 O-GlcNAcylation site after Tm challenge. MS/MS spectrum of the 2+ ion at m/z 1,265.08667 corresponding to STAT3 peptide FIcVTPTgTcSNT IDLPmSPR. T177 is O-GlcNAcylated (gT). (K–N) A series of point mutations of STAT3 were generated with site-directed mutagenesis, as indicated. (K) Empty vector, FLAG-tagged WT, or mutant constructs of STAT3 were transfected into Cul3Δmye BMMs for 48 h, followed by LPS stimulation for 6 h. STAT3 O-GlcNAcylation was assayed as described in A. (L and M) IL-10 transcript (L) and
els in Cul3Δmye macrophages because the inhibitory effect of CUL3 on OGT occurs at the transcriptional level. Nrf2 has been firmly established as a target protein of CUL3-medi-ated protein ubiquitination and degradation (Emanuele et al., 2011), which has been confirmed in our hands (Fig. S1). We therefore tested whether elevated Nrf2 is an underlying mechanism for increased OGT transcription and decreased
STAT3–IL-10 axis in Cul3Δmye macrophages by generating
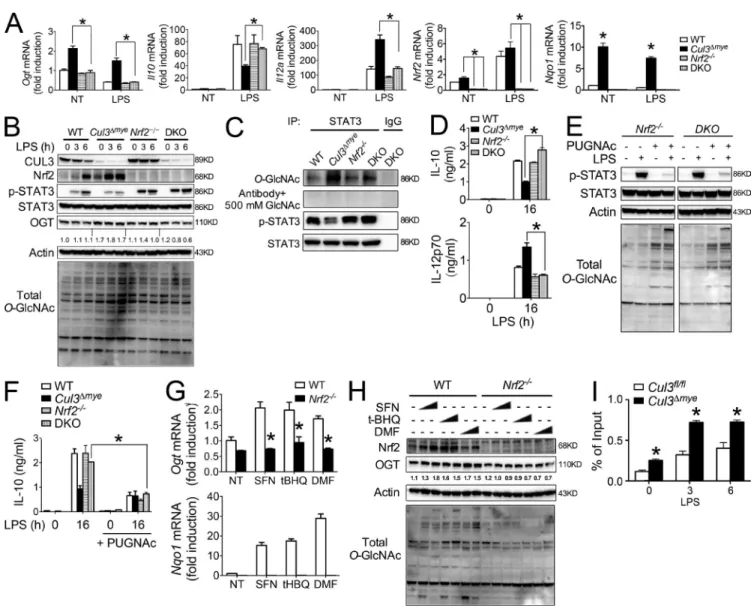
Cul3ΔmyeNrf2−/− double KO (DKO) mice. Although Nrf2−/−
macrophages showed normal OGT expression compared with WT cells, deletion of Nrf2 abolished increased OGT expression at the transcript (Fig. 5 A) and protein (Fig. 5 B) levels, as well as elevated total O-GlcNAc signal, in Cul3Δmye macrophages. As a result, elevated STAT3 O-GlcNAcylation
in Cul3Δmye macrophages was also abolished in DKO cells
(Fig. 5 C). This result suggests that Nrf2 is not absolutely re-quired for OGT expression, but elevated Nrf2 protein can increase OGT expression. Similar results were observed in au-tophagy-deficient macrophages showing increased MAR CO (macrophage receptor with collagenous structure) expression caused by enhanced Nrf2 activation (Bonilla et al., 2013).
We took advantage of DKO macrophages to test the potential link between elevated Nrf2 and defective STAT3-IL-10 axis in Cul3Δmye macrophages. After LPS stim-ulation, defective STAT3 phosphorylation in Cul3Δmye mac-rophages was rescued in DKO macmac-rophages (Fig. 5, B and C). In agreement, altered IL-10 and IL-12 production in
Cul3Δmye macrophages were all normalized to the levels in
WT cells by additional Nrf2 deletion (Fig. 5, A and D). These findings clearly state that elevated Nrf2 is responsible for in-creased OGT expression and STAT3 O-GlcNAcylation, as well as defective STAT3–IL-10 axis in Cul3Δmye macrophages. Normalization of OGT expression and total O-GlcNAc sig-nal in DKO cells prompted us to test whether DKO cells were sensitive to PUG NAc-repressed STAT3–IL-10 axis, as observed in WT cells (Fig. 4 C). PUG NAc treatment caused a significant decrease in LPS-induced STAT3 phosphorylation (Fig. 5 E) and IL-10 production (Fig. 5 F) in Nrf2−/− or DKO
macrophages, suggesting that Nrf2−/− or DKO macrophages
show sensitivity to PUG NAc-inhibited STAT3 phosphoryla-tion and IL-10 producphosphoryla-tion similar to that of WT cells.
We further tested whether pharmacological activation of Nrf2 can increases OGT expression. Sulforaphane (SFN), tert-Butylhydroquinone (tBHQ), and dimethyl fumarate (DMF) are widely used Nrf2 activators (Jaramillo and Zhang, 2013). As expected, treatment of cells with the chemicals caused an increase in Nrf2 transcriptional activity (Fig. 5 G, bottom) and Nrf2 protein accumulation (Fig. 5 H). Interest-ingly, these chemicals also increased OGT at the transcript (Fig. 5 G, top) and protein (Fig. 5 H) levels, as well as total
O-GlcNAc signals, in WT macrophages but not in Nrf2−/−
macrophages, indicating Nrf2-mediated transcriptional activa-tion of OGT and OGT-mediated protein O-GlcNAcylaactiva-tion. As an ultimate test of Nrf2-mediated OGT expression in Cul3Δmye macrophages, we performed ChIP analysis to
exam-ine whether Nrf2 directly enhances Ogt gene transcription
by binding to the Ogt promoter region. Cul3Δmye
macro-phages showed enhanced Nrf2 binding at the Ogt promoter in the absence or presence of LPS stimulation (Fig. 5 F). De-spite causing enhanced binding of Nrf2 at the Ogt promoter, short-term LPS challenge actually down-regulated Ogt in macrophages (Fig. 3 C), suggesting that additional inhibitory mechanisms exist to repress Ogt transcription. In sum, these results indicate that elevated Nrf2 caused by CUL3 deficiency promotes OGT expression and STAT3 O-GlcNAcylation, which subsequently affects STAT3 phosphorylation and IL-10 production (Fig. S2).
cul3Δmye mice are more susceptible to experimental colitis and cAc
Numerous studies have established STAT3 and IL-10 as key mediators of intestinal inflammation and tumorigenesis (Yu et al., 2009; Grivennikov et al., 2010; O’Shea and Plenge, 2012; West et al., 2015). For example, myeloid deletion of Stat3 causes more severe intestinal inflammation during chemically induced colitis (Takeda et al., 1999). Il10-deficient mice de-velop spontaneous colitis (Moran et al., 2009). We studied the function of myeloid-derived CUL3 in intestinal inflammation during experimental colitis. Mice were challenged with 3% dextran sulfate sodium (DSS) for 5 d, and survival was assayed
for 12 d (Wirtz et al., 2007). Cul3Δmye mice demonstrated
significantly exacerbated mortality, weight loss, bleeding, di-arrhea, and colon length shortening compared with WT mice (Fig. 6, A–E). Histological analysis revealed increased immune cell infiltration in DSS-treated Cul3Δmye mice (Fig. 6 F). To further evaluate the colonic inflammatory response induced by DSS treatment, colon explant cultures were established from untreated or DSS-treated mice. Production of inflam-matory cytokines such as IL-1β, IL-6, and IL-12p70 were sig-nificantly enhanced in colon explant culture from Cul3Δmye mice, indicating exacerbated colonic inflammation (Fig. 6 G). In sharp contrast, IL-10 production in colon explant culture from Cul3Δmye mice was significantly decreased. In addition, STAT3 phosphorylation in colon macrophages was also sig-nificantly decreased in Cul3Δmye mice with colitis compared with those from WT mice with colitis, which was consistent
with defective STAT3 phosphorylation in Cul3Δmye
macro-phages in vitro (Fig. 6 H).
We have shown that Nrf2 deletion rescued defective
STAT3 phosphorylation and IL-10 production in Cul3Δmye
macrophages (Fig. 5, A–D). To test whether Nrf2 deletion could abolish the DSS-colitis phenotype in Cul3Δmye mice, we generated BM chimeric mice in which lethally irradiated WT mice were reconstituted with BM cells isolated from Cul3fl/fl, Cul3Δmye, or Cul3ΔmyeNrf2−/− donor mice. Six weeks later,
decreased IL-10 production (Fig. 6, I–M). This phenotype was consistent with the increased disease severity in Cul3Δmye mice. In contrast, mice with Cul3ΔmyeNrf2−/− BM cells showed
im-proved disease outcomes compared with mice with Cul3Δmye
BM cells, indicating that Nrf2 mediates the in vivo function of myeloid-derived Cul3 in the DSS-colitis model.
We next evaluated the function of myeloid-derived CUL3 in the development of an inflammation-driven CAC model induced with azoxymethane (AOM) plus three cycles of 2.5% DSS (Fig. 7 A; Wirtz et al., 2007). Over the entire
course of the CAC model, AOM + DSS–treated Cul3Δmye
mice showed a significant decrease in survival and exacer-bated weight loss, bleeding, and diarrhea (Fig. 7, B–E). At the end of the CAC model, histological analyses revealed mac-roscopic colon polyps in the distal colons and rectums from the majority of AOM + DSS–treated mice. The maximal cross-sectional diameter (Fig. 7 F) and number (Fig. 7 G) of macroscopic polyps were significantly increased in Cul3Δmye mice compared with WT mice. Hematoxylin and eosin (H&E) staining of colon tissues revealed increased number
Figure 5. nrf2 promotes oGt expression in cul3Δmye macrophages. (A–D) Cul3ΔmyeNrf2−/−DKO mice were generated. BMMs generated from mice with
the indicated genotypes were left untreated or stimulated with 200 ng/ml LPS for the indicated periods. Transcript of Ogt, Il10, Il12a, Nrf2, and Nqo1 (A), STAT3 phosphorylation and total O-GlcNAc signal (B), STAT3 O-GlcNAcylation (C), and IL-10 and IL-12p70 proteins in the supernatants (D) were measured. NT, not treated. (E and F) BMMs of the indicated genotypes were left untreated or stimulated with LPS for 6 or 16 h in the absence or presence of 100 µM PUG NAc. STAT3 phosphorylation (Y705) and total protein O-GlcNAcylation (E) and IL-10 protein (F) were assayed by immunoblotting and ELI SA, respectively. (G and H) WT and Nrf2−/−BMMs were treated with various Nrf2 activators for 16 h, including SFN (0.4 or 1 µM), tBHQ (2 or 5 µM), and DMF (10 or 40 µM).
Transcript of Ogt and Nqo1 (G) and OGT, Nrf2, and total O-GlcNAc signal (H) were measured with RT-PCR and immunoblotting, respectively. (I) ChIP assay of the binding of Nrf2 at the promoter region of Ogt gene in Cul3fl/fl and Cul3Δmye BMMs left untreated or stimulated with LPS for 3 or 6 h. The results are
Figure 6. cul3Δmye mice show increased susceptibility to chemically induced colitis. (A–H) Cul3fl/fl and Cul3Δmye mice were provided with drinking
water containing 3% DSS for 5 d, followed by regular water for 5 d. (A–D) Kaplan–Meier plot of animal survival (A), body weight loss (B), bleeding score (C), and diarrhea score (D) in Cul3fl/fl (n = 35) and Cul3Δmye (n = 32) mice. (E) Representative colon photos (left) and quantification of colon length (right) of
DSS-treated Cul3fl/fl and Cul3Δmye mice. (F) H&E staining of colons showing histopathology such as crypt loss and immune cell infiltration. Bar, 50 µm. (G) IL-1β,
IL-6, IL-12p70, and IL-10 in colon explant cultures were measured by ELI SA. (H) Histogram (left) and quantification of STAT3 phosphorylation (right) in colon macrophages (CD11b+F4/80+) was assayed by FACS analysis. NT, not treated. (I–M) Lethally irradiated C57BL/6 mice were reconstituted with BM cells from
Cul3fl/fl, Cul3Δmye, or Cul3ΔmyeNrf2−/−donor mice (n = 10 per group), followed by DSS-colitis induction as described in A–H. (I–L) Body weight loss (I), bleeding
and size of dysplastic lesions in AOM + DSS–treated Cul3Δmye mice, which was accompanied by enhanced immune cell in-filtration (Fig. 7 H). In addition, STAT3 phosphorylation in
colon macrophages was significantly decreased in Cul3Δmye
mice (Fig. 7 I). In agreement, Cul3Δmye mice showed in-creased inflammatory cytokine production but dein-creased IL-10 production in colon tissue explant culture compared with WT mice (Fig. 7 J). In summary, these in vivo animal experiments suggest that myeloid deletion of CUL3 caused defective STAT3–IL-10 activation and exacerbated colonic inflammation and inflammation-driven tumors.
dIScuSSIon
This study demonstrates an inhibitory effect of OGT-me-diated STAT3 O-GlcNAcylation on macrophage STAT3 phosphorylation and IL-10 production (Fig. S4). STAT3 is a pleotropic transcription factor that mediates the transcrip-tion of numerous proteins involved in fundamental biolog-ical activities, including immune response, metabolism, cell cycle control, and development (Stark and Darnell, 2012). Upon stimulation with many cytokines, TLR agonists, and growth factors, STAT3 is activated by phosphorylation at T705 and S727. Recent studies have identified additional posttranslational modifications on STAT3 other than phos-phorylation, including methylation on K140 and acetylation on K685 (Stark and Darnell, 2012). One previous study also
reported O-GlcNAcylated STAT3 in 3T3-L1 adipocytes
that was increased after insulin stimulation (Whelan et al., 2008). However, because of the lack of detailed information about the STAT3 O-GlcNAcylation site, it was difficult to test the causal relationship between STAT3 O-GlcNAcyla-tion and its funcO-GlcNAcyla-tion. Our studies detected O-GlcNAcylated STAT3 in macrophages. We also identified T717 as the key O-GlcNAcylation site on STAT3 by unbiased LC-MS/MS analysis, followed by confirmatory studies of testing
indi-vidual T→A or S→A mutants. Importantly, loss of
O-Glc-NAcylation by T717A mutation leads to enhanced STAT3 phosphorylation and transcriptional activity, which strongly argues that O-GlcNAcylation exerts an intrinsic inhibitory effect on STAT3 phosphorylation. These findings thus ex-pand our current understanding of metabolic regulation of immune signaling pathways and highlight an essential role of immunometabolism in regulating immunity, inflammation, and inflammatory diseases.
Because of well-established cross-regulation between O-GlcNAcylation and phosphorylation (Hart et al., 2011), it is reasonable to predict that OGT-mediated O-GlcNAc-ylation plays a pivotal role in immune signaling and inflam-mation. Indeed, the studies of O-GlcNAc signaling in the immune system support the concept that O-GlcNAcylation enhances the activation of inflammatory immune signaling such as NF-κB (Yang et al., 2008). This notion is consistent with the observation that high glucose promotes inflamma-tion (Yang et al., 2008). Several key molecules in TLR and
NF-κB signaling pathways have been identified to be O-
GlcNAcylated. For example, O-GlcNAcylation of IKKβ at
S733 (Kawauchi et al., 2009), NF-κB p65 at T352 (Yang et al., 2008) and T305 (Allison et al., 2012), and c-Rel at S350 (Ra-makrishnan et al., 2013) enhances their transcriptional activ-ities. O-GlcNAcylation of TAB1 at S395, an important TLR
signaling molecule, increased downstream NF-κB activation
and cytokine production (Pathak et al., 2012). A recent study reported that mouse embryonic fibroblasts derived from a
heterozygous O-GlcNAcase gene-deletion (Oga+/−) mouse
strain contained elevated total O-GlcNAc signal, which led to increased promoter binding activity of p65 and cytokine production (Yang et al., 2015b). As a result, Oga+/− mice
ex-hibited increased susceptibility to the DSS-colitis model. Our Cul3Δmye mice showed a phenotype similar to that of Oga+/−
mice in the DSS-colitis model, indicating that O-GlcNAc signaling indeed promotes intestinal inflammation. Mean-while, we found that elevated OGT protein and total O- GlcNAcylation caused defective activation of
anti-inflam-matory signaling pathway STAT3–IL-10 in Cul3Δmye
macro-phages. Therefore, it is reasonable to conclude that O-GlcNAc signaling affects inflammatory response through both pro- and anti-inflammatory signaling pathways. In addition to its classic enzymatic function, OGT also possesses enzymatic activity–independent function as a scaffold protein. For ex-ample, N-terminal truncated OGT, which lacks its enzymatic activity domain in C terminus, exhibited an inhibitory effect on gene transcription similar to that of full-length OGT in an overexpressing reporter system (Yang et al., 2002). This was caused by the requirement of N-terminal, but not C-ter-minal, portion of OGT binding to a critical transcriptional repressor, mSin3A (Yang et al., 2002). That study indicates that the enzymatic activity is not absolutely required for the function of OGT as transcriptional modulator. To fully un-derstand enzymatic activity–dependent versus –independent
effects of OGT on NF-κB signaling, a gene-deletion system
is required that is further reconstituted with full-length ver-sus N- or C-terminal OGT.
mecha-Figure 7. cul3Δmye mice are more susceptible to cAc model. (A) Schematic of AOM/DSS model of CAC. (B–E) Kaplan–Meier plot of animal survival (B),
body weight loss (C), bleeding score (D), and diarrhea score (E) in Cul3fl/fl (n = 26) and Cul3Δmye (n = 22) mice after induction of CAC using AOM/DSS. (F)
Macroscopic polyps (arrows) were identified in the distal and mid-colons isolated from Cul3fl/fl and Cul3Δmye mice that had completed the entire course of
CAC model (left). The maximal cross-sectional diameter was quantified (right). (G) The number of macroscopic polyps was quantified. (H) H&E staining of colons showing histopathology such as crypt loss, immune cell infiltration, and polyp formation in Cul3fl/fl and Cul3Δmye mice that had completed the entire
course of CAC model. Bars, 50 µm. (I) Histogram (left) and quantification of STAT3 phosphorylation (right) in colon macrophages (CD11b+F4/80+) assayed by
nism was not understood (Komatsu et al., 2010). It is highly possible that additional unknown Nrf2 target molecules and pathways exist to mediate pathological effect when Nrf2 is highly activated. Recent studies have shown that Nrf2 plays an essential role in mediating glucose and glutamine met-abolic pathways (Mitsuishi et al., 2012; Singh et al., 2013). Using unbiased MS analysis, our study identified OGT as a novel transcriptional target of Nrf2, thus highlighting Nrf2-targeted metabolic pathways as important mechanisms modulating cell signaling. However, we also found that Nrf2 is not required for baseline OGT expression. Therefore, the molecular mechanism of OGT transcriptional control re-mains largely unknown. Interestingly, recent studies identified additional transcriptional factors other than Nrf2 as essential binding partners with CUL3, such as PLZF (promyelocytic leukemia zinc finger) and BCL6 (B cell lymphoma 6), in reg-ulating NKT and B cell development (Mathew et al., 2012, 2014). Therefore, additional CUL3 target proteins other than Nrf2 may regulate baseline OGT transcription, which re-quires further investigation.
In addition to activation of the innate immune response, T cell activation and subtype skewing toward T helper 1 (Th1) and Th17 have also been indicated in the initiation and devel-opment of intestinal inflammation and inflammation-driven tumor (West et al., 2015). Genome-wide association studies of human IBD have identified a tight link between Th1- and Th17-related gene polymorphism and intestinal inflamma-tion (Jostins et al., 2012). We detected significantly increased
IL-6 and IL-12 production in colon tissues from Cul3Δmye
mice in the DSS-colitis and CAC animal models, which was associated with exacerbated colonic inflammation and tum-origenesis. Because IL-6 and IL-12 are important inducing cytokines for Th17 and Th1 cell differentiation, respectively, further studies are warranted to explore the contribution of T cell–mediated inflammatory response to the disease severity affected by O-GlcNAc signaling.
In summary, our results provide an association between OGT-mediated glucose metabolism pathway and essential immune signaling in the innate immune system and expand our current understanding of metabolic regulation of the im-mune function and inflammation-associated diseases. Because of the complexity of established OGT target proteins, it is highly possible that OGT may affect macrophage function other than STAT3 and IL-10 production, requiring further investigation. Taking into account the other important roles of OGT in the adaptive immune system (Swamy et al., 2016) and tumorigenesis (Slawson and Hart, 2011), pharmacologi-cal modification of OGT activity presents a new therapeutic strategy for inflammation and inflammation-driven cancer.
MAtErIALS And MEtHodS Mice
Cul3Δmye mice were generated by crossing Cul3fl/fl mice
(McEvoy et al., 2007) with lysosome M-Cre mice. C57BL/6
mice, lysosome M-Cre mice, and Nrf2−/− mice were
pur-chased from The Jackson Laboratory. Mice were treated in accordance with the National Institutes of Health Guide for the Care and Use of Laboratory Animals and the Institu-tional Animal Care and Use Committee of the University of Nebraska Medical Center.
reagents and antibodies
Ultrapure LPS and CpG oligonucleotide (ODN1826) were
from InvivoGen. Recombinant murine IL-4, IL-6, and IFN-γ
were from PeproTech. Pam3Cys was from EMC Microcollec-tions. PUG NAc, Tm, GlcNAc, SFN, tBHQ, DMF, and AOM were from Sigma-Aldrich. DSS was from TDB Consultancy AB. Antibodies for immunoblotting included Phospho-Stat Antibody Sampler kit containing anti–p-STAT1 (Y701),
an-ti–p-STAT3 (Y705), anti–p-STAT6 (Y641), anti–p-IKKα/β
(S176/180), anti-IKKβ, anti–p-IκBα (S32), anti-IκBα, anti– p-p65 (S536), anti-p65, anti–p-ERK1/2 (T202/Y204), anti–p-JNK (T183/Y185), anti–p-p38 (T180/Y182), anti- OGT and anti–O-GlcNAc (Cell Signaling Technology), anti-STAT3, anti-SOCS3, anti-CHOP, HRP-conjugated
anti–β-actin (Santa Cruz Biotechnology, Inc.),
HRP-conju-gated anti-FLAG (Sigma-Aldrich), anti-Xbp1s (BioLegend), and anti-CUL3 (BD). Anti-Nrf2 (Abcam) antibody was used for both immunoblotting and immunoprecipitation.
cell culture and stimulation
BMMs were generated from Cul3fl/fl and Cul3Δmye mice in
the presence of L-929 conditioned medium. Peritoneal mac-rophages were isolated by peritoneal lavage with 10 ml sterile DPBS containing 2% FBS. Macrophages were stimulated with LPS (200 ng/ml) for various time points as indicated in the figure legends. Cell culture supernatants were collected for ELI SA. Cells were collected for RT-PCR or immunoblotting.
rt-Pcr
Total RNA was extracted from in vitro cultured BMMs using Trisure (Bioline). cDNA synthesis was performed with Mo-loney murine leukemia virus reverse transcription (Invitro-gen) at 38°C for 60 min. Real-time PCR was performed using SYBR Green PCR Master Mix in an Applied Bio-systems StepOnePlus detection system. The fold difference in mRNA expression between treatment groups was deter-mined by a standard ΔΔCt method. β-actin was analyzed as an internal control. The primer sequences of individual genes are listed in Table S1.
Immunoblotting
Fisher Scientific). Images were acquired with ChemiDoc MP System (Bio-Rad Laboratories).
ELI SA
Cytokines generated by in vitro cultured BMMs and colon explants were quantified using the ELI SA Set for mouse
IL-1β, IL-6, IL-10, and IL-12p70 (BD) according to the
manufacturer’s protocol.
Site-directed mutagenesis
pcDNA3 vector containing FLAG-tagged WT or S727A mouse Stat3 was a gift from A. Baldwin (University of North Carolina at Chapel Hill). Phusion Site-Directed mutagenesis kit (Thermo Fisher Scientific) was used to generate a series of STAT3 mutant constructs according to the manufacturer’s instructions. Primers used during mutagenesis PCR can be found in Table S2. The complete nucleotide sequences of all STAT3 mutants were double-checked by sequencing.
cell transfection
BMMs were transfected with WT or mutant forms of STAT3 with X-tremeGENE HP DNA Transfection Reagent accord-ing to the manufacturer’s directions (Roche). The transfection efficiency was predetermined by FACS analysis of GFP by transfecting macrophages with pmaxGFP. For siRNA-based Ogt gene knockdown, BMMs were transfected with siScr or siOgt (Integrated DNA Technologies) using Lipofectamine RNAiMAX Transfection Reagent according to the manufac-turer’s directions (Thermo Fisher Scientific).
chIP assay
The ChIP procedure was performed using an assay kit (EMD Millipore) according to the manufacturer’s instructions. In brief, 3 × 10⁶ BMMs were left untreated or stimulated with 200 ng/ml LPS for 3 or 6 h. DNA–protein structure was then cross-linked by 1% formaldehyde for 10 min at 37°C. Cells were collected and lysed in 400 µl SDS lysis buffer. The re-sulting lysate was sonicated to obtain DNA fragments ranging from 200 to 1,000 bp using a Branson Sonifier SLPe under the following condition: six times for periods of 15 s each. After centrifugation, the supernatant containing chromatin was diluted, and an aliquot (2% volume) was saved to indicate the input DNA in each sample. The remaining chromatin fractions were precleared with salmon sperm DNA/protein A agarose beads followed by immunoprecipitation with anti- STAT3 or anti-Nrf2 antibody overnight at 4°C with gen-tle rotation. Cross-linking was reversed for 4 h at 65°C and was followed by proteinase K digestion. DNA was purified by standard phenol/chloroform and ethanol precipitation and subjected to real-time PCR. Primers are as follows: for
mouse Il10 promoter, forward 5′-CGA CCA GTT CTT TAG
CGC TTA-3′ and reverse 5′-TGT TCT TGG TCC CCC TTT
TA-3′, which amplifies 172 bp from −180 to −9 relative to the transcription start site; for mouse Ogt promoter, forward
5′-GTA CTT TAG CGC TTG CCA AA-3′ and reverse 5′
-CAT GAC TGT AGA GAG CGC ATG-3′, which amplifies 173
bp from −293 to −121 relative to the transcription start site.
Microarray
Total RNA was extracted from Cul3fl/fl and Cul3Δmye BMMs left untreated or stimulated with 200 ng/ml LPS for 4 h using RNeasy Mini kit (QIA GEN) according to the manufactur-er’s instructions. The quality of total RNA was tested using Bioanalyzer 2000 (Agilent Technologies). RNA was digested with the RNase-Free DNase set and amplified into antisense RNA (aRNA). After one-color (Cy3) labeling, aRNA was loaded into a SurePrint G3 Mouse Gene Expression 8X60K Microarray (Agilent) and hybridized overnight in a hybrid-ization oven. The hybridized array was washed and scanned, and data were extracted from the scanned image using Fea-ture Extraction version 10.7 (Agilent Technologies).
tm in vivo treatment
C57BL/6 mice were injected intraperitoneally with 1 mg/kg body weight Tm in sterile dextrose (150 mM) or vehicle con-trol, as previously described (Ozcan et al., 2004). Liver tissues were collected 6 h after injection for biochemical analysis of STAT3 phosphorylation and O-GlcNAcylation and MS analysis of STAT3 O-GlcNAcylation sites.
StAt3 o-GlcnAcylation site mapping
peptides for protein identification: 10 ppm precursor ion mass tolerance; 0.6 D product ion mass tolerance; up to two missed trypsin cleavage sites; carbamidomethylation of Cys set as a fixed modification; and hexNAc (+203.0794 D) of N/S/T, oxidation of M, and phosphorylation of S/T/Y set as variable modifications. The Percolator node was used to determine false discovery rates (FDRs), and a peptide FDR of 5% were used to filter all results.
Metabolomics
3 × 10⁶ BMMs were left untreated or were stimulated with
200 ng/ml LPS for 4 h. Media from biological duplicates were fully aspirated, and 4 ml of 80% (vol/vol) methanol was added at dry ice temperatures. Cells were collected into con-ical tubes, and debris was removed through centrifugation at 2,000 g for 15 min. The resulting supernatant was evap-orated using a refrigerated SpeedVac. Samples were resus-pended using 20 µl HPLC-grade water for targeted LC-MS/ MS. 10 µl was injected and analyzed using a 5500 QTR AP hybrid triple-quadrupole mass spectrometer (Sciex) coupled to a Prominence UFLC HPLC system (Shimadzu) via se-lected reaction monitoring (SRM) of a total of 261 endog-enous water-soluble metabolites for steady-state analyses of samples. Some metabolites were targeted in both positive and negative ion mode for a total of 296 SRM transitions using positive/negative switching. ESI voltage was +4,900
V in positive ion mode and −4,500 V in negative ion mode.
The dwell time was 4 ms per SRM transition, and the total cycle time was 1.89 s. Approximately 9–12 data points were acquired per detected metabolite. Samples were delivered to the MS via normal-phase chromatography using a 4.6-mm internal diameter × 10-cm Amide XBridge HIL IC column (Waters Corp.) at 400 µl/min. Gradients were run starting from 85% buffer B (HPLC grade acetonitrile) to 42% B from 0 to 5 min; 42% B to 0% B from 5 to 16 min; 0% B held from 16 to 24 min; 0% B to 85% B from 24 to 25 min; and 85% B held for 7 min to re-equilibrate the column. Buffer A was comprised of 20 mM ammonium hydroxide/20 mM ammo-nium acetate, pH 9.0, in water/acetonitrile (95:5). Peak areas from the total ion current for each metabolite SRM transi-tion were integrated using MultiQuant v2.1 software (Sciex). Data analysis was performed in Cluster3.0 and TreeViewer.
colitis and cAc animal model
The induction of acute colitis by DSS (Wirtz et al., 2007) and CAC by AOM + DSS (Neufert et al., 2007) has been de-scribed previously. For the DSS-induced colitis model, Cul3fl/fl
and Cul3Δmye mice were subjected to one cycle of 3% DSS
exposure for 5 d. Mice were sacrificed, and inflammation as-sessments were made at day 7 after removal of DSS challenge. To evaluate tumorigenesis, mice received a single intraperi-toneal injection (10 mg/kg body weight) of AOM followed by three cycles of DSS exposure. Mice were sacrificed, and tumor assessments were made 8 wk after AOM injection or when moribund. Colon lengths and histopathology were
measured for each animal at the completion of each study. The bleeding score and diarrhea score were calculated as pre-viously described (Allen et al., 2010; Salcedo et al., 2010).
BM chimera
Six-week old C57BL/6 mice were lethally irradiated (9.5 Gy). BM cells were prepared from femurs and tibiae of Cul3fl/fl, Cul3Δmye, or Cul3ΔmyeNrf2−/− donor mice. Irradiated
recip-ient mice were reconstituted with 5 × 10⁶ BM cells via the tail vein. After 6 wk, mice were subjected to one cycle of 3% DSS exposure for 5 d.
Statistics
Statistical analysis was performed with Prism 5.0 for Macin-tosh. All data are shown as mean ± SD. The mean values for biochemical data from each group were compared by Stu-dent’s t test. Comparisons between multiple time points were analyzed by repeated-measures ANO VA with Bonferroni post tests. Survival curves were generated by the product limit method of Kaplan and Meier, and significance was analyzed by log-rank test. In all tests, P values of less than 0.05 were considered statistically significant.
online supplemental material
Fig. S1 shows the generation of myeloid conditional Cul3 gene deletion mice (Cul3Δmye). Fig. S2 shows the MS analysis of STAT3 O-GlcNAcylation in mouse BMMs. Fig. S3 shows no involvement of protein PP1 in the defective STAT3
phos-phorylation in Cul3Δmye BMMs. Fig. S4 shows a schematic
of CUL3-Nrf2 signaling-modulated OGT expression and
STAT3 O-GlcNAcylation on STAT3 phosphorylation and
IL-10 production in macrophages. Table S1 shows the list of RT-PCR primer sets for various mouse genes. Table S2 shows the list of primer sets used in the site-directed mutagenesis of STAT3. Table S3 shows the list of genes with increased and decreased expression levels in LPS-treated Cul3Δmye mac-rophages compared with similarly treated WT macmac-rophages. Table S4 shows the list of metabolites in LPS-treated Cul3Δmye macrophages versus similarly treated WT macrophages.
AcknoWLEdGMEntS
We thank Hung-Ching Hsia from Dr. Albert Baldwin’s laboratory for STAT3 plasmids and Drs. Xiaochun Yu and Xiaoyong Yang for OGT plasmid. We thank Drs. Lee Graves and David Smalley from UNC Proteomics Core Facility for MS analysis, Dr. Yan Shi from the UNC Genomics Core Facility for microarray experiment, Dr. Joel Parker from the UNC Lineberger Cancer Center for microarray data analysis, and Min Yuan and Susanne Breitkopf for metabolomics experiments. We acknowledge Drs. Nat Moor-man, Ben Major, Michael Emanuele, George Booz, and Lance Wells for helpful discussions.
This work was supported by National Institutes of Health grants K01DK098307 (to H. Wen), 5P01CA120964 (to J.M. Asara), and 5P30CA006516 (to J.M. Asara).
Submitted: 14 July 2016 Revised: 23 November 2016 Accepted: 13 January 2017
rEfErEncES
Allen, I.C., E.M. TeKippe, R.M. Woodford, J.M. Uronis, E.K. Holl, A.B. Rogers, H.H. Herfarth, C. Jobin, and J.P. Ting. 2010. The NLRP3 inflammasome functions as a negative regulator of tumorigenesis during colitis-associated cancer. J. Exp. Med. 207:1045–1056. http ://dx .doi .org /10 .1084 /jem .20100050
Allison, D.F., J.J. Wamsley, M. Kumar, D. Li, L.G. Gray, G.W. Hart, D.R. Jones, and M.W. Mayo. 2012. Modification of RelA by O-linked N-acetylglucosamine links glucose metabolism to NF-κB acetylation and transcription. Proc. Natl. Acad. Sci. USA. 109:16888–16893. http :// dx .doi .org /10 .1073 /pnas .1208468109
Barrett, J.C., S. Hansoul, D.L. Nicolae, J.H. Cho, R.H. Duerr, J.D. Rioux, S.R. Brant, M.S. Silverberg, K.D. Taylor, M.M. Barmada, et al. Wellcome Trust Case Control Consortium. 2008. Genome-wide association defines more than 30 distinct susceptibility loci for Crohn’s disease. Nat. Genet. 40:955–962. http ://dx .doi .org /10 .1038 /ng .175
Bollrath, J., T.J. Phesse, V.A. von Burstin, T. Putoczki, M. Bennecke, T. Bateman, T. Nebelsiek, T. Lundgren-May, O. Canli, S. Schwitalla, et al. 2009. gp130-mediated Stat3 activation in enterocytes regulates cell survival and cell-cycle progression during colitis-associated tumorigenesis. Cancer Cell. 15:91–102. http ://dx .doi .org /10 .1016 /j .ccr .2009 .01 .002
Bonilla, D.L., A. Bhattacharya, Y. Sha, Y. Xu, Q. Xiang, A. Kan, C. Jagannath, M. Komatsu, and N.T. Eissa. 2013. Autophagy regulates phagocytosis by modulating the expression of scavenger receptors. Immunity. 39:537–547. http ://dx .doi .org /10 .1016 /j .immuni .2013 .08 .026
Clevers, H. 2004. At the crossroads of inflammation and cancer. Cell. 118:671–674. http ://dx .doi .org /10 .1016 /j .cell .2004 .09 .005
Emanuele, M.J., A.E. Elia, Q. Xu, C.R. Thoma, L. Izhar, Y. Leng, A. Guo, Y.N. Chen, J. Rush, P.W. Hsu, et al. 2011. Global identification of modular cullin-RING ligase substrates. Cell. 147:459–474. http ://dx .doi .org /10 .1016 /j .cell .2011 .09 .019
Genschik, P., I. Sumara, and E. Lechner. 2013. The emerging family of CUL LIN3-RING ubiquitin ligases (CRL3s): Cellular functions and disease implications. EMBO J. 32:2307–2320. http ://dx .doi .org /10 .1038 / emboj .2013 .173
Grivennikov, S., E. Karin, J. Terzic, D. Mucida, G.Y. Yu, S. Vallabhapurapu, J. Scheller, S. Rose-John, H. Cheroutre, L. Eckmann, and M. Karin. 2009. IL-6 and Stat3 are required for survival of intestinal epithelial cells and development of colitis-associated cancer. Cancer Cell. 15:103–113. http ://dx .doi .org /10 .1016 /j .ccr .2009 .01 .001
Grivennikov, S.I., F.R. Greten, and M. Karin. 2010. Immunity, inflammation, and cancer. Cell. 140:883–899. http ://dx .doi .org /10 .1016 /j .cell .2010 .01 .025
Hart, G.W., C. Slawson, G. Ramirez-Correa, and O. Lagerlof. 2011. Cross talk between O-GlcNAcylation and phosphorylation: Roles in signaling, transcription, and chronic disease. Annu. Rev. Biochem. 80:825–858. http ://dx .doi .org /10 .1146 /annurev -biochem -060608 -102511
Jaramillo, M.C., and D.D. Zhang. 2013. The emerging role of the Nrf2-Keap1 signaling pathway in cancer. Genes Dev. 27:2179–2191. http ://dx .doi .org /10 .1101 /gad .225680 .113
Jha, A.K., S.C. Huang, A. Sergushichev, V. Lampropoulou, Y. Ivanova, E. Loginicheva, K. Chmielewski, K.M. Stewart, J. Ashall, B. Everts, et al. 2015. Network integration of parallel metabolic and transcriptional data reveals metabolic modules that regulate macrophage polarization. Immunity. 42:419–430. http ://dx .doi .org /10 .1016 /j .immuni .2015 .02 .005
Jostins, L., S. Ripke, R.K. Weersma, R.H. Duerr, D.P. McGovern, K.Y. Hui, J.C. Lee, L.P. Schumm, Y. Sharma, C.A. Anderson, et al. International IBD
Genetics Consortium (IIB DGC). 2012. Host-microbe interactions have shaped the genetic architecture of inflammatory bowel disease. Nature. 491:119–124. http ://dx .doi .org /10 .1038 /nature11582
Karin, M., and F.R. Greten. 2005. NF-kappaB: Linking inflammation and immunity to cancer development and progression. Nat. Rev. Immunol. 5:749–759. http ://dx .doi .org /10 .1038 /nri1703
Kawauchi, K., K. Araki, K. Tobiume, and N. Tanaka. 2009. Loss of p53 enhances catalytic activity of IKKβ through O-linked β-N-acetyl glucosamine modification. Proc. Natl. Acad. Sci. USA. 106:3431–3436. http ://dx .doi .org /10 .1073 /pnas .0813210106
Kimura, K., T. Yamada, M. Matsumoto, Y. Kido, T. Hosooka, S. Asahara, T. Matsuda, T. Ota, H. Watanabe, Y. Sai, et al. 2012. Endoplasmic reticulum stress inhibits STAT3-dependent suppression of hepatic gluconeogenesis via dephosphorylation and deacetylation. Diabetes. 61:61–73. http ://dx .doi .org /10 .2337 /db10 -1684
Komatsu, M., H. Kurokawa, S. Waguri, K. Taguchi, A. Kobayashi, Y. Ichimura, Y.S. Sou, I. Ueno, A. Sakamoto, K.I. Tong, et al. 2010. The selective au-tophagy substrate p62 activates the stress responsive transcription factor Nrf2 through inactivation of Keap1. Nat. Cell Biol. 12:213–223. Mathew, R., M.P. Seiler, S.T. Scanlon, A.P. Mao, M.G. Constantinides, C.
Bertozzi-Villa, J.D. Singer, and A. Bendelac. 2012. BTB-ZF factors recruit the E3 ligase cullin 3 to regulate lymphoid effector programs. Nature. 491:618–621. http ://dx .doi .org /10 .1038 /nature11548 Mathew, R., A.P. Mao, A.H. Chiang, C. Bertozzi-Villa, J.J. Bunker, S.T.
Scanlon, B.D. McDonald, M.G. Constantinides, K. Hollister, J.D. Singer, et al. 2014. A negative feedback loop mediated by the Bcl6-cullin 3 complex limits Tfh cell differentiation. J. Exp. Med. 211:1137–1151. http ://dx .doi .org /10 .1084 /jem .20132267
McEvoy, J.D., U. Kossatz, N. Malek, and J.D. Singer. 2007. Constitutive turnover of cyclin E by Cul3 maintains quiescence. Mol. Cell. Biol. 27:3651–3666. http ://dx .doi .org /10 .1128 /MCB .00720 -06
Mitsuishi, Y., K. Taguchi, Y. Kawatani, T. Shibata, T. Nukiwa, H. Aburatani, M. Yamamoto, and H. Motohashi. 2012. Nrf2 redirects glucose and glutamine into anabolic pathways in metabolic reprogramming. Cancer Cell. 22:66–79. http ://dx .doi .org /10 .1016 /j .ccr .2012 .05 .016
Moran, J.P., J. Walter, G.W. Tannock, S.L. Tonkonogy, and R.B. Sartor. 2009. Bifidobacterium animalis causes extensive duodenitis and mild colonic inflammation in monoassociated interleukin-10-deficient mice. Inflamm. Bowel Dis. 15:1022–1031. http ://dx .doi .org /10 .1002 /ibd .20900 Neufert, C., C. Becker, and M.F. Neurath. 2007. An inducible mouse model
of colon carcinogenesis for the analysis of sporadic and inflammation-driven tumor progression. Nat. Protoc. 2:1998–2004. http ://dx .doi .org /10 .1038 /nprot .2007 .279
O’Neill, L.A., and D.G. Hardie. 2013. Metabolism of inflammation limited by AMPK and pseudo-starvation. Nature. 493:346–355. http ://dx .doi .org /10 .1038 /nature11862
O’Shea, J.J., and R. Plenge. 2012. JAK and STAT signaling molecules in immunoregulation and immune-mediated disease. Immunity. 36:542– 550. http ://dx .doi .org /10 .1016 /j .immuni .2012 .03 .014
Ozcan, U., Q. Cao, E. Yilmaz, A.H. Lee, N.N. Iwakoshi, E. Ozdelen, G. Tuncman, C. Görgün, L.H. Glimcher, and G.S. Hotamisligil. 2004. Endoplasmic reticulum stress links obesity, insulin action, and type 2 diabetes. Science. 306:457–461. http ://dx .doi .org /10 .1126 /science .1103160
Pathak, S., V.S. Borodkin, O. Albarbarawi, D.G. Campbell, A. Ibrahim, and D.M. van Aalten. 2012. O-GlcNAcylation of TAB1 modulates TAK1-mediated cytokine release. EMBO J. 31:1394–1404. http ://dx .doi .org /10 .1038 /emboj .2012 .8
Pearce, E.L., M.C. Poffenberger, C.H. Chang, and R.G. Jones. 2013. Fueling immunity: Insights into metabolism and lymphocyte function. Science. 342:1242454. http ://dx .doi .org /10 .1126 /science .1242454
Ramakrishnan, P., P.M. Clark, D.E. Mason, E.C. Peters, L.C. Hsieh-Wilson, and D. Baltimore. 2013. Activation of the transcriptional function of the NF-κB protein c-Rel by O-GlcNAc glycosylation. Sci. Signal. 6:ra75. http ://dx .doi .org /10 .1126 /scisignal .2004097
Ruan, H.B., J.P. Singh, M.D. Li, J. Wu, and X. Yang. 2013. Cracking the O-GlcNAc code in metabolism. Trends Endocrinol. Metab. 24:301–309. http ://dx .doi .org /10 .1016 /j .tem .2013 .02 .002
Salcedo, R., A. Worschech, M. Cardone, Y. Jones, Z. Gyulai, R.M. Dai, E. Wang, W. Ma, D. Haines, C. O’hUigin, et al. 2010. MyD88-mediated signaling prevents development of adenocarcinomas of the colon: Role of interleukin 18. J. Exp. Med. 207:1625–1636. http ://dx .doi .org /10 .1084 /jem .20100199
Saleh, M., and G. Trinchieri. 2011. Innate immune mechanisms of colitis and colitis-associated colorectal cancer. Nat. Rev. Immunol. 11:9–20. http :// dx .doi .org /10 .1038 /nri2891
Singer, J.D., M. Gurian-West, B. Clurman, and J.M. Roberts. 1999. Cullin-3 targets cyclin E for ubiquitination and controls S phase in mammalian cells. Genes Dev. 13:2375–2387. http ://dx .doi .org /10 .1101 /gad .13 .18 .2375
Singh, A., C. Happel, S.K. Manna, G. Acquaah-Mensah, J. Carrerero, S. Kumar, P. Nasipuri, K.W. Krausz, N. Wakabayashi, R. Dewi, et al. 2013. Transcription factor NRF2 regulates miR-1 and miR-206 to drive tumorigenesis. J. Clin. Invest. 123:2921–2934. http ://dx .doi .org /10 .1172 /JCI66353
Slawson, C., and G.W. Hart. 2011. O-GlcNAc signalling: Implications for cancer cell biology. Nat. Rev. Cancer. 11:678–684. http ://dx .doi .org /10 .1038 /nrc3114
Stark, G.R., and J.E. Darnell Jr. 2012. The JAK-STAT pathway at twenty. Immunity. 36:503–514. http ://dx .doi .org /10 .1016 /j .immuni .2012 .03 .013
Swamy, M., S. Pathak, K.M. Grzes, S. Damerow, L.V. Sinclair, D.M. van Aalten, and D.A. Cantrell. 2016. Glucose and glutamine fuel protein O-GlcNAcylation to control T cell self-renewal and malignancy. Nat. Immunol. 17:712–720. http ://dx .doi .org /10 .1038 /ni .3439
Takeda, K., B.E. Clausen, T. Kaisho, T. Tsujimura, N. Terada, I. Förster, and S. Akira. 1999. Enhanced Th1 activity and development of chronic enterocolitis in mice devoid of Stat3 in macrophages and neutrophils. Immunity. 10:39–49. http ://dx .doi .org /10 .1016 /S1074 -7613(00)80005 -9
Wang, Z.V., Y. Deng, N. Gao, Z. Pedrozo, D.L. Li, C.R. Morales, A. Criollo, X. Luo, W. Tan, N. Jiang, et al. 2014. Spliced X-box binding protein 1 couples the unfolded protein response to hexosamine biosynthetic
pathway. Cell. 156:1179–1192. http ://dx .doi .org /10 .1016 /j .cell .2014 .01 .014
Wells, L., L.K. Kreppel, F.I. Comer, B.E. Wadzinski, and G.W. Hart. 2004. O-GlcNAc transferase is in a functional complex with protein phosphatase 1 catalytic subunits. J. Biol. Chem. 279:38466–38470. http ://dx .doi .org /10 .1074 /jbc .M406481200
West, N.R., S. McCuaig, F. Franchini, and F. Powrie. 2015. Emerging cytokine networks in colorectal cancer. Nat. Rev. Immunol. 15:615–629. http ://dx .doi .org /10 .1038 /nri3896
Whelan, S.A., M.D. Lane, and G.W. Hart. 2008. Regulation of the O-linked beta-N-acetylglucosamine transferase by insulin signaling. J. Biol. Chem. 283:21411–21417. http ://dx .doi .org /10 .1074 /jbc .M800677200 Wirtz, S., C. Neufert, B. Weigmann, and M.F. Neurath. 2007. Chemically
induced mouse models of intestinal inflammation. Nat. Protoc. 2:541– 546. http ://dx .doi .org /10 .1038 /nprot .2007 .41
Yang, W.H., S.Y. Park, H.W. Nam, D.H. Kim, J.G. Kang, E.S. Kang, Y.S. Kim, H.C. Lee, K.S. Kim, and J.W. Cho. 2008. NFκB activation is associated with its O-GlcNAcylation state under hyperglycemic conditions. Proc. Natl. Acad. Sci. USA. 105:17345–17350. http ://dx .doi .org /10 .1073 / pnas .0806198105
Yang, X., F. Zhang, and J.E. Kudlow. 2002. Recruitment of O-GlcNAc transferase to promoters by corepressor mSin3A: Coupling protein O-GlcNAcylation to transcriptional repression. Cell. 110:69–80. http :// dx .doi .org /10 .1016 /S0092 -8674(02)00810 -3
Yang, Y.R., D.H. Kim, Y.K. Seo, D. Park, H.J. Jang, S.Y. Choi, Y.H. Lee, G.H. Lee, K. Nakajima, N. Taniguchi, et al. 2015b. Elevated O-GlcNAcylation promotes colonic inflammation and tumorigenesis by modulating NF-κB signaling. Oncotarget. 6:12529–12542. http ://dx .doi .org /10 .18632 /oncotarget .3725
Yang, Y., X. Yin, H. Yang, and Y. Xu. 2015a. Histone demethylase LSD2 acts as an E3 ubiquitin ligase and inhibits cancer cell growth through promoting proteasomal degradation of OGT. Mol. Cell. 58:47–59. http ://dx .doi .org /10 .1016 /j .molcel .2015 .01 .038
Yu, H., D. Pardoll, and R. Jove. 2009. STATs in cancer inflammation and immunity: A leading role for STAT3. Nat. Rev. Cancer. 9:798–809. http ://dx .doi .org /10 .1038 /nrc2734
Yuan, M., S.B. Breitkopf, X. Yang, and J.M. Asara. 2012. A positive/negative ion-switching, targeted mass spectrometry-based metabolomics platform for bodily fluids, cells, and fresh and fixed tissue. Nat. Protoc. 7:872–881. http ://dx .doi .org /10 .1038 /nprot .2012 .024