TARGETED DELIVERY OF SIRNA TO THE TUMOR
Shyh-Dar Li
A dissertation submitted to the faculty of the University of North Carolina at Chapel Hill in partial fulfillment of the requirements for the degree of Doctor of Philosophy in the School of Pharmacy.
Chapel Hill 2008
Approved by, Pilar Blancafort, Ph.D., Assistant Professor, Department of Pharmacology Moo J. Cho, Ph.D., Associate Professor, School of Pharmacy Leaf Huang, Ph.D., Professor, School of Pharmacy Russell Mumper, Ph.D., Professor, School of Pharmacy
© 2008 Shyh-Dar Li
ABSTRACT
SHYH-DAR LI: Targeted Delivery of siRNA to the Tumor (Under the direction of Leaf Huang, Ph.D.)
We have developed a surface-modified LPD (liposome-polycation-DNA) nanoparticle formulation by mixing cationic liposomes, a polycationic peptide and nucleic acids (mixture of DNA and siRNA) at a fixed ratio, followed by post-inserting a PEGylated lipid. This self-assembled nanoparticle formulation was around 100 nm in diameter with 90% encapsulation efficiency for siRNA. The nucleic acid was complexed with the peptide into a compact core, which was coated with two lipid bilayers. The inner lipid bilayer was stabilized by the charge-charge interaction between the cationic lipids and the compact core. Upon addition of a PEGylated lipid, the outer lipid bilayer was stripped off and the lipid anchor was inserted into the outer leaflet of the inner bilayer, resulting in approximately 10.6 mol% modification of PEG (polyethylene glycol) on the surface of the nanoparticles. The high degree of PEGylation completely shielded the charge of the nanoparticles with the zeta potential close to neutral (-5.6 ± 4.5 mV) and abolished the reticuloendothelial uptake in the isolated liver.
ACKNOWLEDGEMENTS
I would like thank my academic advisor, Dr. Leaf Huang, for his guidance and support on my research. I also thank my committee members, Drs. Xiao, Mumper, Cho and Blancafort, for their suggestions on my dissertation project. The kind assistance from the Huang lab during my graduate research and study is acknowledged. I also appreciate the supports from my friends, family and my beloved wife.
TABLE OF CONTENTS
LIST OF TABLES ... xii
LIST OF FIGURES ... xiii
CHAPTER 1.0 INTRODUCTION...1
1.1 DELIVERY BARRIERS FOR SIRNA...2
1.2 SIGNIFICANT PROGRESS OVER THE PAST YEAR...2
1.2.1 Chemical modification approach... 2
1.2.1.1 Mechanisms and optimization of in vivo delivery of lipophilic siRNA ...2
1.2.1.2 Dynamic PolyConjugates for targeted delivery of siRNA ...4
1.2.2 Nanoparticle approach ... 4
1.2.2.1 Complexation of siRNA with cationic carriers ...5
1.2.2.2 Modification of nanoparticles with PEG ...6
1.2.2.3 Conjugation of a targeting ligand ...7
1.2.2.4 Incorporation of an endosomolytic component ...8
1.2.3 Other approaches... 9
1.2.4 Management of immunotoxicity of siRNA ... 10
1.3 PERSPECTIVES FOR SIRNA DELIVERY ...10
1.3.3 Self-assembled nanoparticles vs chemically conjugated
nanoparticles ... 12
1.3.4 Multiple siRNA sequences delivery... 13
1.3.5 Targeting diseased cells vs the surrounding vascular endothelial cells ... 14
1.3.6 Other critical issues... 15
1.3.6.1 siRNA release from the nanoparticles ...15
1.3.6.2 Pharmacokinetics/biodistribution...15
1.3.6.3 Stability...15
1.3.6.4 Toxicity ...16
1.3.6.5 Dose ...16
2.0 DEVELOPMENT AND CHARACTERIZATION OF THE LPD (LIPOSOME-POLYCATION-DNA) NANOPARTICLE FORMULATION FOR SIRNA...18
2.1 INTRODUCTION ...19
2.2 MATERIALS AND METHODS ...21
2.2.1 Materials ... 21
2.2.2 Experimental animals... 22
2.2.3 Preparation of siRNA containing LPD nanoparticles ... 22
2.2.4 Negative stain electron microscopy ... 24
2.2.5 Size exclusion chromatography ... 24
2.2.6 Cellular Uptake Study ... 24
2.2.7 Isolated liver perfusion study... 25
2.2.8 Statistical analysis ... 26
3.0 TUMOR-TARGETED DELIVERY OF SIRNA BY SELF-ASSEMBLED
NANOPARTICLES...38
3.1 INTRODUCTION ...39
3.2 MATERIALS AND METHODS ...40
3.2.1 Materials ... 40
3.2.2 Experimental animals... 41
3.2.3 NP preparations ... 41
3.2.4 In vitro cellular uptake study ... 41
3.2.5 In vitro gene silencing study... 42
3.2.6 In vitro cytotoxicity study. ... 42
3.2.7 Immunocytochemistry... 42
3.2.8 Pharmacokinetics (PK) study. ... 43
3.2.9 Tissue distribution and tumor uptake study ... 44
3.2.10 Immunohistochemistry and Western blot ... 44
3.2.11 Tumor growth inhibition study. ... 45
3.2.12 Cytokine induction studies... 45
3.2.13 Liver enzyme assay ... 46
3.2.14 Statistical analysis ... 46
3.3 RESULTS ...47
3.3.1 PK studies, tissue distribution, and intracellular uptake of siRNA ... 47
3.3.2 EGFR gene silencing, apoptosis induction, and tumor growth inhibition... 52
3.3.3 Toxicity and immune response studies in normal mice... 55
4.0 EFFICIENT GENE SILENCING IN METASTATIC TUMOR BY SIRNA
FORMULATED IN SURFACE-MODIFIED NANOPARTICLES ...62
4.1 INTRODUCTION ...63
4.2 MATERIALS AND METHODS ...64
4.2.1 Materials ... 64
4.2.2 Experimental animals... 65
4.2.3 Preparation of siRNA containing nanoparticles ... 65
4.2.4 In vitro cellular uptake study ... 65
4.2.5 In vitro luciferase gene silencing study ... 66
4.2.6 Tissue distribution study ... 66
4.2.7 Immunohistochemistry... 67
4.2.8 In vivo gene silencing study... 67
4.2.9 Cytokine induction assay... 68
4.2.10 Statistical analysis ... 68
4.3 RESULTS ...69
4.3.1 Characterization of NP... 69
4.3.2 In vitro cellular uptake... 69
4.3.3 In vitro luciferase gene silencing ... 70
4.3.4 Tissue distribution of cy3-siRNA... 71
4.3.5 Immunohistochemistry of sigma receptor ... 72
4.3.6 In vivo luciferase gene silencing... 74
4.3.7 Cytokine induction study ... 74
4.4 DISCUSSION...76
5.0 EFFICIENT ONCOGENE SILENCING AND METASTASIS
INHIBITION VIA SYSTEMIC DELIVERY OF SIRNA...81
5.1 INTRODUCTION ...82
5.2 MATERIALS AND METHODS ...83
5.2.1 Materials ... 83
5.2.2 siRNA ... 84
5.2.3 Experimental animals... 84
5.2.4 Preparation of siRNA containing NP... 85
5.2.5 In vitro gene silencing study... 85
5.2.6 In vivo gene silencing study... 86
5.2.7 In vivo metastasis inhibition study and survival analysis ... 86
5.2.8 Cytokine induction assay... 87
5.2.9 Local cytokine production analysis. ... 87
5.2.10 Quantitative RT-PCR... 88
5.2.11 Toxicity assay. ... 89
5.2.12 Statistical analysis ... 89
5.3 RESULTS ...89
5.3.1 In vivo gene silencing study... 89
5.3.2 In vivo antitumor/antimetastasis study... 91
5.3.3 Toxicity study ... 92
5.4 DISCUSSION...95
6.0 DISCUSSION ...100
6.1 SUMMARY OF RESEARCH RESULTS AND FUTURE PLANS...100
6.2.1 Formulation ... 102
6.2.2 Pharmacokinetic study ... 104
6.2.2.1 Extraction recovery and the dose recovery from the major organs ...104
6.2.2.2 Can the high tumor uptake of the FAM-siRNA in nanoparticles be model dependent? ...104
6.3 FURTHER DIRECTIONS ...106
6.4 ENDING REMARKS...110
APPENDIX A ...111
APPENDIX B ...113
APPENDIX C ...116
LIST OF TABLES
Table 1.1 Summary of siRNA delivery technologies using nanoparticle approach ... 5 Table 1.2 Comparison of the siRNA formulations ... 17 Table 3.1 Comparison of pharmacokinetic parameters of FAM-siRNA in different
LIST OF FIGURES
Figure 2.1 Illustration of the formation of LPD... 21
Figure 2.2 Stability of the nanoparticle formulations upon different degree of PEGylation.. 26
Figure 2.3 TEM photographs of liposomes/PEGylated liposomes and LPD/PEGylated LPD. ... 28
Figure 2.4 Size exclusion chromatography of different samples... 31
Figure 2.5 Zeta potential of different formulations. ... 32
Figure 2.6 Chemical structures of DSPE-PEG (A) and DSPE-PEG-anisamide (B). ... 33
Figure 2.7 Fluorescence intensities of cells (A) and fluorescence photographs of cells (B) treated with FAM-siRNA containing formulations. ... 33
Figure 2.8 Liver sinusoidal uptake of cy3-siRNA (red) in different LPD formulations. ... 34
Figure 2.9 Proposed mechanism for the formation of PEGylated LPD. ... 36
Figure 3.1 Serum concentration profiles of FAM-siRNA in different formulations... 48
Figure 3.2 Tissue distribution study... 51
Figure 3.3 Tumoral uptake of FAM-siRNA in different formulations... 52
Figure 3.4 Immunohistochemical analysis of the tumor samples... 53
Figure 3.5 Western blot analysis of EGFR in the NCI-H460 xenograft tumor after treatment with different formulations. ... 54
Figure 3.6 NCI-H460 xenograft tumor growth inhibition by siRNA in different formulations with or without the combination of cisplatin... 54
Figure 3.7 Serum cytokine analysis... 56
Figure 3.8 Serum ALT and AST analysis... 57
Figure 3.9 Mouse body weight during the treatment of different siRNA formulations. ... 57
Figure 3.10 In vitro cellular uptake and gene silencing analysis... 58
Figure 4.1 Fluorescence intensities of cell lysate from cells treated with FAM-siRNA
containing formulations. ... 70
Figure 4.2 In vitro luciferase gene silencing effect of different siRNA formulations (A) and the AAC (area above the curve) of different formulations in figure 4.2A (B)... 71
Figure 4.3 Confocal microscopy photographs of the lungs (A) and livers (B) collected from the tumor free (a) and B16F10 tumor bearing mice (b). ... 73
Figure 4.4 In vivo luciferase gene silencing effect of different siRNA formulations at the dose of 150 μg/kg (A) and that of the targeted NP at various doses (B). ... 75
Figure 4.5 The serum cytokine concentrations of the mice 2 h after the i.v. injections of siRNA in different formulations. ... 76
Figure 5.1 Immunohistochemical analysis on the lung metastasis... 90
Figure 5.2 Western blot analysis on the tumor loaded lung. ... 90
Figure 5.3 Anti-metastasis efficacy of different siRNA formulations... 93
Figure 5.4 Serum cytokine analysis... 94
Figure 5.5 Toxicity assay... 94
Figure 5.6 Tissue section examination... 95
Figure 5.7 Relative mRNA level in the B16F10 cells 12 h after treatment with single or combined sequences formulated in the targeted NP. ... 97
Figure 5.8 Immunocytochemical analysis on the B16F10 cells. ... 97
Figure 6.1 Tissue distribution of fluorescently labeled siRNA in different animal models. 106 Figure 6.2 Proposed method for preparing a nanoparticle with a supported bilayer by amphipathic polymer ... 108
Figure 6.3 Preparation of a nanoparticle with a supported bilayer by the polymerization method... 109
1.0 INTRODUCTION
1.1 DELIVERY BARRIERS FOR SIRNA
There are at least five major barriers that prevent efficient delivery of siRNA into target cells [4], including (a) siRNA degradation by the nuclease in the blood and extracellular fluids, (b) non-specific elimination by the reticuloendothelial system (RES) in the liver and spleen, (c) extravasation of siRNA into the target tissue, (d) cell membrane penetration and (e) escape of the siRNA from the endosome and/or the carrier into the cytoplasm. To achieve a significant gene silencing effect, a variety of different strategies have been developed to overcome the barriers.
1.2 SIGNIFICANT PROGRESS OVER THE PAST YEAR
1.2.1 Chemical modification approach
Chemical modification of siRNA involves the modification on the nucleic acid backbone to increase the nuclease resistance and/or the conjugation of a lipophilic moiety at the end of sequence to improve the membrane penetration [2,4]. Backbone chemistry includes 2’-fluoro, 2’-O-methyl and phosphothioate. Cholesterol is the most commonly used moiety for increasing the cellular bioavailability.
1.2.1.1 Mechanisms and optimization of in vivo delivery of lipophilic siRNA
the mechanism of tissue targeting [5]. They found that selective tissue uptake of the siRNA conjugates was due to the binding with serum lipoproteins. Conjugates that had high affinity for serum albumin over lipoproteins showed little liver uptake, leading to an insignificant RNAi effect. On the other hand, lipophilic siRNA that showed high association with lipoproteins had improved liver uptake and gene silencing activity. They demonstrated that high-density lipoprotein (HDL) enhanced the uptake of conjugated siRNA in the liver, gut, kidney and steroidogenic tissues via the scavenger receptor BI (SR-BI). Some lipophilic siRNA also bound with low-density lipoprotein (LDL) and were delivered to the liver through the LDL receptor. Additionally, the transmembrane protein Sid1 was required for the cellular uptake of the conjugated siRNA complexed with lipoproteins. It is noted that cholesterol conjugated siRNA against apolipoprotein B (apoB) decreased the serum level of LDL, which happened to be its major carrier. It is expected that the gene silencing effect of the subsequent administrations should be compromised. It may be argued that the serum level of LDL can serve as a regulator for the degree of gene silencing in order to maintain a desirable pharmacological effect. Nevertheless, when the siRNA is designed for other targets, the activity will be highly dependent on the LDL level in the individual, leading to a possible high degree of variability.
injection of the cholesterol-siRNA. The treatment significantly prolonged the survival of striatal neurons, reduced neuropil aggregates, decreased inclusion size, and improved the movement of the treated mice.
1.2.1.2 Dynamic PolyConjugates for targeted delivery of siRNA
Rozema et al. attached the backbone modified siRNA with the so-called dynamic PolyConjugates composed of a backbone polymer (amphipathic poly(vinyl ether)), a pH sensitive linker (CDM, carboxy dimethylmaleic anhydride), polyethylene glycol (PEG) and a targeting ligand (NAG, N-acetylgalactosamine) [7]. The amine group in the backbone polymer was masked with PEG and the ligand via the pH sensitive linker. PEGylated approach was utilized to improve the pharmacokinetics of the conjugate and the NAG ligand was employed to enhance the hepatocyte delivery by targeting the asialoglycoprotein receptor. Once the conjugates were internalized by the receptor-mediated endocytosis and trapped inside the acidic endosome, the acid labile linker was cleaved and the amine group in the polymer was unmasked, which destabilized the endosomal membrane and mediated endosome rupture. Using this delivery technology, they successfully demonstrated effective knockdown of two endogenous genes in the mouse liver: apoB and peroxisome proliferator-activated receptor alpha (ppara). Downregulation of apoB led to a significant reduction in serum cholesterol with little toxicity.
1.2.2 Nanoparticle approach
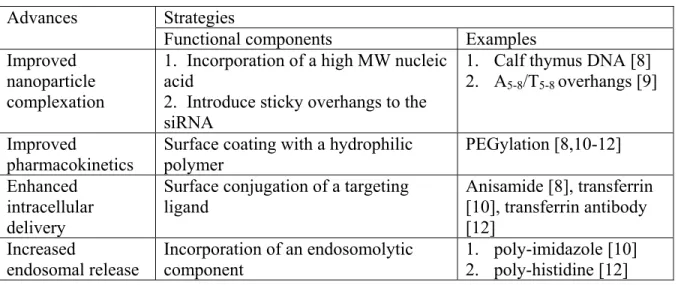
direct contact of nucleases with the siRNA. In addition, with the size around 100 nm, the renal clearance for the nanoparticles is minimal, resulting in prolonged blood circulation time and selective tissue accumulation [e.g. highly vasculatured tumor via the enhance permeability and retention (EPR) effect]. Nanoparticles can be generally categorized into two groups: lipid based and polymer based. Usually, four major components are incorporated in the formulation to overcome delivery barriers, including (a) a cationic carrier to condense siRNA into nanoparticles, (b) PEG to introduce steric hindrance for the nanoparticles to improve the circulation time and pharmacokinetics, (c) a targeting ligand to enhance the intracellular delivery and (d) an endosomolytic component, such as poly-imidazole or poly-histidine, to increase the bioavailability of the internalized siRNA. The advance of the nanoparticle formulation in these four aspects is discussed in the following sections and summarized in table 1.1.
Table 1.1 Summary of siRNA delivery technologies using nanoparticle approach
Strategies Advances
Functional components Examples
Improved nanoparticle complexation
1. Incorporation of a high MW nucleic acid
2. Introduce sticky overhangs to the siRNA
1. Calf thymus DNA [8] 2. A5-8/T5-8 overhangs [9]
Improved
pharmacokinetics Surface coating with a hydrophilic polymer PEGylation [8,10-12] Enhanced
intracellular delivery
Surface conjugation of a targeting
ligand Anisamide [8], transferrin [10], transferrin antibody [12]
Increased
endosomal release Incorporation of an endosomolytic component 1. 2. poly-imidazole [10] poly-histidine [12]
1.2.2.1 Complexation of siRNA with cationic carriers
with the anionic nucleic acid. The particle complexation is usually performed in a diluted concentration to avoid aggregation. Several groups found that cationic carriers, especially for polymers, formed looser complexes with siRNA than with plasmid DNA, resulted in unstable particle formation and reduced delivery efficiency [8,9]. This is probably due to the fact that the molecular weight of the siRNA is too low for an efficient polymer interaction. Li et al. mixed a carrier DNA, calf thymus DNA (average size 50 kbp), with the siRNA in their system to enhance the particle compaction [8]. The siRNA mixing with the calf thymus DNA was tightly complexed with protamine into a solid core, which was further coated with cationic lipid bilayers [so-called LPD (liposome-polycation-DNA) nanoparticles]. This improved formulation showed 10-30% decreased size and 20-80% increased delivery efficiency comparing with the formulation without the carrier DNA. Although the calf thymus DNA with limited immuno-stimulating CpG motifs did not enhance the immunotoxicity of the formulation; the foreign DNA containing nanoparticles may not be suitable for human use. Bolcato-Bellemin and colleagues added short complementary A5-8/T5-8 overhangs to make the siRNA bind to each other and form a large “gene-like” structure [9]. They found that the siRNA with the sticky overhangs had increased complex stability with polyethyleneimine (PEI), improved RNase protection and enhanced gene silencing up to 10-fold. After released in the cytoplasm, the sticky siRNA did not induce interferon response, suggesting the approach may be a good alternative.
1.2.2.2 Modification of nanoparticles with PEG
reduce the opsonization with the serum proteins, leading to decreased RES uptake and prolonged circulation time. Thus, surface PEGylation has been commonly employed in the nanoparticle field. Since PEG may interfere with the charge-charge interaction during the particle formation due to its steric hindrance, the PEGylation process is often performed after the particles are formed, especially for the lipid-based nanoparticles [8,12]. Linear cationic polymer, on the other hand, is usually PEGylated before complexed with siRNA [11], and therefore, has less problem of forming aggregates. For PEGylated cationic polymer, the positively charged functional groups are still available for siRNA if the ratio of PEG/charged groups is designed properly. Whereas the surface charge of the lipid based vesicles is greatly shielded by PEG and no longer accessible for siRNA.
Although significant efforts have been placed on finding other type of materials to replace PEG, little success has been reported.
1.2.2.3 Conjugation of a targeting ligand
suggesting that an immune response against the immunoliposomes was produced [14]. Second, the high-affinity binding of the ligand and receptor often results in tight association of the targeted nanoparticles with the target cells near the vasculature, leading to reduced tissue penetration [15]. Therefore, the new criteria for selecting targeting ligands have been changed: (a) an endogenous ligand that does not induce immune response, (b) a ligand that binds with the surface receptors overexpressed in the target cell and triggers rapid endocytosis, (c) a ligand that binds with the receptor with a relatively low affinity allowing improved tissue penetration [15].
It is noted that the modification of a targeting ligand on nanoparticles does not increase the target tissue accumulation but improve the intracellular delivery. Li et al. demonstrated that the pharmacokinetic parameters (clearance, area under the curve and mean residence time) remained the same for non-targeted and targeted nanoparticles, while the targeted nanoparticles showed improved intracellular delivery and RNAi effect [8]. Bartlett also published similar results showing that the targeted nanoparticles had similar pharmacokinetics as the non-targeted nanoparticles, but had enhanced gene silencing effect [10].
1.2.2.4 Incorporation of an endosomolytic component
imidazole [12]. At physiological pH, the amine groups stay neutral; while in the endosome (pH 5-6), the amine groups are protonated. This results in reduced free proton concentration and increased pH in the endosome. Due to the continuous influx of proton and its counter anion, chloride, into the endosome to maintain the low pH, the osmotic pressure in the endosome rises rapidly. Eventually, the endosome ruptures and nanoparticle/siRNA is released. The process is called the proton sponge effect [16] and has been experimentally verified [17]. The release of siRNA from the nanoparticle is probably the result of protein competition for polymer binding, although it has not been experimentally verified. The strategy has been shown to significantly increase the RNAi effect of the formulation [12]. For a cationic lipid based delivery system, formation of charge complex between the cationic lipid and the anionic endosomal lipid may lead to local dehydration and destabilization of the endosomal membrane [18], resulting in the release of the siRNA/lipid complex into the cytoplasm.
1.2.3 Other approaches
tumor accumulation and the RNAi effect of the formulation by magnetic resonance imaging (MRI) and optical imaging [19].
1.2.4 Management of immunotoxicity of siRNA
siRNA can be potent triggers for the immune response, particularly when associated with delivery vesicles that facilitate intracellular uptake. Judge et al. identified 5’-UGUGU-3’ within siRNA as one immunostimulatory motif and showed that the sequence recognition mechanism is stringent enough that minimal base substitution can have profound effects to reduce the immune response [20]. They showed that immune stimulation by synthetic siRNA can be completely diminished by selective incorporation of 2’-O-methyl (2’OMe) uridine or guanosine nucleosides into one strand of the siRNA duplex. The modified siRNA had full gene silencing activity and was tested in mice without generating cytokine induction, toxicity or off-target effects [21]. Recently, Robbins and colleagues showed that 2’-O-methyl-modified siRNA acted as a TLR7 antagonist that abolished the inflammatory toxicity of the immunostimulatory siRNA and a small-molecule TLR7 agonist, loxoribine [22].
1.3 PERSPECTIVES FOR SIRNA DELIVERY
Third, like all other oligonucleotides, siRNA can be chemically synthesized in high quantity and purity to meet the standards of a pharmaceutical grade drug. The significant progress over the past year highlighted above promises the future of siRNA as a new class of promising pharmaceutical. However, there are still several challenges ahead. In this section, different strategies for siRNA delivery are compared and the future perspectives are discussed.
1.3.1 Viral vs non-viral vector; expression vector vs synthetic siRNA
1.3.2 Chemical modification vs nanoparticle formulation approach
Wolfrum et al. showed that the lipophilic siRNA bound with different endogenous carriers for tissue targeting [5]. However, the application of the chemically conjugated siRNA is still limited for liver diseases. Different types of conjugation and their pharmacokinetics need to be studied to broaden the scope of the approach. Nanoparticle vector is mainly focused on the delivery to the highly vascularized inflammatory tissue or tumor by utilizing the EPR effect of the nanoparticle. Combination of these two approaches may expand the application and prolong the RNAi effect. Since the lipophilic siRNA binds to a natural nanoparticle carrier, i.e., lipoprotein, both approaches have the same limitation of being effective only with tissues equipped with a leaky vasculature. Delivery of siRNA to tissues with a tight vasculature, such as brain and muscle, will continue to be a challenge. In this regard, tissue-tropic viral vectors, such as AAV, may be a good alternative.
1.3.3 Self-assembled nanoparticles vs chemically conjugated nanoparticles
surface of the nanoparticles does not offer equal protection. During the chemical conjugation and purification process, loss of siRNA or its stability likely occurs. Additionally, shelf-life and scale-up production of the nanoparticles needs to be studied. On the other hand, self-assembled nanoparticles is usually prepared by mixing different components before use [8,11,12], which avoids the storage of the nanoparticles. Polymer and lipid vectors can be easily scaled up. Second, self-assembled nanoparticles provide a much higher drug/carrier ratio compared to the chemically conjugated nanoparticles. For examples, Bartlett and Davis demonstrated that each of their self-assembled nanoparticles contained ~2,000 siRNA molecules [25], while Medarova’s chemical conjugation method could only attach three siRNA molecules to a single nanoparticle [19]. Here, we predict that self-assembled nanoparticles will continue to dominate for siRNA delivery.
1.3.4 Multiple siRNA sequences delivery
for sufficient gene silencing before the treatment of other siRNA. Therefore, intensive pharmacokinetic and pharmacodynamic studies should be performed to fine tune the dosing regimen (dose, interval, frequency, order) for the combinatorial approach in order to achieve a synergistic effect.
1.3.5 Targeting diseased cells vs the surrounding vascular endothelial cells
1.3.6 Other critical issues
Other than the topics discussed above, there are at least five critical issues that need to be considered for developing a siRNA formulation.
1.3.6.1 siRNA release from the nanoparticles
Significant effort has been placed on improving the complexation of siRNA into nanoparticles, while the mechanism of siRNA release in the cytoplasm needs further study. Only the released siRNA is bioavailable. If the siRNA can be programmed for sustained release, the RNAi effect can be greatly prolonged.
1.3.6.2 Pharmacokinetics/biodistribution
Pharmacokinetic study allowing describing and predicting the behavior, efficacy and toxicity of siRNA formulation will eventually become a prerequisite. Several methods have been used for the study of pharmacokinetics of siRNA, including fluorescence labeling [8], radioisotope labeling [10], RNase protection assay [12] and LC-MS method. From the pharmaceutical point of view, only the LC-MS method is robust enough to perform the validated analysis. Unfortunately, LC-MS method is still limited by its low sensitivity. Therefore, a sensitive LC-MS method for siRNA is urgently needed.
1.3.6.3 Stability
efficiency and gene silencing activity. For an unstable formulation, lyophilization is a commonly used method for long term preservation [28].
1.3.6.4 Toxicity
Preliminary toxicity of the formulation can be evaluated by blood chemistry, liver enzyme analysis, body-weight monitor and proinflammatory cytokine analysis in rodents. However, dose escalating study should be done in non-human primates to study the complement depletion and antibody production against the nanoparticle formulation [11].
1.3.6.5 Dose
Table 1.2 Comparison of the siRNA formulations
Category Formulation Required
dose (mg/kg) Times of repeated injections Native siRNA (N) or modified siRNA (M) Target
tissue Re-ference
Anisamide-LPD 1.2 3 N Tumor [8]
Transferrin-cyclodextran polycation
2.5 2-3 N Tumor [24]
Self-assembled nanoparticles
Immuno-lipoplex 3 3 M Tumor [12]
Peptide based
vector RVG peptide-9R 2.5 3 N Brain [13]
Chemically conjugated nanoparticles
Magnetic nanoparticles
~6 4 N Tumor [19]
Dynamic Poly-conjugates
~2.5 1 M Liver [7]
Chemically modified nanoparticles
2.0 DEVELOPMENT AND CHARACTERIZATION OF THE LPD (LIPOSOME-POLYCATION-DNA) NANOPARTICLE FORMULATION FOR SIRNA
DSPE-PEG (20.6 ± 3.4%) was incorporated onto the inner bilayer of LPD with about 10.6 mol% of DSPE-PEG presented on the particle surface. This led to a complete charge shielding (zeta potential = -5.6 ± 4.5 mV) and abolishment of liver sinusoidal uptake in the isolated liver perfusion model. Our results demonstrated the importance of the supported bilayer in improving the stability of a nanoparticle formulation.
2.1 INTRODUCTION
Prolongation of the circulation half-life by surface incorporation of PEG in liposomes was demonstrated by our group in 1990 [29]. Surface modification by PEG was shown to reduce non-specific uptake of liposomes by the reticuloendothelial system (RES) in the liver and the spleen and thus improved its pharmacokinetic property. PEGylation approach has been used in a variety of nanoparticle systems to enhance the drug delivery.
bilayer was 1:1.8, indicating that approximately 36.4% of the total lipids was located in the inner bilayer and 63.6% was in the outer bilayer. The formation mechanism of the LPD has been proposed (figure 1C) [35]. First, the cationic peptide interacted with the nucleic acid and formed a negatively charged complex, which then interacted with the cationic liposomes via a charge-charge interaction. Second, upon the strong charge-charge interaction, the liposomes collapsed onto the peptide-nucleic acid complex core. Third, two separate lipid bilayer membranes appear on the surface of the LPD nanoparticle as the result of bilayer fusion and re-organization. In this model, the inner bilayer is directly in contact with the core and is supported and stabilized by the charge-charge interaction of the cationic lipids and the negatively charged complex core. We hypothesized that a supported bilayer tolerates a high level of DSPE-PEG, which is a surfactant, better than a regular bilayer. This unique feature of LPD may provide us an opportunity to modify the formulation with a high amount of DSPE-PEG to achieve an enhanced surface shielding and thus improve the pharmacokinetic property of the nanoparticle formulation.
Figure 2.1 Illustration of the formation of LPD.
Cryo-TEM photograph (A), the illustration of the double lipid bilayer structure (B) and proposed mechanism for the formation of the LPD nanoparticles (C). Figure 1A was reproduced from Tan et al. with the authors’ permission [35].
2.2 MATERIALS AND METHODS
2.2.1 Materials
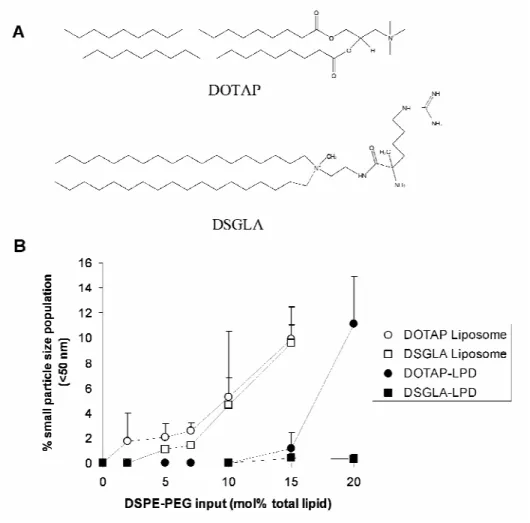
(Alabaster, AL). Protamine sulfate (fraction X from salmon sperm), calf thymus DNA (for hybridization, phenol-chloroform extracted and ethanol precipitated), and Sepharose CL 2B were from Sigma-Aldrich (St. Louis, MO). DSGLA (distearoyl guanidine lysine amide) was synthesized in our lab and the structure is shown in figure 2.2A.
Anti-luciferase siRNA (GL3) (target sequence 5'- CTT ACG CTG AGT ACT TCG A -3') was purchased from Dharmacon (Lafayette, CO) in deprotected, desalted, annealed form. Fluorescein (FAM) labeled siRNA (3’ end of the sense strand) was used to evaluate the incorporation efficiency of the LPD for siRNA. Cy3 labeled siRNA was used for the isolated liver perfusion study.
2.2.2 Experimental animals
Female C57BL/6 mice of age 6-8 week (16-18 g) were purchased from Charles River Laboratories (Wilmington, MA). All work performed with animals was in accordance with and approved by the IACUC committee at the University of North Carolina at Chapel Hill (UNC).
2.2.3 Preparation of siRNA containing LPD nanoparticles
Method 1: Small unilamellar liposomes consisting of DOTAP and cholesterol (1:1 molar ratio) were prepared by thin film hydration followed by membrane extrusion through a 50 nm polycarbonate membrane by 10-15 times. The total lipid concentration of the liposome was fixed at 10 mM and the liposome size was 90-100 nm. LPD was composed of DOTAP/cholesterol liposome, protamine, and the mixture of siRNA and calf thymus DNA (1:1 weight ratio). To prepare LPD, 15 μl of protamine (2 mg/ml), of 138 μl nuclease free water, and 24 μl of a mixture of siRNA and calf thymus DNA (2 mg/ml) were quickly mixed in a 1.5 ml tube. The complex was allowed to stand at room temperature for 10 min before the addition of 123 μl of DOTAP/cholesterol liposome (total lipid concentration = 10 mM). LPD nanoparticles were kept at room temperature for another 10 min before further application.
Method 2: LPD was obtained by quickly mixing suspension A (8.3 mM liposomes (DOTAP: cholesterol = 1: 1, molar ratio) and 0.2 mg/ml protamine in 150 μl nuclease free water) with solution B (0.16 mg/ml siRNA and 0.16 mg/ml calf thymus DNA in 150 μl nuclease free water) followed by incubation at room temperature for 10 min.
PEGylated LPD was prepared by incubating the LPD suspension (300 μl) with 37.8
μl micelle solution of DSPE-PEG (10 mg/ml) at 50°C for 10 min. PEGylated LPD was allowed to stand at room temperature for 10 min.
freshly prepared and used within 20 min for the following experiments. For size exclusion chromatography, either 10 mol% NBD-DOTAP labeled liposomes, 10 mol% DSPE-PEG-CF labeled DSPE-PEG or FAM-siRNA was used for the preparation of the PEGylated LPD.
2.2.4 Negative stain electron microscopy
Transmission electron microscope (TEM) images were acquired using a Phillips CM12 (FEI, Hillsboro, OR). Briefly, freshly prepared formulations (5 μl) samples were dropped onto 300 mesh carbon-coated copper grids (Ted Pella, Inc., Redding, CA) and allowed a short incubation (5 min) at room temperature. Grids were then stained with 1% uranyl acetate (40
μl) and wicked dry. All images were acquired at an accelerating voltage of 100 kV. Gatan Digital Micrograph software was used to analyze the images.
2.2.5 Size exclusion chromatography
Ten μl of the samples was loaded onto a PBS pre-equilibrated Sepharose CL 2B column (1 × 10 cm). Elute fractions (200-300 μl) were collected, diluted 1:1 in ethanol, and analyzed for fluorescence intensity by a plate reader (λex: 485 nm, λem: 535 nm) (PLATE CHAMELEON Multilabel Detection Platform, Bioscan Inc., Washington, DC).
2.2.6 Cellular Uptake Study
concentration of 100 nM siRNA in serum containing medium at 37 oC for 4 h. Cells were washed twice with PBS, followed by incubation with lysis buffer (0.3% triton X-100 in PBS) at room temperature for 1 h. Fluorescence intensity of cell lysate was determined by a Perkin Elmer LS 50B Luminescence spectromer (Norwalk, CT) (λex: 494 nm, λem: 519 nm). For
free ligand competition study, cells were co-incubated with 50 µM haloperidol with formulations. Alternatively, cells were fixed with methanol at room temperature for 1 min, mounted onto a glass slide, and imaged by a Nikon fluorescence phase contrast optical microscope.
2.2.7 Isolated liver perfusion study
C57BL/6 mice were sacrificed and the interior vena cava was incised to allow the blood flush out when 3 ml of warm PBS was infused into the mouse liver through the portal vein. cy3-siRNA containing LPD formulations (300 μl) were incubated with 50 μl mouse serum at 37°C for 10 min, and then diluted with PBS (final volume = 1 ml). The complex was infused into the isolated liver via the portal vein. Finally, the liver was perfused with 3 ml warm PBS, excised, fixed in 3.6% paraformaldehyde in PBS for overnight, and frozen sectioned (5
2.2.8 Statistical analysis
Data are presented as the mean ± SD. The statistical significance was determined by using the analysis of variance (ANOVA, one way) or the two-sided student t-test. P values of <0.05 were considered to be significant.
Figure 2.2 Stability of the nanoparticle formulations upon different degree of PEGylation.
2.3 RESULTS AND DISCUSSION
the PEGylated LPD formulation containing DOTAP (figure 2.3). It is also noticed that DSGLA (contains 3 positive charges)-LPD showed an improved stability compared to DOTAP (contains 1 positive charge)-LPD (figure 2.2B), suggesting that LPD was stabilized by charge-charge interaction. Dynamic light scattering is a convenient method to assess the relative stability of the particles. For example, smaller size particles were found in the TEM photographs of the PEGylated LPD (figure 2.3, arrow heads), while light scattering data showed no presence of smaller particles (figure 2.2B). It is known that particles of larger sizes showed significant higher light scattering compared to smaller size particles at the same concentration. Nevertheless, the dynamic light scattering data provided a quantitative comparison of the relative stability of different nanoparticle formulations.
Figure 2.3 TEM photographs of liposomes/PEGylated liposomes and LPD/PEGylated LPD.
As can be seen in figure 2.3, after 10 mol% PEGylation, DOTAP liposomes had transformed into tubular micellar structures, indicating the instability of the formulation. In the PEGylated LPD, however, “sprouts” were found in some of the particles (figure 2.3, arrows), suggesting that the lipids in the surface of the LPD were being stripped off and became smaller particles (figure 2.4, arrow heads).
Figure 2.4 Size exclusion chromatography of different samples.
(A) chromatography of pure DSPE-PEG and liposomes; (B) chromatography of DOTAP in different formulations; (C) chromatography of DSPE-PEG in different formulations; (D) chromatography of different components in the PEGylated LPD. DOTAP liposomes was labeled with NBD-DOTAP, DSPE-PEG micelle was labeled with DSPE-PEG-CF and siRNA was labeled with FAM-siRNA. Data are representative chromatography from 2-3 batches of formulations.
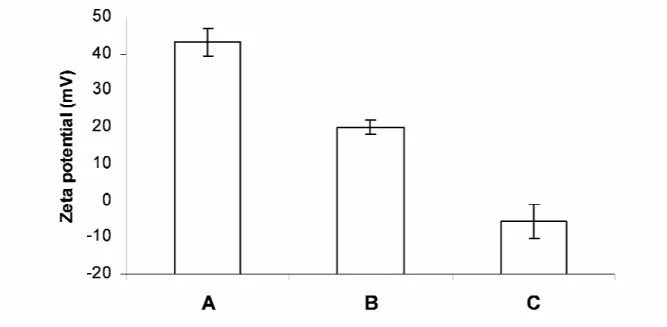
Figure 2.5 Zeta potential of different formulations.
(A) LPD; (B) LPD + 10 mol% DSPE-PEG; (C) LPD + 10 mol% DSPE-PEG after purified by the size exclusion column (first peak). Data = mean ± SD, n = 3
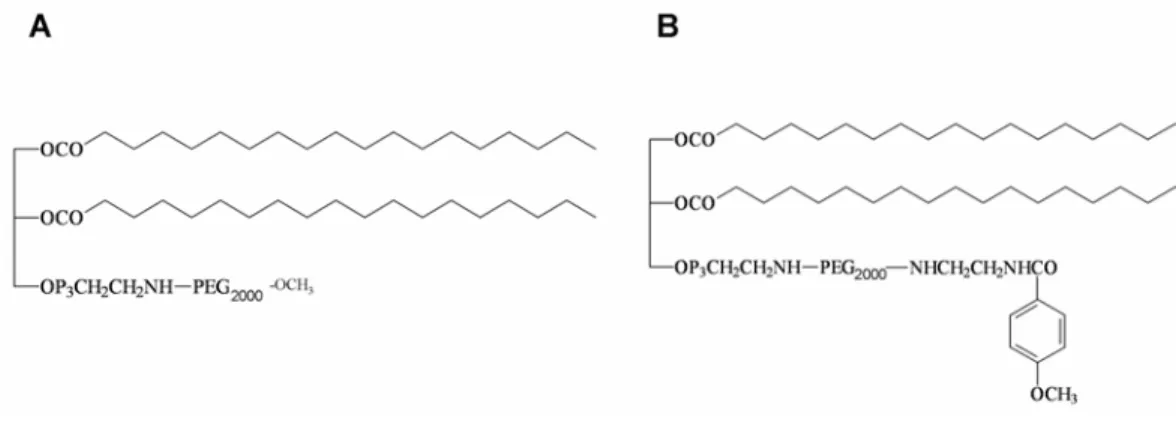
Figure 2.6 Chemical structures of DSPE-PEG (A) and DSPE-PEG-anisamide (B).
Figure 2.7 Fluorescence intensities of cells (A) and fluorescence photographs of cells (B) treated with FAM-siRNA containing formulations.
H1299 cells were incubated with different formulations at 37oC for 4 h in the presence (white bars) or absence
(black bars) of 50 µM haloperidol. Cells were washed and lysis. Cells lysates were analyzed for fluorescence intensities by a fluorescence spectrometer (λex: 494 nm, λem: 519 nm). Alternatively, cells were imaged with a fluorescence microscope. * indicates the significant difference between two groups (p<0.05).
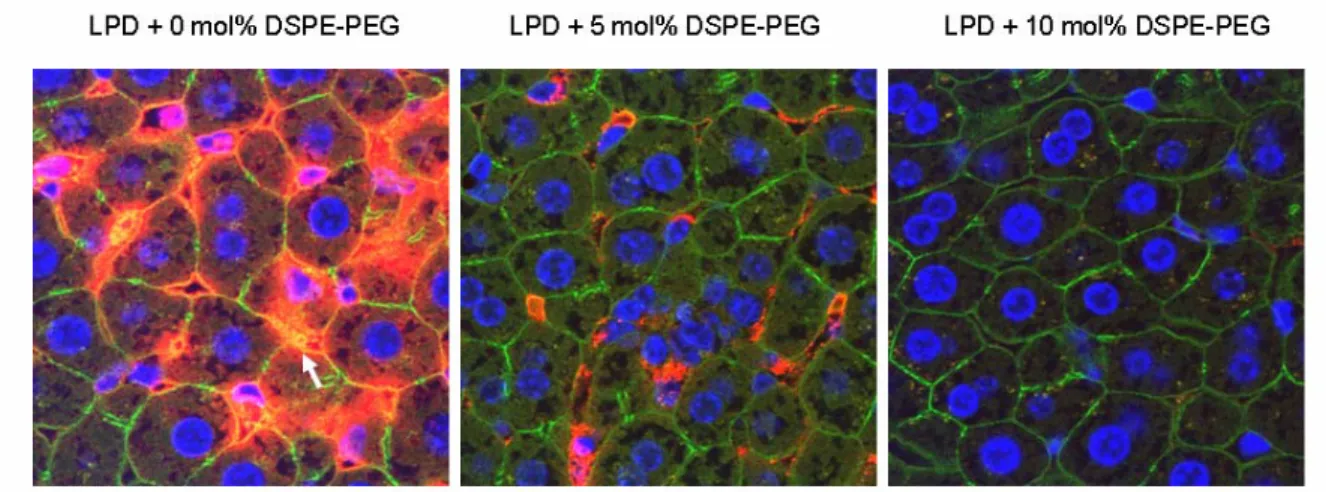
To further investigate if the PEGylated LPD showed reduced RES uptake in the liver, we performed a liver perfusion assay. As shown in figure 2.8, 10 mol% PEGylated LPD showed little sinusoidal uptake in the liver, while 0 or 5 mol% PEGylated LPD had significant RES uptake. The data suggest that sufficiently PEGylated LPD showing reduced RES uptake in the liver may exhibit improved pharmacokinetics for delivering siRNA when i.v. administered.
Figure 2.8 Liver sinusoidal uptake of cy3-siRNA (red) in different LPD formulations.
F-actin outlining the cellular morphology was stained with Alexa Fluor® 488 Phalloidin (green) and nuclei were stained with DAPI (blue). Magnification = 1,600 x. Data are representative pictures from 3 mice in each group.
3.0 TUMOR-TARGETED DELIVERY OF SIRNA BY SELF-ASSEMBLED NANOPARTICLES
3.1 INTRODUCTION
Selective oncogene silencing, mediated by small interfering RNA (siRNA), shows promise for cancer treatment. However, the obstacles in successfully delivering siRNA hinder the therapeutic viability of this treatment [1,4,42]. siRNA are susceptible to nuclease destruction and cannot penetrate the cell membrane when used in vivo due to the highly charged nucleic acid backbone. Although a variety of delivery systems have been developed for siRNA [2-4,12,19,24,43-51], the majority of the injected dose (ID) was taken up by the reticular endothelial system in the liver and spleen [52]. This typically left only 2-5% of the ID/g tissue for the tumor [49,52]; therefore, a more efficient delivery system still needs to be found.
accumulation. Additionally, anisamide ligand might further increase the cellular uptake and enhance the RNA interference effect.
The therapeutic target in this study was the epidermal growth factor receptor (EGFR). EGFR is over-expressed in a variety of tumors and has been shown to be associated with many adverse features of tumor, including increased proliferation, decreased apoptosis, enhanced metastasis, and resistance to chemo- and radiation therapy [54,55]. AntiEGFR therapy via tyrosine kinase inhibitors and monoclonal antibody has demonstrated great benefit for cancer patients [56-59]. Silencing EGFR by RNA interference is an alternative to antiEGFR therapy and has already shown some promising results [60-68]. EGFR silencing induces cell cycle arrest, apoptosis, tumor cell growth inhibition, and chemosensitization in vitro and in vivo [60-68].
3.2 MATERIALS AND METHODS
3.2.1 Materials
actin/β-actin (mouse monoclonal) were purchased from Santa Cruz Biotechnologies (Santa Cruz, CA).
3.2.2 Experimental animals
Female athymic nude mice of age 6-8 weeks and female C57BL/6 mice of age 6-7 weeks (16-18 g) were purchased from Charles River Laboratories (Wilmington, MA). All work performed on animals was in accordance with and permitted by the University of North Carolina Institutional Animal Care and Use committee.
3.2.3 NP preparations
NPs were prepared by the method described in Chapter 2. Control siRNA that targets the sequence 5′-AATTCTCCGAACGTGTCACGT-3′ and EGFR siRNA that targets the sequence 5′-AACACAGTGGAGCGAATTCCT-3′ as described previously [67] were synthesized in Dharmacon (Lafayette, CO). The control sequence does not match any human genome sequence. FAM (fluorescein)-siRNA was also obtained from Dharmacon (Lafayette, CO).
3.2.4 In vitro cellular uptake study
were washed twice with PBS, fixed with 1% paraformaldehyde in PBS at room temperature for 15 min, mounted onto a glass slide, and imaged with a Nikon fluorescence phase contrast optical microscope.
3.2.5 In vitro gene silencing study
NCI-H460 cells (1X10⁵ cells/well) were seeded in 12-well plates (Corning Inc., Corning, NY) 20 h before experiments. Cells were treated with different formulations at a concentration of 120 nM siRNA in serum containing medium at 37 oC for 48 h. Cells were washed, collected and analyzed for EGFR contents by Western Blotting. Western blot method is described in 3.2.10,
3.2.6 In vitro cytotoxicity study.
1X10⁵ NCI-H460 cells per well were seeded in 12-well plates (Corning Inc., Corning, NY) 20 h before experiments. Cells were treated with different formulations at a concentration of 320 nM siRNA in serum containing medium at 37 oC for 48 h. Cells were washed by PBS twice, trysinized, collected, incubated with propidium iodide (4 μl of 1 mg/ml stock for 1 ml sample), and analyzed by a BD FACScanto digital flow cytometer (San Diego, CA).
3.2.7 Immunocytochemistry
120 nM siRNA in serum containing medium at 37 oC for 48 h. Cells were washed twice with PBS and fixed with 1% paraformaldehyde in PBS at room temperature for 15 min. Immunostaining was then performed with rabbit anti-mouse AIF (apoptosis inducing factor) antibody (Santa Cruz Biotechnology, Santa Cruz, CA) and goat anti-rabbit IgG conjugated with FITC (Fluorescein isothiocyanate) (Santa Cruz Biotechnology, Santa Cruz, CA). Cells were mounted with DAPI (4',6-diamidino-2-phenylindole) containing medium (Vectorshield ®, Vector Lab, Inc. Burlingame, CA) and imaged by a Nikon fluorescence phase contrast optical microscope.
3.2.8 Pharmacokinetics (PK) study.
FAM-siRNA containing NP. The FAM-siRNA concentration was corrected for the degree of sample recovery.
3.2.9 Tissue distribution and tumor uptake study
Mice with tumor size of ~1 cm2 were i.v. injected with FAM-siRNA in different formulations (1.2 mg/kg). Four h later, mice were killed and tissues were collected and imaged by the IVIS Imaging System (Xenogen Imaging Technologies, Alameda, CA). To quantify the accumulated doses, the excised tissues were homogenized in 300 or 1,000 μl lysis buffer (1,000 μl for livers and 300 μl for others) and incubated at 65 °C for 10 min. One hundred microliter of supernatant was collected after centrifugation at 14,000 rpm for 10 min. FAM-siRNA in the supernatant was extracted and quantified by the method described in the PK study. The accumulated dose in each tissue was calculated from a standard curve obtained by spiking known amounts of FAM-siRNA or FAM-siRNA containing NP in tissues obtained from uninjected animals. Alternatively, tumors were sectioned (7 μm thick) by a cryostat (H/I Hacker Instruments & Industries, Winnsboro, SC). Sections were counterstained with DAPI and imaged using a Leica SP2 confocal microscope.
3.2.10 Immunohistochemistry and Western blot
visualized with kits from Dakocytomation [DakoCytomation Envision + Dual Link System-HRP (DAB+), DakoCytomation, Carpinteria, CA]. Samples were imaged by using a Nikon Microphot SA microscope. The percentage of AIF nuclear localization was calculated based on 30 random images obtained from three individual tumors. Total protein (40 μg) isolated from the tumors was loaded on a polyacrylamide gel and electrophoresed. Protein bands in the gel were then transferred to a polyvinylidene difluoride and the EGFR was probed by antibodies. The level of the target proteins in each lysate was detected by enhanced chemiluminescence using ChemiGlow (Alpha Innotech, San Leandro, CA) followed by detection by the AlphaImager (Alpha Innotech, San Leandro, CA).
3.2.11 Tumor growth inhibition study.
NCI-H460 xenograft tumor-bearing mice (size 25-40 mm2) were i.v. injected with siRNA containing formulations at the dose of 1.2 mg/kg (one injection per day for 3 days). For the chemocombination treatment, cisplatin (3 mg/kg) were intraperitoneally (i.p.) administered from the 3rd to 5th day after the first siRNA injection. Tumor growth in the treated mice was monitored thereafter. Mouse body weight was also monitored.
3.2.12 Cytokine induction studies.
Piscataway, NJ) were measured by enzyme-linked immunosorbent assay according to the manufacturer’s protocol. MDM2 (mouse double minute 2) siRNA (target sequence: 5′ -GCUUCGGAACAAGAGACUC-3′) without any known immunostimulatory sequences (5′ -GUCCUUCAA-3′ and 5′-UGUGU-3′) [20,69] was used as a negative control. Calf thymus DNA alone was formulated into targeted NPs and injected into the mice at the dose of 2.4 mg DNA/kg. This formulation is also regarded as the empty NP (without siRNA). Targeted NPs containing EGFR siRNA and luciferase plasmid DNA were also prepared and injected.
3.2.13 Liver enzyme assay
Female athymic nude mice of age 6-7 week (Charles River Laboratories) were injected with siRNA in different formulations at the dose of 1.2 mg/kg. Two h after injections, serum samples were obtained and the liver enzyme [aspartate aminotransferase (AST) and alanine aminotransferase (ALT)] levels were analyzed by Antech Diagnostics.
3.2.14 Statistical analysis
3.3 RESULTS
3.3.1 PK studies, tissue distribution, and intracellular uptake of siRNA
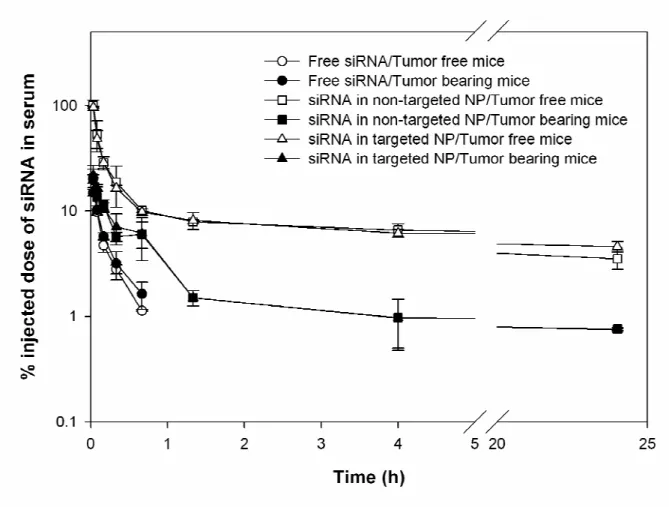
Figure 3.1 Serum concentration profiles of FAM-siRNA in different formulations. Data = mean ± SD, n = 4-8
increased fivefold to sixfold in the tumor-bearing mice compared to the tumor free mice. The t1/2 and mean residence time remained unchanged in the presence of tumor.
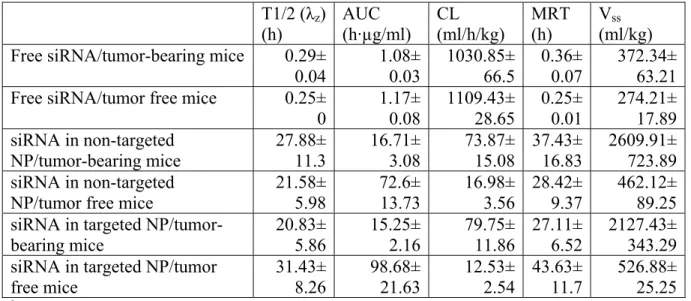
Table 3.1 Comparison of pharmacokinetic parameters of FAM-siRNA in different formulations in either NCI-H460 xenograft tumor-bearing mice or tumor free micea
T1/2 (λz)
(h) AUC (h·µg/ml) CL (ml/h/kg) MRT (h) Vss (ml/kg) Free siRNA/tumor-bearing mice 0.29±
0.04 1.08± 0.03 1030.85± 66.5 0.36± 0.07 372.34± 63.21 Free siRNA/tumor free mice 0.25±
0 1.17± 0.08 1109.43± 28.65 0.25± 0.01 274.21± 17.89 siRNA in non-targeted
NP/tumor-bearing mice 27.88± 11.3 16.71± 3.08 73.87± 15.08 37.43± 16.83 2609.91± 723.89 siRNA in non-targeted
NP/tumor free mice
21.58± 5.98 72.6± 13.73 16.98± 3.56 28.42± 9.37 462.12± 89.25 siRNA in targeted
NP/tumor-bearing mice 20.83±5.86 15.25±2.16 79.75±11.86 27.11± 6.52 2127.43±343.29 siRNA in targeted NP/tumor
free mice 31.43± 8.26 98.68± 21.63 12.53± 2.54 43.63± 11.7 526.88± 25.25
a The serum concentration profiles (figure 3.1) were analyzed with the WinNonlin program and the key
parameters were obtained.
Figure 3.2 Tissue distribution study.
(a) Fluorescence signal of FAM-siRNA in different tissues detected by the Xenogen IVISTM imaging system;
Figure 3.3 Tumoral uptake of FAM-siRNA in different formulations.
Blue arrows indicate the extracellular space and pink arrows indicate the intracellular uptake of FAM-siRNA. Magnification = 400X (xyz images), 630X (xzy images)
3.3.2 EGFR gene silencing, apoptosis induction, and tumor growth inhibition
non-targeted NPs, siRNA in targeted NPs, and control siRNA in targeted NPs were 2, 3, 7, 15, and 3%, respectively (figure 3.4b). Three injections of siRNA in targeted NPs showed a partial inhibition of tumor growth similar to that of i.p. cisplatin (figure 3.6). However, 2 weeks later, the tumor growth rate became comparable to the untreated control. Other control treatments had no effects. Combination of siRNA (formulated in targeted NP) and cisplatin completely inhibited tumor growth for an entire week. Tumor growth, however, resumed after 1 week.
Figure 3.4 Immunohistochemical analysis of the tumor samples.
Figure 3.5 Western blot analysis of EGFR in the NCI-H460 xenograft tumor after treatment with different formulations.
Figure 3.6 NCI-H460 xenograft tumor growth inhibition by siRNA in different formulations with or without the combination of cisplatin.
3.3.3 Toxicity and immune response studies in normal mice
Figure 3.7 Serum cytokine analysis.
Figure 3.8 Serum ALT and AST analysis.
Serum ALT and AST levels in the mice 2 h after the treatment of PBS or siRNA in different formulations at the dose of 1.2 mg/kg. Data = mean ± SD, n = 4.
3.4 DISCUSSION
In the in vitro preliminary studies, we showed that the targeted NP delivered a significantly higher amount of siRNA into NCI-H460 cells and showed a stronger gene silencing effect compared to non-targeted NP (figure 3.10). Targeted NP silenced the EGFR at the concentration of 120 nM (figure 3.10b). The cytotoxicity of the NP was siRNA sequence and formulation dependent (figure 3.11). The cell death mechanism was confirmed to be apoptosis by means of immunostaining of the apoptosis inducing factor (AIF) (figure 3.11b).
Figure 3.10 In vitro cellular uptake and gene silencing analysis
Figure 3.11 In vitro cytotoxicity assay
(a) Flow cytometry analysis of NCI-H460 cells after treatment with different formulations at the conc. of 320 nM siRNA for 48 h. Cells were stained with propidium iodide and analyzed for dead population. (b) Immunocytochemical analysis of AIF nuclear translocation of NCI-H460 cells after treatment with different formulations at the conc. of 120 nM siRNA for 48 h. Arrows indicate the nuclear translocation of AIF. Magnification = 200X.
Therefore, 5 mol% of PEGylation is a common formulation for liposomes containing a regular bilayer in the compromise of surface protection and low membrane permeability. In the case of our NP formulation, the siRNA was complexed with protamine, and was further coated with a supported bilayer stabilized by the charge-charge interaction. Therefore, the bilayer could tolerate a high degree of PEGylation (10.6 mol%) with a full protection of the particle surface, leading to the much improved EPR effect.
4.0 EFFICIENT GENE SILENCING IN METASTATIC TUMOR BY SIRNA FORMULATED IN SURFACE-MODIFIED NANOPARTICLES
4.1 INTRODUCTION
4.2 MATERIALS AND METHODS
4.2.1 Materials
DOTAP, cholesterol, and DSPE-PEG2000 were purchased from Avanti Polar Lipids, Inc. (Alabaster, AL). Protamine sulfate (fraction X from salmon) and calf thymus DNA (for hybridization, phenol-chloroform extracted and ethanol precipitated) were from Sigma-Aldrich (St. Louis, MO). DSPE-PEG2000-anisamide (DSPE-PEG-AA) was synthesized in our lab using the methods described previously [53].
Anti-luciferase siRNA (GL3) (target sequence 5'- CTT ACG CTG AGT ACT TCG A -3') was purchased from Dharmacon (Lafayette, CO) in deprotected, desalted, annealed form. For in vitro quantitative and tissue distribution studies, fluorescein (FAM) and cy3 labeled siRNA (3’ end of the sense strand) provided by Dharmacon were used.
4.2.2 Experimental animals
Female C57BL/6 mice of age 6-8 week (16-18 g) were purchased from Charles River Laboratories (Wilmington, MA). All work performed on animals was in accordance with and approved by the IACUC committee at UNC.
4.2.3 Preparation of siRNA containing nanoparticles
Nanoparticles (NP) were prepared as previously described in the Chapter 2. The formulations were used without further purification.
4.2.4 In vitro cellular uptake study
4.2.5 In vitro luciferase gene silencing study
B16F10 cells (5 x 10⁵ cells/5 ml/flask) were seeded in 25T culture flasks (Becton Dickinson Co., Franklin Lakes, NJ) 20 h before experiments. Cells were treated with different formulations at a concentration of 250 nM siRNA in DMEM containing 10% FBS at 37°C for 24 h. Cells were trypsinized and 2 x 10⁵ cells were collected for luciferase activity assay and the rest of cells were re-cultured in a 25T culture flask for the assay of the next time point. Collected cell pellets were incubated with 100 μl lysis buffer (0.05% Triton X-100 and 2 mM EDTA in 0.1 M Tris-HCl) at room temperature for 10 min. Ten microliter lysate was mixed with 100 μl substrate (Luciferase Assay System, Promega Co., Madison, WI) and the luminescence was measured by a plate reader. The protein concentrations of the samples were determined by using a protein assay kit (Micro BCATM protein assay kit, Pierce). Luciferase activity of a sample was normalized with the protein content and expressed as percent luminescence intensity compared to the untreated control. Percent luciferase activity of cells treated with different formulations was plotted against the time. The AAC (area above the curve) of different formulations was calculated and compared with each other. AAC = AUC (area under the curve)untreated – AUCtreated.
4.2.6 Tissue distribution study
were re-hydrated, mounted with the DAPI containing medium (Vectashield®, Vector Laboratories Inc., Burlingame, CA) and imaged using a Leica SP2 confocal microscopy.
4.2.7 Immunohistochemistry
B16F10 metastasis loaded lungs and normal lungs from C57BL/6 mice were collected for the preparation of paraffin embedded sections (5 μm thick). Sigma receptor expression in the sections was stained by using the rabbit anti-mouse sigma receptor antibody (Santa Cruz Biotechnologies) and a kit (mouse-to-mouse detection system, Chemicon International, Temecula, CA). Tissue sections were counter stained with hematoxylin for nuclei, mounted and imaged using a Nikon phase contrast light microscopy.
4.2.8 In vivo gene silencing study
min. Ten μl supernatant was mixed with 100 μl luciferase substrate and the luciferase activity was measured by a plate reader.
4.2.9 Cytokine induction assay
C57BL/6 mice were i.v. injected with anti-luciferase siRNA formulated in PBS, naked NP, non-targeted NP and targeted NP at the dose of 150 μg/kg. Targeted NP formulated with plasmid DNA (pNGVL-Luc prepared by Bayou Biolabs) [77] instead of calf thymus DNA was prepared and used as a positive control for the evaluation of immunotoxicity of calf thymus DNA. Two h after the injections, blood samples were collected from the tail artery and allowed to stand at room temperature for 0.5 h for coagulation. Serum was obtained by centrifuging the clotted blood at 16,000 rpm for 20-40 min. Cytokine levels were determined by using ELISA kits for TNF, IL6, IL12 (BD Biosciences, San Diego, CA) and IFN-α (PBL Biomedical Laboratories, Piscataway, NJ).
4.2.10 Statistical analysis
4.3 RESULTS
4.3.1 Characterization of NP
The characteristics of the NP are summarized in table 4.1. The particle sizes of the three NP formulations were similar to each other. DSPE-PEG modification significantly reduced the zeta potential of the NP. Targeted NP showed a slight increase in the zeta potential compared to the non-targeted NP. It is noted that the formulations were not further purified.
Table 4.1 Characterization of nanoparticle formulations
Naked NP Non-targeted NP Targeted NP
Particle size (nm) 117.6 ± 13.2 115.1 ± 14.8 110.6 ± 13.8
Zeta potential (mV) 43.2 ± 3.62 20.4 ± 2.08 25.51 ± 1.22
Data are representative data from repeated measures of 4-5 samples.
4.3.2 In vitro cellular uptake
significantly reduced to 1/10 compared to the naked NP. However, targeted NP showed 4-fold increased delivery efficiency compared to non-targeted NP. The addition of free haloperidol, a known agonist for sigma receptors, significantly reduced the delivery efficiency of targeted NP but not other formulations.
Figure 4.1 Fluorescence intensities of cell lysate from cells treated with FAM-siRNA containing formulations.
B16F10 cells were incubated with different formulations at 37°C for 4 h in the absence or presence of 50 μM haloperidol. Cells were washed and lysed. Cell lysate was analyzed for fluorescence intensity by a plate reader. Data = mean ± SD (n=3), * indicates p<0.05.
4.3.3 In vitro luciferase gene silencing
the naked NP (p<0.05). Control siRNA formulated in the targeted NP showed moderate but very transient effect and the overall effect (AAC) was not significantly higher than that of the free siRNA (p>0.05).
Figure 4.2 In vitro luciferase gene silencing effect of different siRNA formulations (A) and the AAC (area above the curve) of different formulations in figure 4.2A (B).
B16F10 cells were incubated with different siRNA formulations at 37°C for 24 h. At the end of incubation, formulations containing medium was removed and cells were washed. Luciferase activities of the cells (2 x 10⁵) were analyzed at different time points after the treatment. Data = mean ± SD (n=3), * indicates p<0.05
compared to the free siRNA.
4.3.4 Tissue distribution of cy3-siRNA
tumor loaded lungs, as very little cy3 signal was detected in the sections (figure 4.3A). Naked NP effectively delivered cy3-siRNA to the lung alveolar cells, but showed relatively poor penetration into the tumor nodules. Non-targeted NP showed poor tissue uptake in both tumor free and tumor loaded lungs. On the other hand, targeted NP provided the highest tumor penetration and uptake among the four formulations. Other normal organs (heart, spleen and kidney) only showed minimal fluorescence signal except liver. As shown in figure 4.3B, naked NP showed significant liver accumulation at 4 h in both tumor free and tumor bearing mice. However, PEGylated NP (with or without ligand) only accumulated in the liver of tumor free mice but not tumor bearing mice at 4 h. Liver uptake of free cy3-siRNA was very little in both tumor free and tumor bearing mice.
4.3.5 Immunohistochemistry of sigma receptor
Figure 4.3 Confocal microscopy photographs of the lungs (A) and livers (B) collected from the tumor free (a) and B16F10 tumor bearing mice (b).
4.3.6 In vivo luciferase gene silencing
The in vivo activity of the NP formulations was assessed by the luciferase gene silencing in the whole B16F10 tumor loaded lungs. Figure 4.4A shows the activity of siRNA in different formulations. The luciferase activity was compared with the untreated control. siRNA in PBS, naked NP, non-targeted NP and targeted NP silenced 0%, 50%, 10% and 75% luciferase activity, respectively (figure 4.4A). Only the naked NP and the targeted NP showed a significant effect (figure 4.4A, p<0.05). Control siRNA formulated in the targeted NP had no effect. Figure 4.4B indicates that ED50 of the targeted NP formulation was 75 μg/kg. The optimal dose for the maximum gene silencing effect (70-80%) was 150 μg/kg, and further increase of the dose did not result in a higher activity (figure 4.4B).
4.3.7 Cytokine induction study
Figure 4.4 In vivo luciferase gene silencing effect of different siRNA formulations at the dose of 150 μg/kg (A) and that of the targeted NP at various doses (B).
.
Figure 4.5 The serum cytokine concentrations of the mice 2 h after the i.v. injections of siRNA in different formulations.
C57BL/6 mice were i.v. injected with different siRNA formulations (A, untreated; B, siRNA in PBS; C, siRNA and calf thymus DNA in naked NP; D, siRNA and calf thymus DNA in non-targeted NP; E, siRNA and calf thymus DNA in targeted NP; F, siRNA and plasmid DNA in targeted NP. After 2 h, blood was collected from the tail artery and serum concentrations of the cytokines were analyzed by the ELISA method. Data = mean ± SD (n=4), * indicates p<0.05 compared to the untreated control.
4.4 DISCUSSION
Although the zeta potential of the targeted NP was slightly higher than that of the non-targeted NP due to the positively charged anisamide ligand, the non-targeted NP did not show increased delivery efficiency for sigma receptor negative cells (CHO and CT26 cells, data not shown). Additionally, neither the non-targeted nor the targeted NP formed aggregates with the FBS [33]. The data suggest that the PEGylated NPs (with or without ligand) were sterically stabilized by the PEG coating and the entry mechanism for the targeted NP was via a sigma receptor dependent pathway.
prolonged gene silencing effect. Although the control sequence showed only very transient activity, which was probably due to an off-target effect, the overall activity was not significantly higher than that of the free siRNA (figure 4.2B). The result indicated that the gene silencing activity was highly sequence dependent.
The in vivo activity results are consistent with the in vitro observation, in which the targeted NP showed significantly higher activity (70-80% gene silencing) than other formulations (figure 4.4A). The enhanced activity of the targeted NP was mainly due to the significantly improved tumor uptake as shown in figure 4.3A (panel b). Naked NP having poor tumor tissue penetration (panel b of figure 4.3A) provided only 50% gene silencing (figure 4.4A), which was probably resulted from the formation of large aggregate when i.v. injected. Other formulations, including free siRNA, non-targeted NP and control siRNA in targeted NP, had little effect (figure 4.4A, p>0.05). Again, the results suggested that significant gene silencing activity was highly dependent on the correct siRNA sequence and sufficient tumor delivery.