rspb.royalsocietypublishing.org
Research
Cite this article:
Hollowell AC, Regus JU,
Turissini D, Gano-Cohen KA, Bantay R,
Bernardo A, Moore D, Pham J, Sachs JL. 2016
Metapopulation dominance and
genomic-island acquisition of
Bradyrhizobium
with
superior catabolic capabilities.
Proc. R. Soc. B
283
: 20160496.
http://dx.doi.org/10.1098/rspb.2016.0496
Received: 4 March 2016
Accepted: 4 April 2016
Subject Areas:
evolution, genetics
Keywords:
epidemic, fitness, genomic island, rhizobia,
selective sweep, symbiont
Author for correspondence:
Joel L. Sachs
e-mail: [email protected]
Electronic supplementary material is available
at http://dx.doi.org/10.1098/rspb.2016.0496 or
via http://rspb.royalsocietypublishing.org.
Metapopulation dominance and
genomic-island acquisition of
Bradyrhizobium
with
superior catabolic capabilities
Amanda C. Hollowell
1, John U. Regus
1, David Turissini
3, Kelsey A.
Gano-Cohen
1, Roxanne Bantay
1, Andrew Bernardo
1, Devora Moore
1,
Jonathan Pham
1and Joel L. Sachs
1,21Department of Biology, and2Institute for Integrative Genome Biology, University of California, Riverside,
CA 92521, USA
3Department of Biology, University of North Carolina, Chapel Hill, NC 27599, USA
Root nodule-forming rhizobia exhibit a bipartite lifestyle, replicating in soil and also within plant cells where they fix nitrogen for legume hosts. Host control models posit that legume hosts act as a predominant selective force on rhizobia, but few studies have examined rhizobial fitness in natural populations. Here, we genotyped and phenotyped Bradyrhizobium isolates across more than 800 km of the native Acmispon strigosus host range. We sequenced chromosomal genes expressed under free-living conditions and accessory symbiosis loci expressed in plantaand encoded on an integrated ‘symbiosis island’ (SI). We uncovered a massive clonal expansion restricted to the Bradyrhizobiumchromosome, with a single chromosomal haplotype dominating populations, ranging more than 700 km, and acquiring 42 diver-gent SI haplotypes, none of which were spatially widespread. For focal genotypes, we quantified utilization of 190 sole-carbon sources relevant to soil fitness. Chromosomal haplotypes that were both widespread and domi-nant exhibited superior growth on diverse carbon sources, whereas these patterns were not mirrored among SI haplotypes. Abundance, spatial range and catabolic superiority of chromosomal, but not symbiosis geno-types suggests that fitness in the soil environment, rather than symbiosis with hosts, might be the key driver ofBradyrhizobiumdominance.
1. Introduction
Proteobacteria in the genus Bradyrhizobiumare among the most cosmopolitan bacteria, thriving in multifarious free-living habitats and associating with diverse hosts [1–3]. Like other rhizobia, Bradyrhizobium spp. often exhibit a bipartite life cycle, alternating between free-living replication in the soil and symbiotic differentiation and N2 fixation within the root nodules of legume
hosts [4]. Bradyrhizobium and other rhizobia also exhibit bipartite genomes, with chromosomal loci largely expressed under aerobic free-living conditions, and symbiosis loci mainly expressed in planta[5,6]. Rhizobial symbiosis loci are grouped on megaplasmids or genomic islands that are transmitted horizon-tally between chromosomal backgrounds [7–10]. A key characteristic of both agricultural and natural rhizobial populations is that they are often overrepre-sented by one or few rhizobial genotypes [4,11,12], in some cases with evidence that a subset of genotypes have rapidly increased in frequency (i.e. selective sweeps [13]). Yet, relatively little is known about what factors might drive such variation in rhizobial genotypic frequencies.
The longstanding ‘host control’ paradigm of symbiosis predicts that hosts are a dominant selective force shaping populations of associated symbionts. Host control models of symbiosis posit that hosts must exhibit mechanisms to constrain exploitation in their associated symbionts, for instance via discrimi-nation among symbionts during initial host colonization or via within host control over symbiont proliferation [14– 17]. Consistent with these models,
legume hosts have been shown to select certain rhizobial genotypes over others for nodulation [18,19] and favour ben-eficial rhizobia over less-effective strains in planta [20–23]. However, ex planta selection on rhizobia has remained poorly understood [4,24]. In particular, repeated attempts to leverage legume host control traits to use rhizobia as agricul-tural bioinoculants have revealed the so-called ‘rhizobial competition problem’, where highly beneficial introduced strains fail to compete against native strains and thus are unable to successfully invade populations [25 –27]. The common failure of crop legumes to enrich soil populations with beneficial inoculated strains suggest that variation in rhizobial fitness in the soil might be able to overwhelm the hosts’ ability to select beneficial strains [25,26,28].
Here, we investigated the population genetic structure of
Bradyrhizobiumisolated from a metapopulation of Acmispon strigosus (formerly Lotus strigosus), a common herb native to the southwestern USA.Bradyrhizobiumthrives in soil and aquatic environments and colonizes wild legumes and major staple crops [1,2,4,19,29–32]. We genotyped Bradyrhizobium
from more than 350 A. strigosus nodules from nine natural sites across California encompassing 72 plants collected over an 840 km range. Building on past studies focused on chromo-somal loci [4,12], we sequenced eight loci (approx. 5.5 kb) distributed across the approximately 9 Mbp Bradyrhizobium
genome including four loci on the chromosome (i.e. CHR) and four loci within the symbiosis island (i.e. SI), a large (approx. 680 kB) integrated genomic island that encodes nodu-lation and nitrogen fixation function [8,33]. To generate predictions about the relative importance of the soil versus the plant host in structuring rhizobial populations, we compared population genetic parameters of CHR and SI loci and examined rates of recombination across these two genomic regions. To analyse functional differences among
Bradyrhizobiumgenotypes that could drive patterns of geno-type frequency and spatial range, we chose 20 focal strains and used phenotypic microarrays to analyse utilization of 190 sole-carbon sources that are ecologically relevant to soil bacteria [34]. We investigated the fit of our dataset to four hypothetical scenarios of genome evolution, including: (i) selective sweeps restricted to the SI, predicted if host plants select for symbiosis loci that recombine among diverse CHR backgrounds [35]; (ii) selective sweeps restricted to the CHR, predicted if ex planta conditions select on CHR loci which acquire diverse SI genotypes; and (iii) whole-genome selective sweeps, predicted if selection affects both genome regions without recombination [36]. Finally, a scenario of stasis and whole-genome linkage is predicted in the absence of selective sweeps or recombination [37].
2. Material and methods
(a) Collection of nodule isolates
Root nodules were collected fromA. strigosushost plants at nine
field collection sites across California covering more than 800 km of the host’s range, and including collections from previous studies [4,12]. Previous work showed that these sites vary in key soil parameters such as total soil nitrogen and mineral nitro-gen content [21]. From each of the 72 plants collected, we sampled 1–26 nodules (mean approx. 5/plant). From each
sampled nodule, we isolated a single clone ofBradyrhizobium
following published protocols [4].
(b) DNA amplification and sequencing
Genomic DNA extracts were purified, PCR amplified and
sequenced at four loci located on the Bradyrhizobium
chromo-some (CHR), including dnaK, glnII, ITS andrecA, and four SI
loci, includingnifD, nodD-A, nodZandnolL. PCR amplification
followed previously published protocols [4,29,30,38–43].
(c) Phylogenetic analyses
Sequences for each gene were aligned and analysed separately or
were concatenated per genomic region with CLUSTALOMEGA[44]
including reference sequences from diverseBradyrhizobiumspp.
andMesorhizobium loti(which were used as outgroups; electronic supplementary material, S1). We used Akaike information
cri-terion results from JMODELTEST 2 [45,46] to select the GTR
model of nucleotide substitution all loci. Phylogenetic trees
were reconstructed in PHYML v. 3.0 [47] using BIONJ as the
start-ing tree with subtree prunstart-ing and regraftstart-ing. Branch support was estimated using the fast approximate likelihood ratio test (aLRT) with the Shimodaira–Hasegawa-like (SH-like) procedure [48].
Based on the CHR phylogeny, species-like clades of
Bradyrhizo-bium were defined as highly supported, non-nested,
monophyletic groups (SH support greater than or equal to 0.90) including no more than one reference species, attempting to follow past species demarcations that used some of the same loci [31,49]. A tanglegram associating phylogenetic trees of
each genomic region was reconstructed in TREEMAP v. 3.0 [50].
Statistical significance of congruence between CHR and SI
phylo-genies was tested using AXPARAFITand AXPCOORDS[51] within
COPYCAT[52] using default parameters.
(d) Statistical analyses
Loci were analysed separately or grouped into genomic regions, recognizing the potential for horizontal transfer of the SI
[35,39,53]. We estimatedp(nucleotide diversity; [54]),Hd
(haplo-type diversity; [54]),k(average number of nucleotide differences
per site; [55]),Ka/Ks(ratio of non-synonymous to synonymous
substitutions; [56]), average absoluteD’ (linkage disequilibrium)
[19,57],R(recombination) [58], minimum number of
recombina-tion events [59] and Tajima’sD[55]. Population differentiation
was calculated usingFSTconducted on a base-pair basis using
a Perl script and the Weir–Cockerham method [60]. AverageF
ST-values were calculated between all pairs of collection sites for each genomic region. Isolation by distance was tested with a
Mantel test [61] correlatingFSTand distance matrices between
collection sites in PASSaGE [62]. We analysed collection sites
and identifiedBradyrhizobiumclades separately when
appropri-ate. We analysed inter-clade variation using the ratio of fixed
to shared polymorphisms using DNASP [63].
We identified isolates with identical haplotypes within one or both genomic regions using the ‘find redundant’ command
in MACCLADE[64]. For each haplotype, we calculated raw
abun-dance (number of times a haplotype was isolated), and an adjusted abundance (only counting identical haplotypes from unique GPS locations), which discounts repeated isolation of the same haplotype from closely neighbouring plants. Distances within collection sites were small (less than 300 m), thus we used the geographical midpoint at each collection site to calculate dis-tance among collection sites. Measures of strain richness and dominance were estimated, which are akin to species richness and dominance [65,66]. Strain richness was calculated for each locus and genomic region by dividing the number of haplotypes by the number of isolates collected [11].
Within each genomic region, we analysed the number of times each haplotype was isolated (i.e. abundance; [11]) and the percentage of isolates each haplotype encompassed (i.e. strain dominance; [11]). Haplotypes were defined as ‘dominant’
rspb.r
oy
alsocietypublishing.org
Pr
oc.
R.
Soc.
B
283
:
20160496
at a field collection site if they constituted at least 10% of the iso-lates at that site (only including sites with greater than or equal to 50 isolates) and were defined as ‘epidemic’ if they were dominant in at least one site and were also found to have spread among multiple sites separated by at least 10 km. In population genetics, the term epidemic is used to describe microbial genotypes that reach extremely high frequency in populations composed mostly of rare genotypes [67,68].
(e) Carbon source utilization assays
We assayed growth upon 190 sole-carbon sources using phenoty-pic microarrays (PM1, PM2; Biolog Hayward, CA, USA). Carbon
sources were categorized into amines and amides (n¼11),
amino acids (n¼32), carbohydrates (n¼59), carboxylic acids
(n¼55), polymers (n¼13) and miscellaneous (n¼20, [69]). The
tested strains were incubated on modified arabinose gluconate
(MAG) agar plates (298C, approx. 96 h, approx. four plates per
stain), plates were scraped and cultures individually re-suspended in liquid MAG [4], cell density was measured optically, cells were washed twice in sterile phosphate buffered saline buffer, then re-suspended in Biolog Buffer IF-O (with tetrazolium dye) and
pipeted into phenotypic microarrays in duplicate (approx. 3.0
107cells well21; 100mm). Microarrays were incubated (298C,
120 h), absorbance was read at 570 nm using a Victor 2 plate reader, and readings were averaged among strain replicates. We employed a binary measure of carbon source utilization in which growth was considered positive with at least twofold absorbance relative to control wells (no carbon source). We first analysed these response variables using ANOVAs with strain and haplotype dominance as fixed effects, and treating strains as independent samples. We also analysed the response variables using haplotype (genotypic) means, which is more conservative and avoids phylogenetic non-independence among resampled haplotypes.
(f ) Testing evolutionary-genomic scenarios
We tested for population genetic data consistent with four evolutionary-genomic scenarios including selective sweeps restricted to the SI (SI sweep; e.g. [35]), selective sweeps restricted to the CHR (CHR sweep), whole-genome selective sweeps (CHR-SI sweep; e.g. [36]), and stasis and whole-genome linkage (Stasis; e.g. [37]). Selective sweeps are predicted to result in reduced genetic diversity in the genome region where they occur [70,71]. To discriminate among these models, we compared
GC%, p, haplotype number, Hd, strain richness, linkage and
Tajima’sDwithin and among genomic regions (see the electronic
supplementary material, S2 for detailed predictions).
3. Results
(a) Genomic region evolution
We examined similar numbers of nucleotides and variable sites in the CHR and SI loci, but nonetheless these genome regions were characterized by dissimilar population genetic parameters. The CHR exhibited many fewer haplotypes (CHR, 138; SI, 225), lower strain richness (CHR, 0.39; SI, 0.63) and haplotype diversity than the SI (CHR, 0.947; SI, 0.993). The CHR also had slightly greater nucleotide diversity (CHR, 0.03; SI, 0.02) and differed by greater numbers of nucleotides per site (CHR, 0.030; SI, 0.019; electronic supplementary material, S3).
We found relatively high linkage among all loci (average
jD’j.0.9), with the SI exhibiting greater linkage on average than the CHR (averagejD’j¼0.968 versus 0.925). High link-age values between the genomic regions (averlink-age jD’j¼
0.937), and low estimates of recombination (R¼0.001 per gene; [58]) suggest that horizontal gene transfer (HGT) of the SI occurs infrequently (electronic supplementary material, S3). Nonetheless, the SI loci had reduced GC content com-pared with the CHR loci (except for ITS which encodes rDNA), consistent with sequencedBradyrhizobium genomes USDA6 and USDA110 [8,33] and indicative of the SI’s history of horizontal transfer (CHR, approx. 59% GC; SI, 55% GC; electronic supplementary material, S3). The ratio of non-synonymous to non-synonymous substitutions was low and varied little among loci (approx. 0.1–0.3), hence that most differentiation occurred via synonymous changes in the sequenced loci (electronic supplementary material, S3).
(b) Phylogenetic reconstruction
The CHR and SI trees exhibited contradistinctive topologies. Reconstruction of the CHR tree recovered six species-like clades (i.e. monophyletic; SH-like branch support more than 0.9; less than or equal to one reference species; higher ratio of fixed differences to shared polymorphisms among species [12]) including four previously defined species,Bradyrhizobium japonicum, Bradyrhizobium canariense, Bradyrhizobium retamae
andBradyrhizobium yuanmingense, and two unnamed clades,
Bradyrhizobium sp. nov. I and Bradyrhizobium sp. nov. II (figure 1; electronic supplementary material, S4; [12]). Two iso-lates, 12LoS3_5 and 12LoS6_1 did not fit in any of the recovered clades. Collection sites varied substantially in relative frequen-cies of CHR clades (electronic supplementary material, S1). Most population genetic parameters were similar among the different CHR clades (electronic supplementary material, S5).
Reconstruction of the SI tree recovered a single deep clade that encompassed all sequenced isolates as well as the reference strains Bradyrhizobium sp. WM9, B. canariense
SEMIA928 and Bradyrhizobium cytisi LMG25866 (electronic supplementary material, S6). We compared topologies of the CHR and SI trees. A tanglegram analysis suggested a broad pattern of shared evolutionary history among the major CHR clades and four paraphyletic SI lineages (denoted SI lineages numbers 1–4; electronic supplementary material, S7). The CHR cladesB. canariense, B.sp. nov. I andB. retamae
were associated with SI lineages no. 4, no. 3, no. 1, respect-ively, and the paraphyletic CHR taxa B. japonicum and B.
sp. nov. II was associated with SI lineage no. 2. At least seven independent HGT events are also evident among these defined lineages. We did not find significant support for congruence of the CHR and SI trees when we used the programs AXPARAFIT and AXPCOORDS within COPYCAT
(PARAFITGLOBAL¼0.11097;p¼0.53), but this test is sensitive
to poor phylogenetic resolution near branch tips [51,52].
(c) Spatial analysis of haplotypes
Most whole-genome haplotypes (i.e. all eight loci) were unique (86%), and only five were dominant at any single field site, comprising up to 14% of local isolates. No whole-genome haplotypes were found at multiple sites.
Ten of the 138 CHR haplotypes were categorized as domi-nant. Two CHR haplotypes were found at multiple sites greater than or equal to 10 km distant, and thus categorized as epidemic (figure 2; electronic supplementary material, S8). Among the 225 SI haplotypes, seven were categorized as dominant within a site, and none were found at multiple sites (electronic supplementary material, S8). The dominant
rspb.r
oy
alsocietypublishing.org
Pr
oc.
R.
Soc.
B
283
:
20160496
SI haplotypes were always found to be paired with dominant CHR haplotypes.
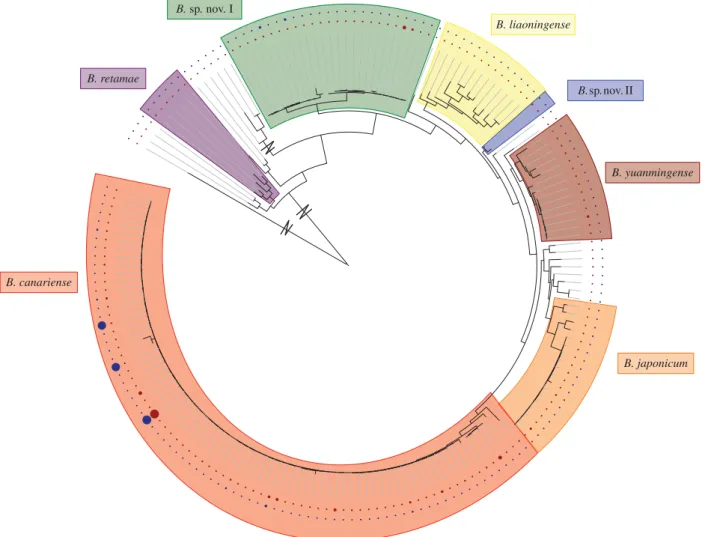
The CHR haplotype K01_G03_I01_R01 was found at all six collection sites that are not in desert habitat (a spatial range of 728.3 km) and was dominant at five of them. This haplotype encompassed greater than 17% of all isolates assayed, consistent with a massive clonal expansion of the CHR [11,40,68] (figure 1; electronic supplementary material, S2). A broad diversity of SI haplotypes were associated with K01_G03_I01_R01 (42 SI haplotypes, encompassing 61 nucleotide changes), revealing that the epidemic CHR haplo-type acquired divergent SI haplohaplo-types as it spread (figure 3).
(d) Genetic differentiation among sites
The major CHR clades varied widely in geographical range.
Bradyrhizobium canariense,which encompassed both epidemic haplotypes, had the largest range and was the only clade to be found in northern California (B. canarienserange approx. 700 km;B. retamae,B.sp. nov. I approx. 150 km;B.sp. nov. II, B. japonicum less than 10 km; electronic supplementary material, S4). Clade diversity varied among sites and was greatest at San Dimas Canyon, which contained all sampled
Bradyrhizobiumclades and was the only site withB. yuanmin-gense. Three sites each only contained a single clade (Bodega Marine Reserve, Motte Rimrock Reserve, Anza Borrego
Desert State Park—Roadside). Nucleotide and haplotype diversity roughly paralleled clade diversity among sampling sites in both the CHR and SI datasets (electronic supplemen-tary material, S9). Differentiation among populations was lower for the SI than the CHR (mean FST¼0.08 and 0.20,
respectively; electronic supplementary material, S9). Mean
FST values for the SI varied little among populations (0.06 –
0.13). By contrast, two populations exhibited FST for the
CHR loci that were well beyond this range (Anza Borrego Palm Canyon, mean FST¼0.25; Burns Pin˜ on Ridge, FST¼
0.83). We did not find support for isolation by distance within the CHR or SI datasets (CHR; Mantel test
R¼20.00145;p¼0.99; SI,R¼0.09132;p¼0.72).
(e) Carbon source utilization
Twenty genetically diverse isolates were analysed for carbon utilization. Isolates were initially treated as independent data and binned based on haplotype abundance for each genome region. CHR haplotypes were classified as epidemic (n¼5) or not (n¼15) and SI haplotypes (none of which are
epi-demic) were classified as ‘frequent’ (sampled greater than or equal to 2x; n¼5) or unique (n¼15; electronic sup-plementary material, S10). Binary utilization scores were significantly higher for strains with epidemic CHR haplo-types (48.6+8.8) than rare CHR haplotypes (26.1+5.1;
B. retamae
B. sp. nov. I
B. liaoningense
B. yuanmingense
B. japonicum B. canariense
B. sp. nov. II
Figure 1.
Reconstructed phylogram of CHR haplotypes. Tree reconstructed in P
HYML using concatenated
dnak
,
glnII
, ITS and
recA
loci. Zigzags indicate long branches
shortened for visibility. Species-like clades are indicated in shaded portions. The size of the circles on the inner and our perimeter indicate the relative abundance
and spatial range, respectively, of each CHR haplotype. (Online version in colour.)
rspb.r
oy
alsocietypublishing.org
Pr
oc.
R.
Soc.
B
283
:
20160496
ANOVA;F1,19¼4.87,p¼0.04), and these higher utilization
scores were most pronounced on carbohydrates (F1,19¼
7.50, p¼0.013) and carboxylic acids (F1,19¼5.16, p¼
0.036). Strains with frequent and rare SI haplotypes did not differ in binary utilization (frequent: 30.8+9.3; rare: 32.1+
5.7; ANOVA;F1,19¼0.01,p¼0.91).
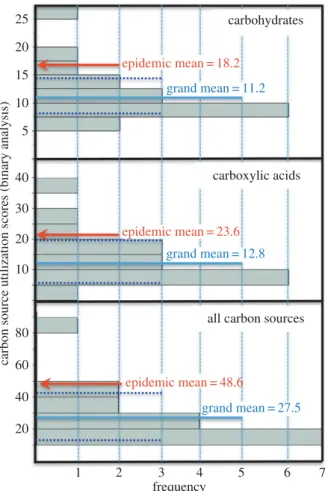
We analysed genotypic means for carbon utilization scores to take phylogenetic non-independence into account. These analyses generated similar results as in the categorical tests. The epidemic CHR haplotypes exhibited binary carbon utilization scores that were well above 99% confidence limits for the mean of the population distribution (a¼0.01;
figure 4). The superiority of the epidemic CHR haplotype was most pronounced on carbohydrates and carboxylic acids (figure 4; electronic supplementary material, S10).
(f ) Hypothesis testing of evolutionary-genomic
scenarios
We examined the fit of our data to four potential evolutionary-genomic scenarios and tested models separately for each well-sampledBradyrhizobium clade (i.e. minimum of 20 iso-lates; electronic supplementary material, S4). We had the best
sampling for theB. canarienseclade (n¼244), for which the
data support the CHR sweep model (electronic supplementary material, S2). For theB.nov. I clade, n¼54, the next largest
dataset, the data also support the CHR sweep model, except Tajima’sDis not negative as would be expected following a selective sweep. The data forB. japonicumandB. yuanmingense
do not strongly support any of the models, but both have relatively small sample sizes.
4. Discussion
Rhizobia are often studied in agricultural and pastoral set-tings where local populations are genetically diverse but often dominated by few chromosomally encoded genotypes [11]. A handful of studies in natural populations have mirrored these results, with chromosomal genotypes domi-nating local populations [4] or spreading among multiple locales [2,12,31,32]. However, there has been little under-standing of what drives these patterns or whether they reflect whole-genome evolution. Studies of agricultural iso-lates can be confounded by tilling, flood irrigation, introduced or genetically altered plants, and biological soil
K01_G01_I01_R01 K01_G03_I01_R01 K01_G03_I05_R01 K01_G03_I20_R01 K02_G03_I01_R01 K04_G05_I07_R02 K08_G36_I27_R35 K11_G71_I21_R39 K14_G58_X_R27 K14_G58_X_R34 all other haplotypes
potential distribution of epidemic K01_G03_I01_R01 potential distribution of epidemic K01_G03_I20_R01
Figure 2.
Map of dominant CHR haplotypes. Location of nine collection sites indicated by black dots. Proportional breakdown of dominant CHR haplotypes at each
location indicated by piecharts. Potential distribution of epidemic haplotypes indicated by coloured dotted outlines. Beginning in the upper left corner and
proceed-ing clockwise, the collection sites are Bodega Marine reserve, UC Riverside, Motte Rimrock Reserve, Burns Pinon Ridge Reserve, Anza Borrego Palm Canyon, Anza
Borrego Roadside, Bernard Field Station, San Dimas Canyon and San Dimas Reservoir.
rspb.r
oy
alsocietypublishing.org
Pr
oc.
R.
Soc.
B
283
:
20160496
amendments, any of which can transport rhizobia within and among sites. Moreover, rhizobial datasets often sample multiple legume host species and differences in host special-ization can also confound patterns of rhizobial strain diversity and dominance [72]. We have focused on native host populations of a single legume species in natural soils to avoid these confounding effects [4,12].
The Bradyrhizobium populations we examined exhibited strikingly different population genetic parameters between the CHR and SI genomic regions. While we sampled similar numbers of nucleotide sites and variable sites in these two genome regions (electronic supplementary material, S3), we found fewer haplotypes, lower haplotype diversity and lower strain richness within the CHR loci. One hypothesis to explain these differences is additional pressure of natural selection on the CHR relative to the SI, which is also supported by the negative Tajima’s D (found for the
B. canariense clade; electronic supplementary material, S5). An alternative explanation would be that haplotype diversity and strain richness are elevated in the SI driven by local adaptation to host populations; for instance, if the host popu-lations are genetic structured [19]. The genetics ofA. strigosus
are currently unknown, but given that we found similar levels of population subdivision across both CHR and SI loci, there is not much support for this latter hypothesis.
Focusing on the CHR dataset, we found that most field sites had one or a handful of dominant strains that were unique to that site. Among the two CHR haplotypes that were categorized as epidemic, one was dominant at the majority of sampled sites and ranged over a 700 km span to represent more than 17% of all isolates sampled (CHR haplo-type, K01_G03_I01_R01; figure 2; electronic supplementary
material, S4 and S8). This striking evidence of CHR clonal expansion was not mirrored in the SI dataset. Although we uncovered locally dominant SI haplotypes within 5 out of 9 collection sites, none had spread more than 10 km (not epi-demic; electronic supplementary material, S8). The fact that the dominant SI haplotypes were always paired with domi-nant CHR haplotypes (but not vice versa) suggests that SI haplotypes only achieved local dominance via hitchhiking with the CHR.
We considered four potential models of Bradyrhizobium
genome evolution and found the best support for a CHR sweep within theB. canarienselineage (other lineages were not as well sampled; electronic supplementary material, S2). Low nucleotide diversity in the chromosome, indicative of extensive hitchhiking following a selective sweep, was also found inSinorhizobium melliloti[13]. In the case of our dataset, however, the presence of highly abundant and spatially widespread haplotypes was strictly limited to the CHR. Among the 42 SI haplotypes associated with the epidemic CHR haplotype in our dataset, only one is dominant (figure 3; electronic supplementary material, S8). Thus, the most likely explanation is that the epidemic CHR haplotype increased its spatial range and in the process acquired diver-gent SI haplotypes. Our data are inconsistent with the hypothesis of a genome-wide sweep followed by the SI accumulating variation because we found evidence of faster molecular evolution in the CHR versus the SI (0.149 versus 0.088 mutations per site, respectively, within the best sampledB. canariense/SI lineage 4; electronic supplementary material, S7).
The clonal expansion and geographical dissemination of a small subset of bacterial genotypes in a population suggests 1
1
2 2
3
3
4
chromosome
symbiosis island 4
Figure 3.
Tanglegram of CHR and SI phylogenies highlighting epidemic CHR haplotype. T
REEM
APcophylogeny tanglegram of CHR and SI haplotypes. The left
cladogram is reconstructed with CHR loci (
dnak
,
glnII
, ITS and
recA
) and the right cladogram is reconstructed with SI loci (
nifD
,
nodD-A
,
nodZ
and
nolL
). Overall
patterns in associations between CHR and SI haplotypes indicated by grey bars (Individual associations, see the electronic supplementary material, S1). Lineages of
associated CHR and SI haplotypes bracketed and numbered. Lines connect the 42 SI haplotypes acquired by the epidemic CHR haplotype K01_G03_I01_R01. (Online
version in colour.)
rspb.r
oy
alsocietypublishing.org
Pr
oc.
R.
Soc.
B
283
:
20160496
that these strains exhibit traits that engender superior fitness in their population [73–75]. Such clonal expansion events in bac-terial pathogens are often associated with horizontal transfer of accessory DNA, for instance where acquisition of antibiotic resistance traits or vaccine-escape loci can result in epidemic spread of pathogenic strains [73,74]. Parallel processes are also possible in bacterial symbionts, with the host possibly pro-moting rather than countering bacterial spread. In rhizobial populations, host plants can favour beneficial over ineffective rhizobial genotypes [20,22,23] and thus select certain symbiosis alleles over others [18,19,32]. However, only under very specific conditions has there been evidence of plant selection promoting selective sweeps of symbiosis genotypes. One strik-ing example comes from an agricultural site in which the legume hosts were planted, but were not being nodulated (e.g. no rhizobia were present with the capacity to form nodules). A single Mesorhizobium loti strain was inoculated and its SI genotype spread through a diverse population of non-symbioticMesorhizobium spp [53]. The recurrent acqui-sition of the SI in diverse non-nodulating Mesorhizobium
strains is consistent with a fitness advantage of symbiotic versus a non-symbiotic lifestyle. By contrast, we found evi-dence of a CHR sweep. Our previous data showed that epidemic status ofBradyrhizobiumgenotypes occurs both in the presence and absence of the SI, suggesting that the fitness advantage encoded by these genotypes is unlinked to the symbiosis [12].
The rhizobial lineages bothBradyrhizobiumand Mesorhizo-biumexhibit genomes with ‘expression islands’, wherein SI loci are primarily expressed in nodules and CHR loci are pri-marily expressed ex planta [5,6]. Our evidence of selective sweeps restricted to the CHR suggests that selection among CHR variants in the soil (i.e. outside the context ofin planta
symbiosis) might be the driving force structuring these popu-lations. In further support of this hypothesis, we found that dominant CHR haplotypes had significantly enriched capacity to use sole-carbon sources, which can be important to bacterial fitness in the soil and soil–root interface [76]. However, more research is needed to uncover the portions of the rhizobial life cycle where selection of catabolism traits might be occurring. Superior capability to catabolize carbohydrates and carboxylic acids that we uncovered here could be favoured as a trait for persistence in the soil, compe-tition on carbon-rich root surfaces, or even during growth within nodules that can be rich in these carbon compounds [24]. Moreover, the role of other hosts remains unknown in these populations, and the diversity of SI loci of the epidemic CHR haplotype suggests the possibility that other host legumes might be contributing to the fitness of these strains. Harnessing natural rhizobial epidemics, such as we uncovered here, could represent a solution to the failed attempts to establish rhizobial inoculants as efficient sym-bionts of legume crops, known as the rhizobial competition problem [25,26,28]. The key challenge for inoculant strain establishment is that even when inoculum strains have superior nitrogen fixation traits, they often are inferior in competition with indigenous rhizobia for nodulation of the host root. The epidemic CHR genotypes could be particularly useful because they appear to express superior ex planta
fitness in diverse soils over a large spatial range.
Data accessibility.All data used in this paper are publicly available in electronic supplementary material and in Dryad http://dx.doi.org/ 10.5061/dryad.nf981.
Authors’ contributions. A.C.H. and J.L.S. designed the study. A.C.H., J.U.R., D.T., K.A.G.-C., R.B., A.B., D.M., J.P. and J.L.S. collected and analysed the data. A.C.H. and J.L.S. participated in drafting and cri-tically revising the manuscript. All authors approved the final version of the manuscript.
Competing interests.Authors do not have competing interests. Funding. The following grants supported this study: to A.C.H. a Herbert Kraft Scholarship and a UC Riverside Graduate Research Mentorship Fellowship, and to J.L.S. NSF DEB 0816663 and NSF DEB 1150278.
Acknowledgements.We thank Jeff Chang, Quinn McFrederick, Stephanie Porter, Camille Wendlandt and two anonymous reviewers for constructive comments on the manuscript.
References
1. Parker MA. 2015 The spread ofBradyrhizobium lineages across host legume clades: from Abarema
to Zygia.Microb. Ecol.69, 630 – 640. (doi:10.1007/ s00248-014-0503-5)
2. VanInsberghe D, Maas KR, Cardenas E, Strachan CR, Hallam SJ, Mohn WW. 2015 Non-symbiotic
25
40
30
20
10
80
60
40
20 20
15
10
5
carbon source utilization scores (binary analysis)
all carbon sources carboxylic acids
carbohydrates
epidemic mean = 48.6 epidemic mean = 23.6 epidemic mean = 18.2
grand mean = 27.5 grand mean = 12.8 grand mean = 11.2
frequency
1 2 3 4 5 6 7
Figure 4.
Carbon utilization of epidemic CHR haplotype relative to population
mean. Frequency distribution of binary carbon utilization scores for 20 strains
tested. The population mean and 99% confidence intervals (CI) are indicated
with solid and dashed lines, respectively. In each case, the genotypic mean
of the five tested epidemic CHR haplotypes is above the upper 99% CI
(1 – 0.99
¼
a
). (Online version in colour.)
rspb.r
oy
alsocietypublishing.org
Pr
oc.
R.
Soc.
B
283
:
20160496
Bradyrhizobiumecotypes dominate North American forest soils.ISME J.9, 2435 – 2441. (doi:10.1038/ ismej.2015.54)
3. Hollowell ACet al.2015 Native California soils are selective reservoirs for multidrug-resistant bacteria. Environ. Microbiol. Rep.7, 442 – 449. (doi:10.1111/ 1758-2229.12269)
4. Sachs JL, Kembel SW, Lau AH, Simms EL. 2009In situphylogenetic structure and diversity of wild Bradyrhizobiumcommunities.Appl. Environ. Microbiol.75, 4727 – 4735. (doi:10.1128/AEM. 00667-09)
5. Pessi G, Ahrens CH, Rehrauer H, Lindemann A, Hauser F, Fischer H-M, Hennecke H. 2007 Genome-wide transcript analysis ofBradyrhizobium japonicumbacteroids in soybean root nodules.Mol. Plant-Microb. Interact.20, 1353 – 1363. (doi:10. 1094/MPMI-20-11-1353)
6. Uchiumi Tet al.2004 Expression islands clustered on the symbiosis island of theMesorhizobium loti genome.J. Bacteriol.186, 2439 – 2448. (doi:10. 1128/JB.186.8.2439-2448.2004)
7. Kaneko Tet al.2000 Complete genome structure of the nitrogen-fixing symbiotic bacterium Mesorhizobium loti.DNA Res.7, 331 – 338. (doi:10. 1093/dnares/7.6.331)
8. Kaneko Tet al.2002 Complete genomic sequence of nitrogen-fixing symbiotic bacteriumBradyrhizobium japonicumUSDA110.DNA Res.9, 189 – 197. (doi:10. 1093/dnares/9.6.189)
9. Martinez-Abarca F, Martinez-Rodriguez L, Lopez-Contreras JA, Jimenez-Zurdo JI, Toro N. 2013 Complete genome sequence of the alfalfa symbiont Sinorhizobium/Ensifer melilotistrain GR4.Genome Announcements1, e00174-12. (doi:10.1128/ genomeA.00174-12)
10. Young JPWet al.2006 The genome ofRhizobium leguminosarumhas recognizable core and accessory components.Genome Biol.7, R34. (doi:10.1186/gb-2006-7-4-r34)
11. McInnes A, Thies JE, Abbott LK, Howieson JG. 2004 Structure and diversity among rhizobial strains, populations and communities: a review.Soil Biol. Biochem.36, 1295 – 1308. (doi:10.1016/j.soilbio. 2004.04.011)
12. Hollowell ACet al.2016 Epidemic spread of symbiotic and non-symbioticBradyrhizobium genotypes across California.Microb. Ecol.71, 700 – 710. (doi:10.1007/s00248-015-0685-5) 13. Epstein Bet al.2012 Population genomics of the
facultatively mutualistic bacteriaSinorhizobium melilotiandS. medicae.PLoS Genet.8, e1002868. (doi:10.1371/journal.pgen.1002868)
14. Denison RF. 2000 Legume sanctions and the evolution of symbiotic cooperation by rhizobia.Am. Nat.156, 567 – 576. (doi:10.1086/316994) 15. Douglas AE. 2010The symbiotic habit. Princeton, NJ:
Princeton University Press.
16. Mueller UG, Sachs JL. 2015 Engineering microbiomes to improve plant and animal health.Trends Microbiol. 23, 606 – 617. (doi:10.1016/j.tim.2015.07.009) 17. Sachs JL, Skophammer RG, Regus JU. 2011
Evolutionary transitions in bacterial symbiosis.Proc.
Natl Acad. Sci. USA108, 10 800 – 10 807. (doi:10. 1073/pnas.1100304108)
18. Koppell JH, Parker MA. 2012 Phylogenetic clustering ofBradyrhizobiumsymbionts on legumes indigenous to North America.Microbiology158, 2050 – 2059. (doi:10.1099/mic.0.059238-0) 19. Parker MA. 2012 Legumes select symbiosis island
sequence variants inBradyrhizobium.Mol. Ecol.21, 1769 – 1778. (doi:10.1111/j.1365-294X.2012.05497.x) 20. Kiers ET, Rousseau RA, West SA, Denison RF. 2003 Host
sanctions and the legume-rhizobium mutualism. Nature425, 78–81. (doi:10.1038/nature01931) 21. Regus JU, Gano KA, Hollowell AC, Sachs JL. 2014
Efficiency of partner choice and sanctions in lotus is not altered by nitrogen fertilization.Proc. R. Soc. B 281, 20132587. (doi:10.1098/rspb.2013.2587) 22. Sachs JL, Russell JE, Lii YE, Black KC, Lopez G, Patil AS.
2010 Host control over infection and proliferation of a cheater symbiont.J. Evol. Biol.23, 1919–1927. (doi:10.1111/j.1420-9101.2010.02056.x)
23. Simms EL, Taylor DL, Povich J, Shefferson RP, Sachs JL, Urbina M, Tausczik Y. 2006 An empirical test of partner choice mechanisms in a wild legume-rhizobium interaction.Proc. R. Soc. B273, 77 – 81. (doi:10.1098/rspb.2005.3292)
24. Denison RF, Kiers ET. 2004 Lifestyle alternatives for rhizobia: mutualism, parasitism, and forgoing symbiosis.FEMS Microbiol. Lett.237, 187 – 193. (doi:10.1111/j.1574-6968.2004.tb09695.x) 25. Perrineau MM, Le Roux C, de Faria SM, de Carvalho
Balieiro F, Galiana A, Prin Y, Be´na G. 2011 Genetic diversity of symbioticBradyrhizobium elkanii populations recovered from inoculated and non-inoculatedAcacia mangiumfield trials in Brazil.Syst. Appl. Microbiol.34, 376 – 384. (doi:10.1016/j. syapm.2011.03.003)
26. Tang J, Bromfield ESP, Rodrigue N, Cloutier S, Tambong JT. 2012 Microevolution of symbiotic Bradyrhizobiumpopulations associated with soybeans in east North America.Ecol. Evol.2, 2943 – 2961. (doi:10.1002/ece3.404) 27. Triplett EW, Sadowsky MJ. 1992 Genetics of
competition for nodulation of legumes.Annu. Rev. Microbiol.46, 399 – 428. (doi:10.1146/annurev.mi. 46.100192.002151)
28. Vlassak K, Vanderleyden J, Franco A. 1996 Competition and persistence ofRhizobium tropici andRhizobium etliin tropical soil during successive bean (Phaseolus vulgarisL.) cultures.Biol. Fertil. Soils21, 61 – 68. (doi:10.1007/BF00335994) 29. Parker MA. 2000 DivergentBradyrhizobium
symbionts onTachigali versicolorfrom Barro Colorado Island, Panama.Syst. Appl. Microbiol.23, 585 – 590. (doi:10.1016/S0723-2020(00)80034-X) 30. Vinuesa P, Rademaker JLW, de Bruijn FJ, Werner D.
1998 Genotypic characterization ofBradyrhizobium strains nodulating endemic woody legumes of the Canary Islands by PCR-restriction fragment length polymorphism analysis of genes encoding 16S rRNA (16S rDNA) and 16S-23S rDNA intergenic spacers, repetitive extragenic palindromic PCR genomic fingerprinting, and partial 16S rDNA sequencing. Appl. Environ. Microbiol.64, 2096 – 2104.
31. Vinuesa P, Rojas-Jimenez K, Contreras-Moreira B, Mahna SK, Prasad BN, Moe H, Selvaraju SB, Thierfelder H, Werner D. 2008 Multilocus sequence analysis for assessment of the biogeography and evolutionary genetics of fourBradyrhizobiumspecies that nodulate soybeans on the Asiatic Continent. Appl. Environ. Microbiol.74, 6987 – 6996. (doi:10. 1128/AEM.00875-08)
32. Vinuesa P, Silva C, Werner D, Martinez-Romero E. 2005 Population genetics and phylogenetic inference in bacterial molecular systematics: the roles of migration and recombination inBradyrhizobiumspecies cohesion and delineation.Mol. Phylogenet. Evol.34, 29–54. (doi:10.1016/j.ympev.2004.08.020)
33. Kaneko T, Maita H, Hirakawa H, Uchiike N, Minamisawa K, Watanabe A, Sato S. 2011 Complete genome sequence of the soybean symbiont Bradyrhizobium japonicumStrain USDA6(T).Genes 2, 763 – 787. (doi:10.3390/genes2040763) 34. Weber KP, Legge RL. 2009 One-dimensional metric
for tracking bacterial community divergence using sole carbon source utilization patterns.J. Microbiol. Methods79, 55 – 61. (doi:10.1016/j.mimet.2009.07. 020)
35. Sullivan JT, Patrick HN, Lowther WL, Scott DB, Ronson CW. 1995 Nodulating strains of rhizobium-loti arise through chromosomal symbiotic gene-transfer in the environment.Proc. Natl Acad. Sci. USA92, 8985– 8989. (doi:10.1073/pnas.92.19.8985)
36. Diep BAet al.2006 Complete genome sequence of USA300, an epidemic clone of community-acquired meticillin-resistantStaphylococcus aureus.Lancet 367, 731 – 739. (doi:10.1016/S0140-6736(06)68231-7)
37. Juhas Met al.2007 Sequence and functional analyses ofHaemophilusspp. genomic islands. Genome Biol.8, R237. (doi:10.1186/gb-2007-8-11-r237)
38. Moulin L, Bena G, Boivin-Masson C, Stepkowski T. 2004 Phylogenetic analyses of symbiotic nodulation genes support vertical and lateral gene co-transfer within theBradyrhizobiumgenus.Mol. Phylogenet. Evol.30, 720 – 732. (doi:10.1016/S1055-7903(03)00255-0)
39. Sachs JL, Ehinger MO, Simms EL. 2010 Origins of cheating and loss of symbiosis in wild Bradyrhizobium.J. Evol. Biol.23, 1075 – 1089. (doi:10.1111/j.1420-9101.2010.01980.x)
40. Silva C, Vinuesa P, Eguiarte LE, Souza V, Martinez-Romero E. 2005 Evolutionary genetics and biogeographic structure ofRhizobium gallicum sensu lato, a widely distributed bacterial symbiont of diverse legumes.Mol. Ecol.14, 4033 – 4050. (doi:10.1111/j.1365-294X.2005.02721.x)
41. Stepkowski T, Czaplinska M, Miedzinska K, Moulin L. 2003 The variable part of the dnaK gene as an alternative marker for phylogenetic studies of rhizobia and related alpha Proteobacteria.Syst. Appl. Microbiol.26, 483 – 494. (doi:10.1078/ 072320203770865765)
42. Stepkowski T, Moulin L, Krzyzanska A, McInnes A, Law IJ, Howieson J. 2005 European origin of Bradyrhizobiumpopulations infecting lupins and
serradella in soils of Western Australia and South Africa.Appl. Environ. Microbiol.71, 7041 – 7052. (doi:10.1128/AEM.71.11.7041-7052.2005) 43. van Berkum P, Fuhrmann JJ. 2000 Evolutionary
relationships among the soybean bradyrhizobia reconstructed from 16S rRNA gene and internally transcribed spacer region sequence divergence. Int. J. Syst. Evol. Microbiol.50, 2165 – 2172. (doi:10. 1099/00207713-50-6-2165)
44. Sievers Fet al.2011 Fast, scalable generation of high-quality protein multiple sequence alignments using Clustal Omega.Mol. Syst. Biol.7, 539. (doi:10. 1038/msb.2011.75)
45. Darriba D, Taboada GL, Doallo R, Posada D. 2012 jModelTest 2: more models, new heuristics and parallel computing.Nat. Methods9, 772. (doi:10. 1038/nmeth.2109)
46. Guindon S, Gascuel O. 2003 A simple, fast, and accurate algorithm to estimate large phylogenies by maximum likelihood.Syst. Biol.52, 696 – 704. (doi:10.1080/10635150390235520)
47. Guindon S, Dufayard J-F, Lefort V, Anisimova M, Hordijk W, Gascuel O. 2010 New algorithms and methods to estimate maximum-likelihood phylogenies: assessing the performance of PhyML 3.0.Syst. Biol.59, 307– 321. (doi:10.1093/sysbio/syq010)
48. Anisimova M, Gascuel O. 2006 Approximate likelihood-ratio test for branches: a fast, accurate, and powerful alternative.Syst. Biol.55, 539 – 552. (doi:10.1080/10635150600755453)
49. Shimodaira H, Hasegawa M. 1999 Multiple comparisons of log-likelihoods with applications to phylogenetic inference.Mol. Biol. Evol.16, 1114 – 1116. (doi:10.1093/oxfordjournals.molbev.a026201) 50. Charleston MA. 1998 Jungles: a new solution to the
host/parasite phylogeny reconciliation problem. Math. Biosci.149, 191 – 223. (doi:10.1016/S0025-5564(97)10012-8)
51. Stamatakis A, Auch AF, Meier-Kolthoff J, Goeker M. 2007 AxPcoords & parallel AxParafit: statistical co-phylogenetic analyses on thousands of taxa.BMC Bioinform.8, 405. (doi:10.1186/1471-2105-8-405) 52. Meier-Kolthoff JP, Auch AF, Huson DH, Goeker M.
2007 CopyCat: cophylogenetic analysis tool.
Bioinformatics23, 898 – 900. (doi:10.1093/ bioinformatics/btm027)
53. Sullivan JT, Ronson CW. 1998 Evolution of rhizobia by acquisition of a 500-kb symbiosis island that integrates into a phe-tRNA gene.Proc. Natl Acad. Sci. USA95, 5145 – 5149. (doi:10.1073/ pnas.95.9.5145)
54. Nei M. 1987Molecular evolutionary genetics. New York, NY: Columbia University Press. 55. Tajima F. 1983 Evolutionary relationship of
DNA-sequences in finite populations.Genetics105, 437 – 460.
56. Kimura M. 1977 Preponderance of synonymous changes as evidence for neutral theory of molecular evolution.Nature267, 275 – 276. (doi:10.1038/ 267275a0)
57. Lewontin RC. 1964 Interaction of selectionþ
linkage. I. General considerations—heterotic models.Genetics49, 49 – 67.
58. Hudson RR. 1987 Estimating the recombination parameter of a finite population-model without selection.Genet. Res.50, 245 – 250. (doi:10.1017/ S0016672300023776)
59. Hudson RR, Kaplan NL. 1985 Statistical properties of the number of recombination events in the history of a sample of DNA-sequences.Genetics 111, 147 – 164.
60. Weir BS, Cockerham CC. 1984 Estimating F-statistics for the analysis of population-structure.Evolution 38, 1358 – 1370. (doi:10.2307/2408641) 61. Mantel N. 1967 Detection of disease clustering and
a generalized regression approach.Cancer Res.27, 209 – 220.
62. Rosenberg MS, Anderson CD. 2011 PASSaGE: pattern analysis, spatial statistics and geographic exegesis. Version 2.Methods Ecol. Evol.2, 229 – 232. (doi:10. 1111/j.2041-210X.2010.00081.x)
63. Librado P, Rozas J. 2009 DnaSP v5: a software for comprehensive analysis of DNA polymorphism data. Bioinformatics25, 1451 – 1452. (doi:10.1093/ bioinformatics/btp187)
64. Maddison DR, Maddison WP. 2005MacClade 4.08: analysis of phylogeny and character evolution. Sunderland, MA: Sinauer Associates.
65. Hurlbert SH. 1971 Nonconcept of species diversity—critique and alternative parameters. Ecology52, 577 – 586. (doi:10.2307/1934145) 66. Peet RK. 1975 Relative diversity indexes.Ecology56,
496 – 498. (doi:10.2307/1934984)
67. Smith JM, Feil EJ, Smith NH. 2000 Population structure and evolutionary dynamics of pathogenic bacteria. Bioessays22, 1115–1122. (doi:10.1002/1521-1878(200012)22:12,1115::AID-BIES9.3.0.CO;2-R) 68. Smith JM, Smith NH, Orourke M, Spratt BG. 1993
How clonal are bacteria.Proc. Natl Acad. Sci. USA 90, 4384 – 4388. (doi:10.1073/pnas.90.10.4384) 69. Zak JC, Willig MR, Moorhead DL, Wildman HG. 1994
Functional diversity of microbial communities: a quantitative approach.Soil Biol. Biochem.26, 1101 – 1108. (doi:10.1016/0038-0717(94)90131-7) 70. Smith JM, Haigh J. 1974 The hitchhiking effect of a
favorable gene.Genet. Res.23, 23 – 35. (doi:10. 1017/S0016672300014634)
71. Pritchard JK, Pickrell JK, Coop G. 2010 The genetics of human adaptation: hard sweeps, soft sweeps, and polygenic adaptation.Curr. Biol.20, R208 – R215. (10.1016/j.cub.2009.11.055)
72. Ehinger M, Mohr TJ, Starcevich JB, Sachs JL, Porter SS, Simms EL. 2014 Specialization-generalization trade-off in aBradyrhizobiumsymbiosis with wild legume hosts.BMC Ecol.14, 8. (doi:10.1186/1472-6785-14-8)
73. Croucher NJet al.2011 Rapid pneumococcal evolution in response to clinical interventions.Science331, 430–434. (doi:10.1126/science.1198545)
74. Croucher NJet al.2009 Role of conjugative elements in the evolution of the multidrug-resistant pandemic clone Streptococcus pneumoniae(Spain23F) ST81.J. Bacteriol. 191, 1480–1489. (doi:10.1128/JB.01343-08) 75. Kennedy ADet al.2008 Epidemic
community-associated methicillin-resistantStaphylococcus aureus: recent clonal expansion and diversification. Proc. Natl Acad. Sci. USA105, 1327 – 1332. (doi:10. 1073/pnas.0710217105)
76. Nazir R, Warmink JA, Boersma H, van Elsas JD. 2010 Mechanisms that promote bacterial fitness in fungal-affected soil microhabitats.FEMS Microbiol. Ecol.71, 169–185. (doi:10.1111/j.1574-6941.2009.00807.x)