incorporate implications of the production function estimates in this work.
Concerns regarding the insufficient supply of CRNAs have been pervasive in recent years. In 1990, the National Center for Nursing Research of the National Institutes of Health published an extensive study of the shortage of CRNAs conducted through an agreement with the Division of Nursing of the Bureau of Health Professions, Health Resources and Services Administration, synthesizing and critiquing prior studies and existing secondary data. This study con-cluded that a shortage existed based on trends pro-gressing in the 1980s, including declines in the num-ber of programs and graduates, a survey of hospitals documenting a shortage, and a reduction of the ratio of CRNAs to anesthesiologists from 2:1 to 1.2:1. This study identified barriers to increasing the number of CRNAs trained including the lack of sites for clinical training as well as the lack of faculty.1
The American Association of Nurse Anesthetists (AANA) attributed the reduction of CRNA educational programs as a root cause of the decline in CRNA gradu-ates and implemented strategies to promote the growth of new programs and to promote the role of CRNAs in anesthesia.2,3In 1976, there were 194 educational pro-grams preparing CRNAs; the number declined to 104 programs by 1986 and to 82 programs by 1990.2
Ongoing efforts have mitigated the long-term effect This study determined the current trends in supply,
demand, and equilibrium (ie, the level of employment where supply equals demand) in the market for Certified Registered Nurse Anesthetists (CRNAs). It also forecasts future needs for CRNAs given different possible scenarios. The impact of the current availability of CRNAs, projected retirements, and changes in the demand for surgeries are considered in relation to CRNAs needed for the future. The study used data from many sources to estimate models associated with the supply and demand for CRNAs and the relationship to relevant community and policy characteris-tics such as per capita income of the community and
man-aged care. These models were used to forecast changes in surgeries and in the supply of CRNAs in the future.
The supply of CRNAs has increased in recent years, stim-ulated by shortages of CRNAs and subsequent increases in the number of CRNAs trained. However, the increases have not offset the number of retiring CRNAs to maintain a stant age in the CRNA population. The average age will con-tinue to increase for CRNAs in the near future despite increases in CRNAs trained. The supply of CRNAs in relation to surgeries will increase in the near future.
Key words:Anesthesia manpower, CRNA, demand, nursing workforce, supply.
Supply, demand, and equilibrium in the market
for CRNAs
Elizabeth Merwin, RN, PhD, FAAN Steven Stern, PhD
Charlottesville, Virginia
Lorraine M. Jordan, CRNA, PhD
Park Ridge, Illinois
T
he supply of Certified Registered Nurse Anesthetists (CRNAs) available to provide anesthesia care for surgeries, pain manage-ment, and healthcare procedures affects the nation’s capacity to provide healthcare to its people. Emergency surgeries and procedures requir-ing anesthesia necessitate the availability of anesthesia providers at all times within the healthcare system. Although there is an overall shortage of registered nurses and individuals must be registered nurses before entering graduate study to become CRNAs, there have been many registered nurses interested in becoming CRNAs. Research on the supply and demand of registered nurses in general is not very informative about the market for CRNAs given its highly specialized nature.The demand from consumers for surgery and for procedures requiring anesthesia care creates a “derived” demand for CRNAs. The demand for surgi-cal services potentially is influenced by consumers’ characteristics such as age, income, geographic loca-tion, and the availability and type of third-party reim-bursement for healthcare. The demand for CRNAs then is determined by prices and organizational con-siderations. We provide some estimates of the produc-tion funcproduc-tion for surgeries (E.M., S.S., L.J., unpub-lished data, 2004). But, because it is unclear how present financing rules affect demand, we did not
of these closures. For example, the 2000-2001 “Focus Team on Education” initiative focused on developing new programs and new clinical sites and assisted pro-grams facing closure due to financial constraints. This group reported that there were 85 programs in exis-tence with an additional 17 postmaster’s certificate pro-grams using 707 clinical sites at that time.4 By 2004, there were 88 programs with more than 1,000 clinical sites.5Overall, collective efforts have resulted not only in an increase in clinical sites but also in an increase of graduates. In 1994, there were 990 graduates, and in 2000, there were 1,075 graduates. According to the AANA Council on Certification, the number of gradu-ates was 1,628 in 2004. However, there has been no overall growth in the number of programs producing these graduates. There were 88 programs in 2004, the same number of programs reported in 1994.2,5,6
During this period, a national nursing shortage was recognized and is expected to only get worse in the near future.7,8There also was concern about the future supply of physicians9and the current shortage of anes-thesiologists.10-13 A decrease in the number of new entrants to anesthesiology resident programs in the mid-1990s14 contributed to workforce declines. The number of residents specializing in anesthesiology declined from 5,868 in 1994 to 4,989 in 2004, whereas the number of graduates decreased from 1,743 in 1994 to 1,393 in 2004. However, the number of students in postgraduate year 1 increased from 281 in 1994 to 638 in 2002 but declined to 431 in 2004.12,15
In this article, we estimate basic models of supply and demand for CRNAs and project their implications for the market for CRNAs into the future. We present the methods and results for the supply models first and then present these same sections for the demand mod-els. The models are basic in that (1) the supply model is mechanistic and does not depend on wage levels, for example, and (2) the demand model does not allow for any adjustments in the production of surgeries as rela-tive prices change. Predictions of the future supply of available CRNAs are presented based on trends in the number of new graduates entering the field, trends in the number of CRNAs leaving the field, and trends in the age distribution of CRNAs. We also estimate and predict the demand for surgical procedures as a func-tion of changing community characteristics. Projec-tions under changing condiProjec-tions are presented. Finally, actions are suggested for workforce planning.
Materials and methods
Supply and demand models were developed sepa-rately for this study. Following the estimation of these separate models, the equilibrium between supply and demand was computed, and projections were made
for the future. First, methods used in the supply mod-els are described. Then, the methods used to deter-mine the demand for surgeries and the derived demand for CRNAs are presented. Finally, methods for future predictions are discussed.
AANA membership, certification, student enroll-ment, and longitudinal annual survey data are used to describe the supply of CRNAs. First, trends related to each of these factors are presented. Second, projec-tions for the future with respect to CRNA education, age of entry, and exit rates are made conditional on maintaining the status quo. Finally, different projec-tions are made based on future possible changes such as increasing the number of CRNAs who are educated each year. The statistical methods include descriptive analyses and regression analyses. Econometric meth-ods are used in the supply and demand and forecast-ing models. For ease of presentation and interpreta-tion, data results are presented in graphic formats with accompanying narrative discussion.
The effect of community characteristics on demand for surgeries was estimated using data contained in the Area Resources File,16a health planning database con-structed by the Health Resources and Services Admin-istration. Specifically, community characteristics were considered such as the impact of how urban or rural the community is; the population demographics of the community, including the age of the population; the income of the community; and the penetration of man-aged care. An assumption that the input mix used in the production of surgeries will not change was made to predict demand for CRNAs. To measure the effect of these characteristics on demand, a regression model was developed. Through much of the analysis, vari-ables were transformed using smoothing techniques. Smoothing is a way to take into account the availabil-ity and use of surgical services in nearby counties. The data were smoothed because consumers of surgeries cross county lines to receive services.
Following the estimation of the supply of CRNAs and the demand for surgeries, ratios were developed of the supply of CRNAs in relation to the demand for surgeries. By using the aforementioned regression models, projections for the future supply and demand for CRNAs were made. Ratios of these projections were determined. Differences in projections of the supply for CRNAs and the demand for surgeries and for changes in the ratios given changes in assumptions were evaluated through graphic analysis.
Supply results
The basic idea in predicting supply into the future is to estimate entry rates into the CRNA profession and exit rates out of the profession. There are 3 main factors
that are evaluated for their impact on current and future supply predictions: the number of CRNAs cated and newly certified; the age of these newly edu-cated and certified CRNAs at time of entry into the field; and the rate at which CRNAs retire or leave CRNA employment. Once the entry and exit rates are estimated, we can simulate changes in supply over time. This ignores any adjustments by individual CRNAs to changes in working conditions or wages (eg, by changing retirement dates) or adjustments by CRNA education programs to changes in the market. Given these qualifications, this process is useful in that, along with demand projections, it gives a reason-ably accurate prediction of what the market for CRNAs will look like for the intermediate future, assuming no major structural changes such as major changes in reimbursement or entry level requirements.
Trends in CRNA education, certification, and
age distribution
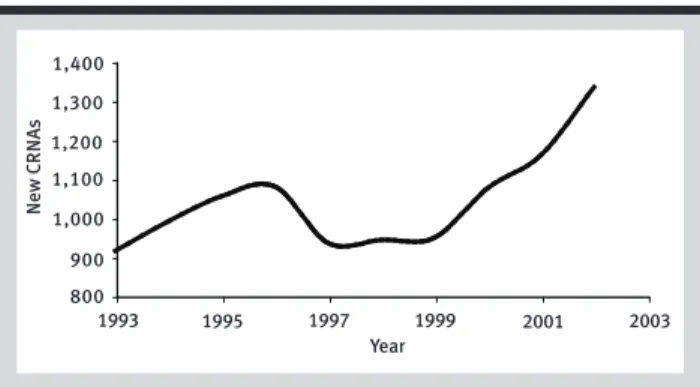
Figure 1 shows how entry into the profession changed during a 10-year period. Especially during the last 3 years, there was a large increase in the number of newly educated CRNAs. Figure 2 shows how certifi-cations (entry) and enrollment of students 2 years before certification have been increasing. It was deter-mined that information about the number of enroll-ments in a specific year provides an almost perfect prediction of the number of new nurses who will become certified 2 years later. Figure 2 took this rela-tionship into consideration and used it to predict cer-tifications in 2003 and 2004. These are represented by the dotted line in Figure 2. The results predict that there will be 1,684 CRNAs certified in 2004, a 26.2% increase relative to the 1,333 certified CRNAs in 2002. Assuming that the increased rate of entry will con-tinue, it would be inappropriate to base supply pro-jections on entry rates from an earlier period.
Another factor that affects the future supply of CRNAs is the age of the workforce of CRNAs
through-out the country and the age at which nurses become CRNAs. Figure 3 shows the age density of new CRNAs for the 2001-2002 period. One should note that the modal age of entry into the field is the early 30s, but there is a large proportion of CRNAs entering the field at much higher ages. CRNAs entering at higher ages probably will have shorter careers and not contribute as much to the long-term supply of CRNAs. Because CRNA programs require a baccalau-reate degree and a minimum of 1 year of acute care experience, registered nurses have been entering nurse anesthesia graduate programs later in life.
Retirement rates and age at retirement
The AANA commissioned a study of CRNA retire-ment based on AANA membership data.17 By using data from that study, net exit rates were estimated, and then, by using the entry data for the 2001-2002 period, net exit rates were decomposed into entry rates and exit rates. Although there is some significant variation in exit rates in later work years, for the years with the largest number of CRNAs, the exit rate is rel-atively stable. The average exit rate was also plotted and showed a high exit rate in the late 20s and early 30s. This is most likely due to female CRNAs leaving the workforce to raise children; however, in their later
800 900 1,000 1,100 1,200 1,300 1,400
N
e
w
C
R
N
A
s
1995
1993 1997 1999 2001 2003
Year
Figure 1. Entry of new CRNAs into the market, 1993-2003
No. of certified No. of students Predicted certifications
1998
1996 2000 2002 2004 2006 Year
800 1,000 1,200 1,400 1,600 1,800
N
u
m
b
e
r
Figure 2. Trends in the number of certifications and enrolled students from 1996 to 2006
0.00 0.02 0.04 0.06 0.08 0.10
35
30 40 45 50 55
25
Age
P
ro
p
o
rt
io
n
Figure 3. Proportion of CRNAs entering the labor market by age
30s, the exit rate is negative, implying these women return to the CRNA workforce after their children have grown older.
To verify the accuracy of the methodology, the aver-age exit rate for the 1994-1997 period was compared with the average exit rate for the 2000-2002 period (using updated membership data). As was true in the preceding discussion of exit rates, there is some vari-ation in exit rates at later ages. This is mostly caused by randomness associated with small numbers. The average exit rate for the 1994-1997 period is remark-ably similar to the average exit rate for the 2000-2002 period except for some deviations in later ages. These deviations do not have a large impact on aggregate supply because most CRNAs have retired by the time these deviations occur. Thus, the estimated 1994-1997 age-specific exit rates are used for the remainder of the analysis. The data were plotted to compare the predictions with the actual data. The plot demon-strated that the fit of the predictions is extremely good in that the total number of predicted CRNAs matches the actual number of CRNAs almost exactly.
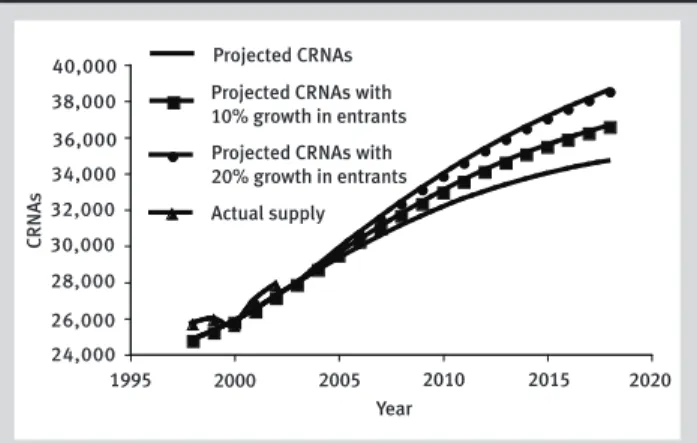
Figure 4 shows the projected number of CRNAs into the future under 3 different scenarios. These sce-narios consider the impact of the supply of CRNAs if different rates of entry of new CRNAs into the field occur. The 3 scenarios considered are the following: (1) Entry continues at the 2002 rate. (2) Entry increases by 10% relative to the 2002 rate but with no change in the age distribution of new entrants. (3) Entry increases by 20% relative to the 2002 rate but with no change in the age distribution of new entrants. Under all 3 scenarios, there is a significant increase in the number of practicing CRNAs.This pro-jected increase will be compared later with propro-jected increases in demand for surgeries.
Changes to the distribution of age under the 3 dif-ferent rates of entry scenarios also can be projected. Figure 5 shows how average age changes over time for the 3 scenarios. If CRNAs continue to enter at the 2002 rate, the average age will continue to rise until about 2015 and reach a peak at about 48.2 years. With a 10% increase in the number of CRNAs educated, the peak will occur a few years earlier at an age of 47.8. With a 20% increase in the number of CRNAs edu-cated, the average age will level off very quickly.
Demand for surgeries/derived demand for
CRNAs
The demand for surgeries depends potentially on the healthiness of the community, the wealth of the munity, and the insurance environment of the com-munity. CRNAs are inputs used in the production of
surgeries. Hospitals and other providers of surgical services seek to obtain the services of CRNAs (demand CRNAs) only because CRNAs are productive in pro-viding surgical services and consumers demand surgi-cal services. The model estimating the demand for sur-geries is presented in the Table. A log transformation of the number of surgeries was used to meet the statis-tical assumptions required for modeling (ie, the dependent variable is represented by LOGSURG).
The Table shows the community characteristics that were used to estimate the demand for surgeries. By using data on each county in the country, a model was developed to explain the impact of community characteristics on surgeries. The number of surgeries reflects inpatient and hospital-based outpatient sur-geries. About 50% of the variation in the number of surgeries is accounted for by the variables in the model. The parameter estimates are included. The sign of the estimate shows whether the characteristic is associated with increasing or decreasing the num-ber of surgeries occurring in a county.
2000
1995 2005 2010 2015 2020
Year 24,000
26,000 28,000 30,000 32,000 34,000 36,000 38,000 40,000
C
R
N
A
s
Projected CRNAs Projected CRNAs with 10% growth in entrants
Actual supply Projected CRNAs with 20% growth in entrants
Figure 4. Forecasted numbers of CRNAs into the future given different growth rates for CRNAs educated
46.4 46.6 46.8 47.0 47.2 47.4 47.6 47.8 48.0 48.2 48.4
A
g
e
2000
1995 2005 2010 2015 2020
Year Average age Average age
with 10% growth in entrants
Average age with 20% growth in entrants
Figure 5. Forecasts of the average age of CRNAs in the future given different growth rates of newly educated CRNAs
The results suggest that surgeries increase with urbanicity (although by a small amount), with the proportion of the county that is white or female, and with median household income. They decrease with old or young population groups, with median home values, and with increased HMO (health maintenance organization) competition. In other literature, researchers have found a positive correlation between the proportion of the population older than 65 years and the per capita surgeries. In the data used in this study, the correlation is 0.421 even though the ordi-nary least squares regression estimate is negative. The results suggest that it is other variables correlated with the proportion older than 65 years that cause the pos-itive correlation rather than the proportion itself. In other words, once one holds constant the other vari-ables correlated with aging, the direct effect of aging on per capita surgeries is negative. This model was used to predict future demand for surgeries.
Discussion
• Equilibrium between supply and demand. Policy makers frequently discuss equilibrium issues for nurses in general and for CRNAs in particular in terms of shortages.8,12 Yet, most economic theory does not really accept the notion of shortages. The notion of a shortage is that, at the market wage, there is more demand for the input (eg, CRNAs) than there is sup-ply of that input. The question begged by the shortage notion is “Why doesn’t the wage of the input increase to equilibrate supply and demand?” People who like
the notion of shortages usually measure them in terms of vacancy levels. But some vacancies should always exist in a market with significant turnover and mobil-ity, and one should wonder why the hospital with the vacancies does not raise the offered wage to attract the desired input. The whole issue of the validity of short-ages can be avoided by using an alternative measure of the need for more CRNAs. The proposed measure of need is the ratio of CRNAs to surgeries, ie, the number of CRNAs compared with the number of surgeries.
As demand for surgeries increases, hospitals must provide wages to CRNAs to increase supply or substi-tute for CRNAs by using other inputs. To the degree that they choose the former, the ratio of CRNAs to surgeries will remain constant. To the degree that they choose to substitute other inputs for CRNAs, the ratio will decrease. If, for example, the rate of education of new CRNAs were to decrease, reducing the supply of CRNAs, wages would rise, reducing the demand for CRNAs until it was in line with the supply of CRNAs, or there would be a shortage. Note that whether one believes in shortages is not relevant; in either case, the ratio captures what is occurring in the market.
The first step in projecting the ratio is projecting demand for surgeries. It was assumed that each of the characteristics listed in the Table continues to grow at the same rate as it had during the 1990-2000 period, disaggregated at the state level. The growth rates were estimated by using data from the Area Resources File. Given the projections for each of the characteristics into the future, demand for surgeries was predicted at the
Name Definition
LOGSURG Estimated log of per capita smoothed surgeries Estimate (SE)
Intercept –6.624* (0.420)
URBAN Dummy variable if 0 ≤ rural-urban index ≤ 3 0.020* (0.007)
SUBURBAN Dummy variable if 4 ≤ rural-urban index ≤ 6 0.010 (0.006)
PCSWHITE Smoothed whites/smoothed population 0.435* (0.032)
POP65 Smoothed>64/smoothed population –0.629* (0.210)
POP18 Smoothed<19/smoothed population –2.945* (0.247)
PCSFEMALE Smoothed females/smoothed population 12.249* (0.601)
MHHY Log of smoothed median household income 0.137* (0.027)
MHOMEV Log of smoothed median home values –0.255* (0.014)
HMOCOM Health maintenance organization (HMO) competition index –0.035* (0.009)
HMOPEN HMO penetration index –0.025 (0.022)
R2 0.497
* Significant at the 5% level.
Table. Influence of community characteristics on demand for surgery, accounting for influence of nearby communities (N = 3,114)
county level and then aggregated to a state level and a national level. The mean log county demand increases from 8.56 in 2000 to 8.60 in 2005 to 8.64 in 2010.
One reason that log surgeries are increasing is that the population is increasing. A reasonable way to decompose the growth in surgeries is into a popula-tion growth rate and a per capita demand for surger-ies growth rate. The mean of log smoothed per capita surgeries declines from –2.34 in 2000 to –2.36 in 2005 to –2.37 in 2010. These results suggest that all of the growth in demand for surgeries will be due to population growth. There actually will be a small reduction in per capita demand for surgeries as the population becomes less white and older, even though they will also be wealthier.
The ratio of CRNAs (supply) to demand for (1,000) surgeries is plotted as the baseline curve in Figure 6. The baseline curve is indistinguishable from the increase in HMO penetration curve. This is discussed later. The ratio of CRNAs to demand for surgeries increases from approximately 1.02 in 2000 to 1.16 in 2010. This implies a greater supply of CRNAs per sur-gical procedure performed. This is likely to lead to stagnation in CRNA wages and reduced vacancies.
•Projection of future CRNA supply and demand lev-els.A number of alternative scenarios are considered. First considered is the possibility that the age of the population increases along with the other variables that move with it (eg, wealth, proportion that is female) so that demand for surgeries increases by 2% per year. This has a large effect on the ratio. However, for the 2000-2010 period, with rapid growth in the number of CRNAs, the ratio still increases, though much less than the increased demand for surgeries.
Next, the possibility of increased penetration of HMOs (by 10%) is considered. As shown in the Table, the estimate was very small. This has essentially no impact on the ratio because it has a very small effect on demand for surgeries. However, other changes in pricing of surgeries could have much larger effects on the ratio.
Finally, increases in the rate of education of CRNAs by 10% and 20% relative to the rate in 2002 are con-sidered. Note that the projected increase in CRNAs cer-tified in 2004 is 26.2% greater than in 2002. Both of these scenarios increase the ratio, but the effects are only modest because it takes much time for a change in a flow (education rate) to have a significant effect on a stock (total number of CRNAs). However, the baseline scenario described in the preceding section already indicates an increasing CRNA/surgery ratio at baseline, ie, before increases in education rates are considered. Because the actual rate of increase from 2002 to 2004 increased at 26% vs the 20% increase that was
simu-lated, an even higher ratio of CRNAs to surgeries can be expected if this rate of growth continues.
The simulation of other scenarios was considered but not executed. Simulating the effects of changing technology and increasing the number of anesthesiol-ogists was considered. But these scenarios were not pursued because any simulation would be purely speculative. In particular, no information is available on how technology might change or, more to the point, how it might change the demand for CRNAs, and there is no good model of how hospitals make decisions about the mix of CRNAs and anesthesiolo-gists. However, our lack of understanding does not reduce the importance of these questions.
The supply of anesthesiologists is expected to increase significantly in the near future.18To the degree that CRNAs and anesthesiologists are substitutes and compete with each other, the projected increased sup-ply of anesthesiologists will have the same effect as a decrease in demand for surgeries. CRNAs are also becoming more involved in activities other than sur-geries, such as pain management and radiology. Although we have little information on this phenome-non, we still recognize that, if it continues, demand for CRNAs will increase faster than implied by the growth in surgeries. This is a critical issue for future study. REFERENCES
1. Department of Health and Human Services (DHHS). Study of nurse anesthetist manpower needs. Bethesda, Md: Department of Health and Human Services, Public Health Service, National Insti-tutes of Health, National Center for Nursing Research; 1990. 2. National Commission on Nurse Anesthesia Education. Final
report of the task force. Park Ridge, IL: American Association of Nurse Anesthetists; 1994.
3. Mastropietro CA, Horton BJ, Ouellette SM, Faut-Callahan M. The National Commission on Nurse Anesthesia Education 10 years
later, Part 1: The commission years (1989-1994).AANA J.2001;
69:379-385. 1.00 1.05 1.10 1.15 1.20 1.25
R
a
ti
o
1998 2000 2002 2004 2006 2008 Year Baseline
Population aging
Increased HMO penetration 10% increased training 20% increased training
2010 2012
Figure 6. Projections of the ratio of CRNAs to surgeries given different possible future scenarios
4. Horton BJ. Focus Team on Education Report to AANA Board of Directors. Park Ridge, Ill: AANA; 2001.
5. American Association of Nurse Anesthetists. Education of nurse anesthetists in the United States: At a glance. 2004. Available at: http://www.aana.com/crna/prof/education_fact_sheet.asp. Accessed July 9, 2004.
6. American Association of Nurse Anesthetists Council on Certifica-tion of Nurse Anesthetists. Park Ridge, Ill: AANA; 2005. 7. Buerhaus P, Staiger D. Trouble in the nurse labor market? Recent
trends and future outlook.Health Aff.2000;18:214-222.
8. Buerhaus P, Staiger D, Auerbach D. Implications of an aging RN
workforce.JAMA.2000;283:2948-2954.
9. Cooper RA, Getzen TE, McKee HJ, Laud P. Economic and
demo-graphic trends signal an impending physician shortage.Health Aff.
2002;21:140-154.
10. Eckhout G, Schubert A. Where have all the anesthesiologists
gone? Analysis of the national anesthesia worker shortage.ASA
Newsletter.2001;65:16-19.
11. Lema MJ. In case you haven’t heard…there are no available
anes-thesia providers.ASA Newsletter.2001;65:1-3.
12. Grogono AW. Resident numbers and total graduating from resi-dencies and nurse anesthesia schools in 2003: Continuing
short-ages expected.ASA Newsletter.2003;67. Available at: http://www.
asahq.org/Newsletters/2003/11_03/grogono.html. Accessed May 11, 2004.
13. Grogono AW. National resident matching program results for
2004: Slight decline in recruitment. ASA Newsletter. 2004:68.
Available at: http://www.asahq.org/Newsletters/2004/05_04/
grogono05_04.html. Accessed July 9, 2004.
14. Reve JG, Rogers MC, Smith LR. Resident workforce in a time of U.S.
health-care system transition.Anesthesiology.1996;84:700-711.
15. Grogono AW. Resident numbers and graduation rates from
resi-dencies and nurse anesthetist schools in 2004. ASA Newsletter.
2004;68. Available at: http://www.asahq.org/Newsletters/2004/11_ 04/grogono11_04.html. Accessed April 9, 2005.
16. Area Resources File, Health Resources and Services Administra-tion. Available at: http://bhpr.hrsa.gov/healthworkforce/data/arf.
htm. Accessed July 9, 2004.
17. Revak GR, Jaffe JM. CRNA Final Report. Park Ridge, Ill: American Association of Nurse Anesthetists; 1998.
18. Schubert A, Gifford E, Tremper K. An updated view of the national
anesthesia personnel shortfall.Anesth Analg.2003;96:207-214.
AUTHORS
Elizabeth Merwin, RN, PhD, FAAN, a health services researcher, is the Madge M. Jones professor of nursing and the associate dean for research at the University of Virginia, Charlottesville, Va. Email: eim5u@Virginia.EDU
Steven Stern, PhD, an economist, teaches labor economics and econometrics at the University of Virginia, Charlottesville, Va, where he is the Merrill Bankard professor in the Department of Economics.
Lorraine M. Jordan, CRNA, PhD, is the director of research for the AANA and serves as the director of the AANA Foundation, Park Ridge, Ill.
ACKNOWLEDGMENTS
We thank the Internal and External Advisory Panels for the AANA Workforce Study for their many insights and useful contributions to this study. The members of these panels provided invaluable assistance in designing and implementing a study relevant to workforce issues faced in different areas of the country, in different settings, and within different practice arrangements. The AANA funded the Advisory Panels. We appreciate the responsive support of many AANA staff mem-bers who provided information for the study. Luis A. Rivera, MBA, CAE, senior director, Executive Affairs, was particularly helpful. We thank Jeffery Beutler, CRNA, MS, executive director, for his support of the study. Funding from the AANA Foundation made it possible to conduct this study.
This study was reviewed and approved by the University of Virginia Institutional Review Board. It was funded by the American Association of Nurse Anesthetists Foundation through a consulting arrangement with the first 2 authors who are principals of Quantitative Health Care Solutions, Inc.
We also thank Paul Carrillo, PhD; Jason Hulbert, MA; Mei Xue, RN, MSN; and Kenneth Wilbur, PhD, for excellent research assistance.