Featured Articles
Water Distribution Solution for More Efficient Operation of
Water Supply
Shinsuke Takahashi, Ph.D. Shingo Adachi
Takeshi Takemoto Minoru Umeki
OVERVIEW: The water industry is facing major changes in its business environment, including a rising need to replace aging equipment set against falling demand and revenue due to the declining population. One factor seen as critical to achieving ongoing progress under these conditions will be to reduce costs further by improving the efficiency of capital investment and operations. In response to these challenges, Hitachi is working on research and development and supplying solutions that facilitate greater operational efficiency, including energy-efficient water supply operation systems and water distribution control systems that help in ways that include reducing electricity costs and the load on the environment. The solutions that Hitachi is currently developing with the aim of making further efficiency gains, including by reducing capital investment and operating costs, are a water supply operation technique that can cut or shift peak demand for electric power, a technique for reducing capital investment by determining the appropriate time to replace water pipes, and a leak distribution estimation technique that reduces management costs by improving the productivity of leak surveys.
INTRODUCTION
THE water industry is facing major changes in its business environment, including a rising need to replace aging equipment set against falling demand and revenue due to the declining population(1). There
is also demand for measures to make equipment more resilient in light of the experience from the Great East Japan Earthquake, and for measures that can cut or shift peaks in electric power consumption in response to power shortages. One factor seen as critical to achieving ongoing progress under these conditions will be to reduce costs further by improving the efficiency of capital investment and operations.
In response to these challenges, Hitachi is working on research and development and supplying solutions that facilitate greater operational efficiency, including energy-efficient water supply operation systems and water distribution control systems that help in ways that include reducing electricity costs as well as the load on the environment. This article describes three examples of new research and development that are the latest initiatives by Hitachi in this field (see Fig. 1). One is a water supply operation technique
that can reduce electric power costs by providing an electric power demand response (DR) function or by accepting requests to cut or shift peaks in electric power consumption. The others are a technique based on the evaluation of life cycle cost (LCC) that reduces capital investment by determining the appropriate time to replace water pipes, and a leak distribution estimation technique that reduces management costs by improving the productivity of leak surveys.
WATER SUPPLY OPERATION AND PLANNING TECHNIQUE WITH ELECTRIC POWER DR FUNCTION
DR has attracted attention in recent years as a way to control the consumption of electric power during periods of peak demand to ensure a reliable supply(2).
DR is an incentive scheme that encourages users to reduce their demand when needed to maintain the balance of supply and demand. DR comes in the form of both tariff-based and incentive schemes. Tariff-based schemes use electricity pricing options to encourage users to shift peak demand, such as critical peak pricing and time-of-use (TOU) tariffs that vary
depending on the time of day. Incentive schemes such as load control programs request users to reduce their power use at times when the supply of electric power is constrained and pay them for doing so in the form of a bonus. Hitachi has developed a water supply operation technique that reduces electricity costs by earning these incentives.
Water Supply Operation Technique
The water supply operation technique consists of an operation mode that seeks to smooth electric power use in ways that cut the basic tariff by cutting or shifting demand peaks (that is, by smoothing demand across the course of a day), and a DR operation mode that earns incentives by reducing demand in response to requests (see Fig. 2). Water supply systems use a large number of distribution reservoirs to buffer the gap between demand for water and the supply from the water treatment plants. Furthermore, falling demand in recent years means there are a significant number of distribution reservoirs with excess capacity. This means that peaks in electricity demand can be shifted or cut by taking advantage of this unused water storage capacity to shift the timing of conveying pump operation.
Minimizing electric power consumption as far as possible during demand peaks or during time periods specified in DR requests requires well-formulated operating plans to ensure that pump operating times do not overlap. It also requires risk management to ensure that the water levels in distribution reservoirs do not fall below their lower limits. The first of these challenges is met by using mathematical programming called minimum-maximum (min-max) optimization
to produce detailed pump operating plans. For the second challenge, low water level limits are set so as to retain a 12-hour buffer of water supply in the event of a problem such as a conveying pump failure, and the pump operating plans are formulated in a way that ensures these limits are not violated. These practices Solution
Water supply operation and planning technique that works with electric power DR Water source
Water
intake Water treatment plant Distribution
reservoir
Water distribution network Aqueduct
Water intake and conveyance Water distribution
Main
water pipe Water distributionpipes
Component technologies
Linear programming and modeling
Water pipe replacement technique
Statistical analysis and modeling
Leak distribution estimation technique
Optimization and distribution network simulation/GIS
P P P
Fig. 1—Water Distribution Solution for More Efficient Operation of Water Supply and Individual Technologies.
To deliver solutions that enhance operational efficiency, Hitachi is working on the research and development of a water supply operation and planning technique that works with electric power DR, a technique for determining when to replace pipes, and a leak distribution estimation technique.
P: pump DR: demand response GIS: geographic information system
Water supply operator
Power company
Smooth electric power use.
• Shift peaks in power use (smoothing).
• Reduce power consumption.
DR request Incentives
Distribution reservoir
Reduce basic power tariff.
Po
wer use
Po
wer use
Existing operating practice
Demand smoothing mode Existing operating practiceDR operation mode
DR request time
Time Time
Operate under electric power DR.
Earn incentives. P
P
Fig. 2—Water Supply Operation and Planning Technique. The water supply operation and planning technique provides an operation mode for smoothing the demand for electric power over the course of a day to reduce the basic power tariff, and an electric power DR operation mode that earns incentives by reducing demand in response to requests.
ensure the maximum possible power savings and maximize the incentive income and the reduction in power costs.
Benefits of Electric Power Management
Hitachi assessed the benefits of using the techniques it developed for electric power management at a medium-sized water distribution system serving a daily water demand of approximately 60,000 m3/d
(see Fig. 3). The operating plans covered not only the conveying pumps, but also the intake pumps that made up a large proportion of power consumption.
In power smoothing mode, the new system succeeded in reducing peak daily demand by approximately 20%, from 1,726 kW under existing practices to 1,374 kW. In DR mode, peak demand during the time period covered by DR requests (1 PM to 4 PM) was reduced by approximately 70%, from 1,550 kW under existing practices to 460 kW. It is also possible to operate using both modes at once. It is anticipated that using these operation modes will reduce annual electric power costs.
WATER PIPE REPLACEMENT TECHNIQUE BASED ON LCC EVALUATION
Water Pipe Replacement Technique
Hitachi has implemented a technique that evaluates the LCC of water pipes to calculate the best time to replace them (see Fig. 4). The “installation cost” means the cost of replacing water pipes spread across the number of years they will be in service, and the “running cost” means the total cost of operation spread across the number of years in service. This latter includes the cumulative total of repair costs, compensation for service outages or flooding, and the cost of water lost through leaks. The LCC is the sum of the installation cost and running cost. The installation
and running costs respectively decrease and increase the longer the pipes are in service. Accordingly, the best time to replace the water pipes is after the number of years of service that minimizes this sum. Because it is likely that the LCC will depend on the type of pipe (pipe material, diameter, and so on) and the conditions in which it is used (soil and ground conditions, and so on), it is necessary to calculate an LCC curve and optimal replacement timing separately for each case (pipe type and conditions).
Example Assessment
The LCC curve and optimal replacement timing were calculated using actual data on water leak incidents. For the running cost calculation, the average cost of a leak incident, including the cost of repairs and water loss, was calculated from historic data and the total cost was obtained by multiplying this by the total number of leak incidents. This “total number of leak incidents” was determined by summing up the leak incident rates (number of incidents per year for a unit length of pipe) for each type of pipe (pipe material, diameter, and number of years in use), which were
500 0
0 5 10 15
Time (h) Existing operating practice Demand smoothing mode
Demand smoothing mode
Po
wer use (kW)
20 25
1,000 1,500 2,000 2,500
500 0
0 5 10 15
Time (h) Existing operating practice DR operation mode
Electric power DR operation mode
Po
wer use (kW)
20 25
1,000 1,500 2,000 2,500
Fig. 3—Benefits of Using Water Supply Operation to Manage Electric Power.
The graphs show the benefits of using the demand smoothing and DR operation modes to manage electric power use.
Water pipe LCC evaluation
Annual cost Installation
cost
0 30 60 No. of years in service
Now
Running cost
Total cost (LCC) Replace when
LCC is minimum.
Fig. 4—Technique for Determining when to Replace Water Pipes Based on LCC Evaluation.
The technique determines the best time for replacing water pipes in order to minimize their LCC.
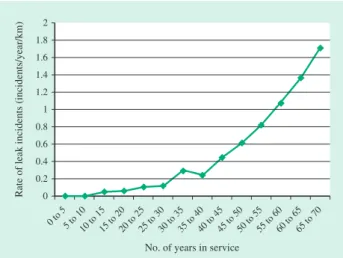
determined from historic leak incident data. Fig. 5 shows an example leak incident rate calculation for 75-mm pipe made of rigid polyvinyl chloride (VP). The calculation used actual data for the first 40 years of use and a predictive formula(3) for subsequent years.
Fig. 6 shows the LCC curve for 75-mm VP pipe. The minimum LCC occurs at 40 years. In other words, the best time for replacement is after 40 years of use. This same procedure can be used to calculate the optimal replacement timing under various different conditions. In this case, leaving the pipes in use for five or 10 years longer than the optimal time results in LCCs that are roughly 2 to 3% or 6 to 8% higher respectively. This demonstrates that deferring replacement for any longer (10 years or more) is undesirable because of the increased cost.
While this example produced a result that was close to the statutory durable life, depending on the type of pipe and conditions of use, it is likely that there are pipes that can last longer than this. This means there is scope for reducing the capital and maintenance costs for water pipes by using the same evaluation method to identify such pipes and then allowing them to remain in use for longer periods of time.
TECHNIQUE FOR ESTIMATING WATER LEAK DISTRIBUTION
To deal with leaks more efficiently, it is important to identify those parts of the water network in which leaks are most frequent. To minimize capital investment and improve leak management productivity, the number of sensors, field tests, and other resources required for this identification process needs to be kept to a minimum. Accordingly, Hitachi has developed a technique for estimating the distribution of leaks in the water distribution network by performing a hydrological analysis (pipe network calculation) using data from a limited number of flow and water pressure sensors located at different parts of the network and asset data such as the degree of obsolescence of the water pipes (see Fig. 7). This works by virtually
No. of years in service
Rate of leak incidents (incidents/year/km)
0 to 5 0 0.2 0.4 0.6 0.8 1 1.2 1.4 1.6 1.8 2
5 to 1010 to 1515 to 2020 to 2525 to 3030 to 3535 to 4040 to 4545 to 5050 to 5555 to 6060 to 6565 to 70
Fig. 5—Results of Leak Incident Rate Calculation.
The graph shows the rate of leak incidents (incidents/year/per km) plotted against the number of years in service.
Cost (× 10,000 yen/year/km)
10 0 200 400 600 800 1,000 1,200
20 30 40
No. of years in service 50
Running cost Installation cost LCC
60 70
Fig. 6—Results of LCC Calculation.
The LCC is the sum of the installation and running costs.
Water pipe asset data + estimated leak distribution (estimation
parameters) Planning for leak survey and repair
Flow sensor Pressure sensor
Estimation scope Pipe network
calculation model Estimation result
Minimize Flow rate
Measured
value Predictedvalue
Pressure
Flow rate Error
Pressure
#1 Area #1
#2 #2
#3
#3 Estimation
error
Leak quantity
Technique for estimating leak distribution
A quicker response and more efficient maintenance can be achieved by focusing survey and repair work on areas with a high level of leaks.
Fig. 7—Technique for Estimating Leak Distribution. The distribution of leaks on the water pipe network is estimated from water pipe asset data and pipe network calculations.
worked by splitting the above network up into five large district metered areas (DMAs) and then further dividing each of these into three virtual areas, giving a total of 15 virtual areas for the purposes of leak management. The two existing methods involve using and not using DMAs respectively. The former method splits the network into 15 DMAs for leak management and the latter method manages the entire network as a single undivided area. The management cost in Fig. 9 consists of the sum of all costs associated with leak management, including capital investment for things like establishing the DMAs and installing sensors, leak survey costs, and the cost of water lost due to leaks. The results show that the management cost for the new technique is approximately 10% lower than the existing method using DMAs. This was because the new technique requires less capital investment for splitting the network into DMAs.
CONCLUSIONS
This article has described a number of initiatives aimed at improving the operational efficiency of water distribution networks. These initiatives include a water supply operation technique that works with electric power DR and can be used to cut or shift peaks in power demand, a technique for determining when to replace water pipes based on LCC evaluation, and a technique for estimating the distribution of water leaks.
Hitachi intends to boost its contribution to the operation and planning of water supply systems by continuing to enhance and deploy these techniques. Hitachi also intends to continue developing new solutions that deliver further operational improvements by reducing things like capital investment and energy use through the effective coordination and harmonization of geographically distributed water supply systems.
REFERENCES
(1) Health Service Bureau, Ministry of Health, Labour and Welfare, “New Water Supply Vision” (Mar. 2013) in Japanese. (2) Nomura Research Institute, “NRI Knowledge Insight,” Vol.
23 (Mar. 2012) in Japanese.
(3) Japan Water Research Center, “Report on Research into Pipeline Technology for Sustainable Water Services (e-Pipe)” (Jan. 2011) in Japanese.
dividing the network up into a number of small areas and estimating the volume of leaks in each area. The technique estimates the unknown parameters that specify the geographical distribution of water leaks by performing a hydrological analysis such that the estimated pressures match the actual measured pressures. It uses asset data to determine how the likelihood of a water leak occurring varies across the region, and uses this to estimate the distribution of leaks. This reduces the number of parameters to be estimated and improves the reliability of the result.
A test that simulated actual field conditions demonstrated that the technique could estimate the quantity of leaks to an accuracy of ±2% of the total volume of water supplied by the network (see Fig. 8).
A cost-benefit analysis was also performed for a water distribution network with 300 km of pipe and leakage of around 20% (see Fig. 9). The new technique
Area 1
Area 1
Leakage
0% 2% 4% 6% 8% 10% 12%
Area 2
Area 2
Actual Pressure sensor
Distribution hub Estimated
Area 3
Area 3
Fig. 8—Results of Estimating Leak Distribution.
The graph shows the actual and estimated values for leaks in each of three virtual areas as a percentage of the total water supply across all three areas.
0 60 65 70 75 80 85 90 95 100
0.05 0.1
Existing practice (using DMAs) New technique
Existing practice (not using DMAs)
0.15 0.2
Mean water leakage (m3/d/user)
Management cost (million yen/year)
0.25 0.3 0.35 0.4
Fig. 9—Estimated Cost-benefit of Investment.
The graphs show a comparison of the management costs for the new technique and existing practices.
Shingo Adachi
Infrastructure Systems Research Department, Center for Technology Innovation – Systems Engineering, Research & Development Group, Hitachi, Ltd. He is currently engaged in the development of operation and planning technology for water supply systems. Mr. Adachi is a member of the IEEJ.
Minoru Umeki
Electric & Control Systems Department, Water & Environment Solutions Division, Infrastructure Systems Company, Hitachi, Ltd. He is currently engaged in the development and sales expansion of the controlling, monitoring and management system with information and communications technology (ICT) for public water and sewage treatment plants.
Shinsuke Takahashi, Ph.D.
Infrastructure Systems Research Department, Center for Technology Innovation – Systems Engineering, Research & Development Group, Hitachi, Ltd. He is currently engaged in the research and development of water supply systems. Dr. Takahashi is a member of The Institute of Electrical Engineers of Japan (IEEJ) and The Society of Instrument and Control Engineers (SICE).
Takeshi Takemoto
Public Control Systems Engineering Department, Electrical Equipment Information & Control Systems Division, Infrastructure Systems Company, Hitachi, Ltd. He is currently engaged in the development of monitoring and control systems for water supply and sewage facilities. Mr. Takemoto is a member of The Society of Chemical Engineers, Japan (SCEJ) and The Society of Environmental Instrumentation Control and Automation (EICA).