1028
MANAGING RISK IN SUPPLY CHAIN: A FRAMEWORK FOR
SUPPLY CHAIN RISK MITIGATION DECISION-MAKING
Anggriani Profita
Department of Industrial Engineering, Mulawarman University, Samarinda 75119 Indonesia E-mail: [email protected]
Iwan Vanany
Department of Industrial Engineering, Sepuluh Nopember Institute of Technology, Surabaya 60111 Indonesia, E-mail: [email protected]
Nurhadi Siswanto
Department of Industrial Engineering, Sepuluh Nopember Institute of Technology, Surabaya 60111 Indonesia, E-mail: [email protected]
ABSTRACT
Ineffective supply chain risks management is the disadvantage for the organization, such as financial, performance, physical, psychological, social, and/or time losses. Therefore, planning and evaluation process of risk mitigation strategies are substantial stages in supply chain risk management. This paper proposes a framework as decision support instrument for determining mitigation strategies. This instrument will enable the decision maker to examine the dynamic behaviour of risk, as well to test some alternatives of mitigation strategies and their trade off. The proposed framework integrates two approaches: Failure Mode, Effect, and Criticality Analysis (FMECA) and system dynamic simulation. The framework consists of four main steps, namely risk identification, risk analysis and evaluation, development of simulation model, and selection of risk mitigation alternatives. The applicability of framework has been tested using single case study in Cement Company.
Keywords: supply chain risk, mitigatiton strategy, FMECA, system dynamics simulation
1. INTRODUCTION
The challenge faced by supply chain management nowadays is how to meet the enhancement of customer expectations (Jain, et al., 2010), at a controllable production costs without compromising the quality or customer satisfaction (Shukla, et al., 2011). Outsourcing, global partnerships, and lean practices are several practices which have been widely adopted to improve supply chain efficiency. On the other side, the implementation of such practices simultaneously could increase the supply chain vulnerability towards market uncertainty, dependence upon suppliers, and risk (Singhal, et al., 2011).
Risk tend to have negative impacts on performance, profitability, income, sales, cost structure, assets, and inventory. Risk that occur in supply chain could seriously disrupt overall supply chain performance and satisfaction level of the downstream companies and end consumers (Carvalho, et al., 2012; Zegordi and Davarzani, 2012). Therefore, as pointed out by Henke (2009), proactive risk management will become a competitive advantage for the supply chain in the future. Risk management is an important process and hold a significant role in the success of supply chain management (Han and Chen, 2007; Lavastre, et al., 2012).
1029
The aim of supply chain risk management is to develop approaches to identify, assess, analyze, and deal with vulnerable and risky areas in supply chain (Trkman and McCormack, 2009). In general, approaches in risk management are classified into four main strategies, namely risk avoidance, risk reduction, risk transfer, and risk acceptance (Mullai, 2009; Lavastre, et al., 2012; Behdani, 2013). The decision regarding the appropriate risk management strategy is based on the outcome of risk analysis process (Khan and Burnes, 2007). Mitigation is a form of risk reduction strategy which focuses on preventive measures, such as the identification of potential risk and reduces the probability of risk occurrence (Dani, 2009; Mullai, 2009).
In this paper, we develop a proposed framework for the decision-making of supply chain risk mitigation strategy. We integrated the Failure Mode, Effect, and Criticality Analysis (FMECA) and system dynamic simulation. The integration of these methods can be utilized as an instrument for evaluating the alternatives of risk mitigation strategy, particularly operational risk which associated with its continuous characteristic. In addition, the decision-maker may also extend the usage of the proposed framework as proactive supply chain risk management due to its ability to predict and estimate the probability of risk occurrence and measure the potential impact of risk event. For illustrative purposes, we present the application of the framework to a large cement company in Indonesia.
2. LITERATURE REVIEWS
A number of previous studies have been conducted which aimed to present the models for risk analysis and mitigation. Pujawan and Geraldin (2009) introduced a model of proactive supply chain risk management called the House of Risk (HOR). HOR was a proactive model which intended to make preventive measures against risk agents faced by supply chain. The model was modified from the Failure Mode and Effect Analysis (FMEA) and House of Quality (HOQ). FMEA was instrumental for quantifying risk and HOQ was used to prioritize risk agents which should be addressed first and choose the most effective measures to reduce the risk potential posed by the risk agents.
Simulation has also been used to assess and model risk in a supply chain. Tuncel and Alpan (2010) presented a methodology to model and analyze risk in supply chain network. The methodology combines discrete-event simulation based Petri Nets and FMECA. Petri Nets was used to evaluate the performance and manage risk in supply chain network. The risks within supply chain network were identified and assessed in FMECA. FMECA was also used to prioritize the risk which require mitigation strategy consideration. The methodology was proven as a useful instrument in managing risk in supply chain. However, it was incapable to assist the decision maker in selecting the appropriate risk mitigation under specific operational conditions of each system. The authors suggest that the future research should develops the procedures to determine mitigation strategy so the decision maker can carry out the evaluation under their own operation conditions.
Vilko and Hallikas (2012) conducted a study to present a risk assessment in multimodal supply chain. They examined the supply chain of fishery products in the Gulf of Finland due to its extremely important role in terms of continuity supply of fishery commodities in Finland. Risk identification was done qualitatively through interview with stakeholders within the supply chain. The authors used Monte Carlo to assess the effect of risk events against time delay.
Ghadge, et al. (2013) proposed a holistic and systematic quantitative risk assessment approach. The proposed approach was developed to measure overall risk behavior by combining statistical methods and system dynamic. Statistical methods used to assess risk behavior and system dynamic used to explore the performance of risks. The risks were classified based on
1030
multi-dimensional causal relationship within the Process – Organization – Location – Data – Application – Technology (POLDAT) terminology. This study assumed that the risk events occur only once, despite the fact that the impact of risk could propagate overtime in varying degree. Since this study focused on risk assessment phase, the authors suggest that behavioral rationale in risk mitigation decision making can be considered in the upcoming study.
3. PROPOSED FRAMEWORK
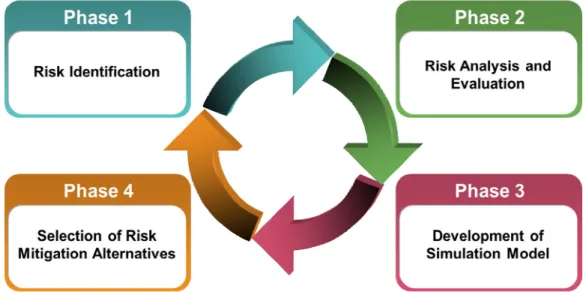
Our proposed framework consists of four phases, namely risk identification, risk analysis and evaluation, development of simulation model, dan selection of risk mitigation alternatives. We adapt FMECA to identify and assess risk events in the first and second phase. Then we model the critical risk events and simulate them based on system dynamic simulation approach.
3.1 Phase 1 Risk Identification
Risk identification is an initial phase in risk management process. The aim of this process is to collect all risks that could inhibit the goals and objectives of supply chain. In such a case, it is necessary to identify risk indications, risk causes, and risk impacts. Risk identification can use solely one approach or combination of approaches, i.e. listing approach, taxonomy-based approach, scenario analysis, and risk mapping. Each approach has a certain advantages and disadvantages. The usage is highly dependent on the intuition, expert experience, as well as the availability of data from previous events. Our proposed framework incorporates the risk identification techniques of FMECA and brainstorming involving the stakeholders who have the capability in supply chain risk management.
3.2 Phase 2 Risk Analysis and Evaluation
FMEA/FMECA is a well-known method in risk assessment (Vanany, et al., 2009; Segismundo and Miguel, 2008). In this paper, we use FMECA to determine the level of probability, impact, and criticality of each risk event. Our proposed framework prioritize risk events through the calculation of Risk Priority Number (RPN). RPN is a product of multiplication between severity index (S), occurrence rate (O), and the degree of difficulty in performing risk detection, called as detection score (D). Finally, the RPN will be compared with the threshold of risk tolerance set by stakeholders within the supply chain.
3.3 Phase 3 Development of Simulation Model
The third phase in the proposed framework is the development of simulation model towards critical risks. In this case, risk reduction strategy can be adapted to reduce the probability of risk occurrence and/or reduce the severity of risk impact. The crucial part in this phase is the integration of FMECA and system dynamic simulation. Firstly, we conceptualize the causal relationships between variables inside our observed system into the causal loop diagram. These variables are obtained from the outcome of FMECA, namely the variable of risk causes, risk events, and risk impacts.
Causal loop diagram should be easy to understand and adequate to present the decision variable and response variable. These variables will be formulated mathematical equation in the next step. Risk impact, as the output of the modeled system, used for evaluating the system performance and mapped into causal loop diagram. We can set the parameter which is able to measure the desired output.
Although a causal loop diagram is able to describe the relationship between variables in the developed model, however it must be converted into mathematical formulation within stock and
1031
flow diagram so it can be simulated. The next step is to verify and validate the stock and flow diagram to ensure that the model does not contain any errors and it represents the real system appropriately.
Figure 1. Proposed Framework
After the model has been verified and validated, it can proceed to simulation process. In risk management context, we run the model to see how often the frequency of risk occurrence and how severe the risk impact. Through the output of existing system simulation, risk mitigation alternatives can be developed which aimed to reduce risk to an acceptable threshold by supply chain stakeholders.
3.4 Phase 4 Selection of Risk Mitigation Alternatives
The last phase of the proposed framework is the selection of risk mitigation alternatives. This phase begins with the identification of risk mitigation alternatives. The identification is directed to generate mitigation alternatives which can be implemented, effective, and efficient. Mitigation alternatives should be linear with the risk causes and detection efforts as the result of risk analysis and evaluation using FMECA.
After we identify the risk mitigation alternatives, then we can simulate them to see the magnitude of risk reduction which can be obtained as well as the additional benefits or the opportunities created. The simulation output of risk mitigation alternatives will be compared with the simulation output of existing condition. Through the simulation of mitigation alternatives, we can decide alternatives which could provide the best outcome. Nevertheless, the selection of mitigation strategies should also consider how the implementation of risk mitigation will affect other stakeholders. Therefore, it is necessary to organize a further communication and coordination with relevant parties to ensure that the implemented mitigation will not become a new risk source for other partners in supply chain.
1032
4. CASE STUDY
We tested the proposed framework to the largest cement company in Indonesia. The company has three subsidiaries so the company is able to supply the cement demand throughout the country. The aggregate installed capacity of the three subsidiaries is 29 million tons per year. Supported by thousands of distributors, sub distributors, and retailers, the company acquires approximately 42% of domestic market share. Most of the information presented in this case study has been based on company reports, in-depth interview, brainstorming, and questionnaires to relevant bureau and departments.
4.1 Phase 1 Risk Identification
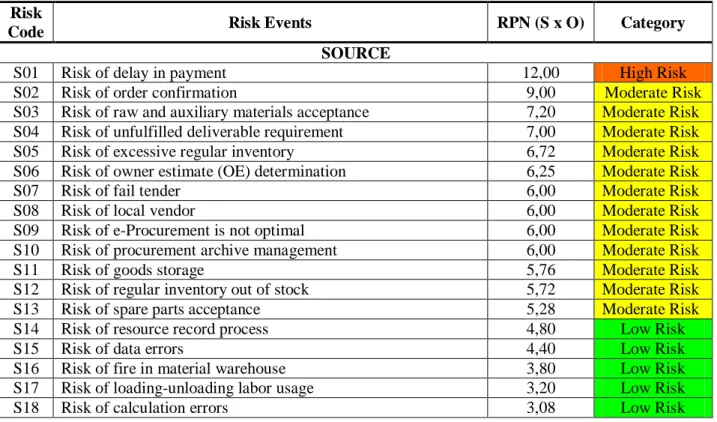
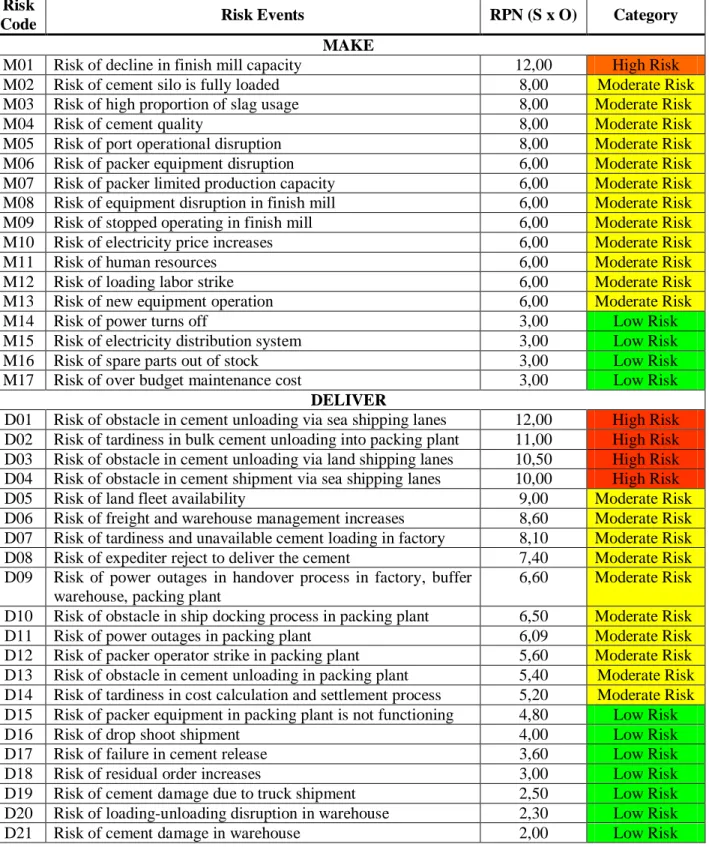
The risk events were identified based on the breakdown of supply chain business process, namely source, make, and deliver processes. The company had been documented the risk events into an annual risk assessment report which categorized based on department and bureau within the company. We sorted these risk events into source, make, and deliver classification. Overall, we obtained 56 risk events which classified as 18 source risks, 17 make risks, and 21 deliver risks as presented in Table 1.
4.2 Phase 2 Risk Analysis and Evaluation
We performed the assessment against the occurrence rate (O) of risk events and the severity index (S) of risk impacts. Based on the assessment result, the RPN can be calculated by multiplying S and O. RPN used as the basis to decide which risk events were to be dealt first. We did classification of the risk events into extreme risk, high risk, moderate risk, and low risk according to their RPN as can be seen in Table 1.
Table 1. Risk Identification and Analysis
Risk
Code Risk Events RPN (S x O) Category
SOURCE
S01 Risk of delay in payment 12,00 High Risk
S02 Risk of order confirmation 9,00 Moderate Risk
S03 Risk of raw and auxiliary materials acceptance 7,20 Moderate Risk S04 Risk of unfulfilled deliverable requirement 7,00 Moderate Risk S05 Risk of excessive regular inventory 6,72 Moderate Risk S06 Risk of owner estimate (OE) determination 6,25 Moderate Risk
S07 Risk of fail tender 6,00 Moderate Risk
S08 Risk of local vendor 6,00 Moderate Risk
S09 Risk of e-Procurement is not optimal 6,00 Moderate Risk S10 Risk of procurement archive management 6,00 Moderate Risk
S11 Risk of goods storage 5,76 Moderate Risk
S12 Risk of regular inventory out of stock 5,72 Moderate Risk
S13 Risk of spare parts acceptance 5,28 Moderate Risk
S14 Risk of resource record process 4,80 Low Risk
S15 Risk of data errors 4,40 Low Risk
S16 Risk of fire in material warehouse 3,80 Low Risk
S17 Risk of loading-unloading labor usage 3,20 Low Risk
1033
Table 1. Risk Identification and Analysis
Risk
Code Risk Events RPN (S x O) Category
MAKE
M01 Risk of decline in finish mill capacity 12,00 High Risk M02 Risk of cement silo is fully loaded 8,00 Moderate Risk M03 Risk of high proportion of slag usage 8,00 Moderate Risk
M04 Risk of cement quality 8,00 Moderate Risk
M05 Risk of port operational disruption 8,00 Moderate Risk M06 Risk of packer equipment disruption 6,00 Moderate Risk M07 Risk of packer limited production capacity 6,00 Moderate Risk M08 Risk of equipment disruption in finish mill 6,00 Moderate Risk M09 Risk of stopped operating in finish mill 6,00 Moderate Risk M10 Risk of electricity price increases 6,00 Moderate Risk
M11 Risk of human resources 6,00 Moderate Risk
M12 Risk of loading labor strike 6,00 Moderate Risk
M13 Risk of new equipment operation 6,00 Moderate Risk
M14 Risk of power turns off 3,00 Low Risk
M15 Risk of electricity distribution system 3,00 Low Risk
M16 Risk of spare parts out of stock 3,00 Low Risk
M17 Risk of over budget maintenance cost 3,00 Low Risk DELIVER
D01 Risk of obstacle in cement unloading via sea shipping lanes 12,00 High Risk D02 Risk of tardiness in bulk cement unloading into packing plant 11,00 High Risk D03 Risk of obstacle in cement unloading via land shipping lanes 10,50 High Risk D04 Risk of obstacle in cement shipment via sea shipping lanes 10,00 High Risk D05 Risk of land fleet availability 9,00 Moderate Risk D06 Risk of freight and warehouse management increases 8,60 Moderate Risk D07 Risk of tardiness and unavailable cement loading in factory 8,10 Moderate Risk D08 Risk of expediter reject to deliver the cement 7,40 Moderate Risk D09 Risk of power outages in handover process in factory, buffer
warehouse, packing plant
6,60 Moderate Risk
D10 Risk of obstacle in ship docking process in packing plant 6,50 Moderate Risk D11 Risk of power outages in packing plant 6,09 Moderate Risk D12 Risk of packer operator strike in packing plant 5,60 Moderate Risk D13 Risk of obstacle in cement unloading in packing plant 5,40 Moderate Risk D14 Risk of tardiness in cost calculation and settlement process 5,20 Moderate Risk D15 Risk of packer equipment in packing plant is not functioning 4,80 Low Risk
D16 Risk of drop shoot shipment 4,00 Low Risk
D17 Risk of failure in cement release 3,60 Low Risk
D18 Risk of residual order increases 3,00 Low Risk
D19 Risk of cement damage due to truck shipment 2,50 Low Risk D20 Risk of loading-unloading disruption in warehouse 2,30 Low Risk
D21 Risk of cement damage in warehouse 2,00 Low Risk
The next step was the criticality analysis to provide an assessment towards the ability of the company in detecting the emergence of risk events. This was accomplished through an expert judgment which directed to the Head of Risk Management Bureau of the company. By combining
1034
the detection score (D) with the severity index (S) and occurrence rate (O), the new RPN can be calculated which depicted in Table 2.
From the six risk events which classified as high risk, four of them were risks associated with delivery activities, namely D01, D02, D03, and D04. Moreover, we suspected that the risk events tend to have connection each other. Consequently, we developed a model to accommodate these four risk events and simulate it in the next phase.
Table 2. Recalculation of RPN
Risk
Code Risk Events S O D RPN
S01 Risk of delay in payment 4,00 3,00 3,00 36,00 M01 Risk of decline in finish mill capacity 3,00 4,00 3,00 36,00 D01 Risk of obstacle in cement unloading via sea
shipping lanes 4,00 3,00 2,00 24,00
D02 Risk of tardiness in bulk cement unloading
into packing plant 2,00 5,50 3,00 33,00 D03 Risk of obstacle in cement unloading via
land shipping lanes 3,00 3,50 4,00 42,00 D04 Risk of obstacle in cement shipment via sea
shipping lanes 3,00 3,30 3,00 29,70
4.3 Phase 3 Development of Simulation Model
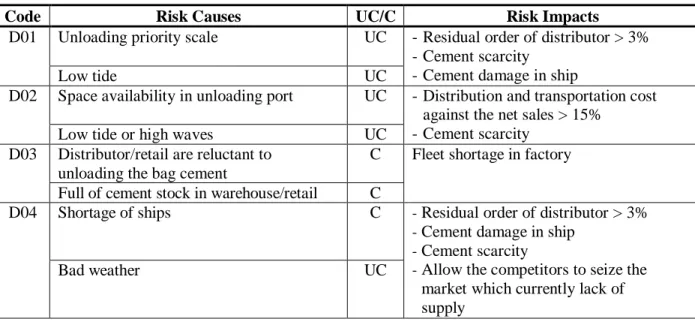
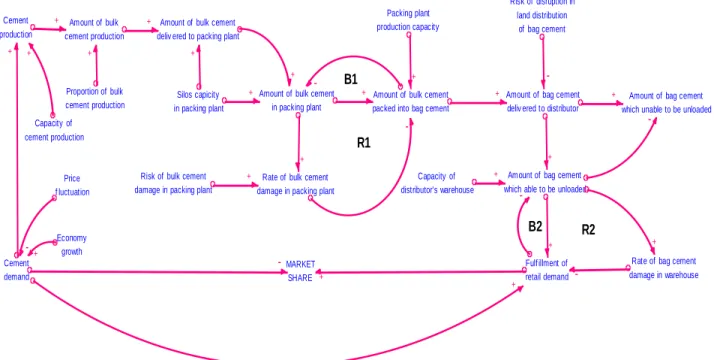
The critical risk events which require further treatment had been determined based on the result of second phase. We performed the model conceptualization which derived from the outcome of FMECA. The variable of risk causes, controllability, and risk impacts shown in Table 3. Furthermore, we identified the relationships and linkages between variables as described in a causal loop diagram in Figure 2. From Figure 2, it can be seen that there were two positive loops (R1 and R2) and two negative loops (B1 and B2). In accordance to the number of positive and negative loops, the system tends to fluctuate because both loops attempting to balance each other.
Table 3. Risk Causes, Controllability of Risk Causes, and Risk Impacts
Code Risk Causes UC/C Risk Impacts
D01 Unloading priority scale UC -Residual order of distributor > 3% -Cement scarcity
-Cement damage in ship
Low tide UC
D02 Space availability in unloading port UC -Distribution and transportation cost against the net sales > 15%
-Cement scarcity
Low tide or high waves UC
D03 Distributor/retail are reluctant to unloading the bag cement
C Fleet shortage in factory
Full of cement stock in warehouse/retail C
D04 Shortage of ships C - Residual order of distributor > 3%
- Cement damage in ship
- Cement scarcity
- Allow the competitors to seize the market which currently lack of supply
1035
Causal loop diagram was then converted into stock and flow diagram which contain a more detailed description of the observed system. Within stock and flow diagram the effect of time towards the relationships between variables was examined. This had been done through the separation of variables into level and rate category. In depicting stock and flow diagram, variables were categorized into several sub models, namely factory, packing plant, distributor, and retail. The categorization of variables were based on stakeholders and the flow of cement product within the supply chain.
Cement production Amount of bulk cement production Proportion of bulk cement production
Amount of bulk cement deliv ered to packing plant
Silos capicity in packing plant
Amount of bulk cement in packing plant Capacity of
cement production
Rate of bulk cement damage in packing plant Risk of bulk cement
damage in packing plant
Amount of bulk cement packed into bag cement
Packing plant production capacity Cement demand Price f luctuation Economy growth
Amount of bag cement deliv ered to distributor Risk of disruption in
land distribution of bag cement
Amount of bag cement which unable to be unloaded
Amount of bag cement which able to be unloaded Capacity of distributor's warehouse Fulf illment of retail demand MARKET SHARE
Rate of bag cement damage in warehouse + + + + + + + + + + + -+ -+ + -+ + + -+ -+ + + -B1 B2 R1 R2
Figure 2. Causal Loop Diagram
After formulated all required variables into mathematical formulation within stock and flow diagram, we performed the verification and validation against the developed model. We verified the model to check whether there were errors in equation and unit within the model. In addition, the model must be validated to compare the system behavior in real condition and simulation. The error rate of the entire sub models were less than 0.1. Hence, we conclude that the model was able to represent the behavior of the real system. Once the model passed the verification and validation test, we can proceed to the simulation process.
In this simulation, the response variables were the bulk cement which cannot be transported to the packing plant and bag cement which cannot be unloaded in distributor’s warehouse. The result show that there were 459,288.01 tons of bulk cement which cannot be transported at the end of the simulation period. Whereas it revealed that there were 5.293.335 sacks of bag cement which cannot be unloaded. These results were used as the basis to assess the effectiveness of risk mitigation alternatives. The focus of simulation towards the risk mitigation alternatives was to obtain an effective mitigation measures to reduce the probability of risk occurrence and the severity of risk impact.
1036
4.4 Phase 4 Selection of Risk Mitigation Alternatives
We had identified that the simulation of risk mitigation alternatives was able to be conducted towards risk of obstacle in unloading the bulk cement to the packing plant (D02) and risk of obstacle in unloading the land shipment of bag cement (D03). We picked D02 and D03 according to the result of FMECA and the discussion with the representative of transportation and distribution division of the company. Due to the controllable nature of the risk causes of D02 and D03, we were able to develop risk mitigation alternative to overcome them.
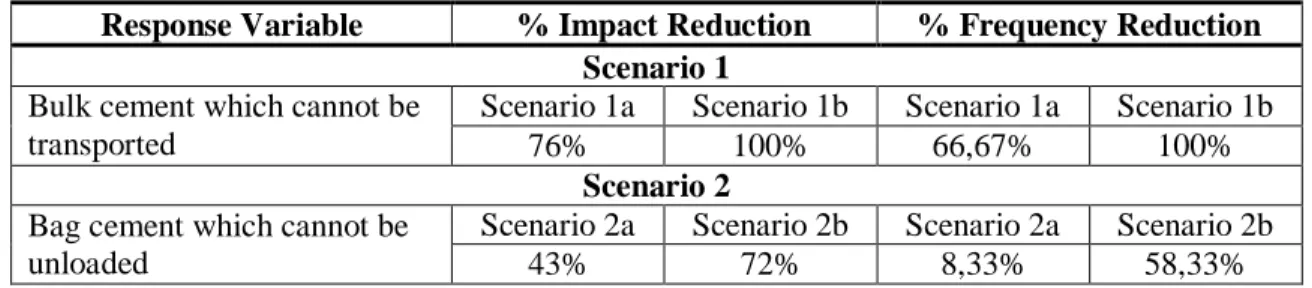
We had simulated two types of mitigation alternative, namely scheduling the frequency of bulk cement shipment to the packing plant (first scenario) and increasing the capacity of distributor’s warehouse (second scenario). The purpose of the first scenario was to simulate the increasing frequency of bulk cement shipment from factory to the packing plant using ship as the transportation mode. This scenario was intended to avoid scarcity of cement in potential marketing areas such as West Java, Banten, and Jakarta. The control variable was the frequency of bulk cement shipment. We changed the value of shipment frequency into 6 times/month (scenario 1a) and 8 times/month (scenario 1b). The aim of the second simulation was to minimize the amount of unloading bag cement due to the limited storage capacity of distributor’s warehouse. The second scenario simulated the variable of warehouse capacity as the control variable, which its value was changed to 1,900,000 sacks (scenario 2a) and 2,000,000 sacks (scenario 2b). The result of first and second scenario simulation are presented in Table 4.
Table 4. Result of First and Second Scenario Simulation
Response Variable % Impact Reduction % Frequency Reduction Scenario 1
Bulk cement which cannot be transported
Scenario 1a Scenario 1b Scenario 1a Scenario 1b
76% 100% 66,67% 100%
Scenario 2 Bag cement which cannot be
unloaded
Scenario 2a Scenario 2b Scenario 2a Scenario 2b
43% 72% 8,33% 58,33%
Table 5 provides the comparison between the first and second scenario in terms of market share. As can be seen from Table 5, the best risk mitigation alternative is scenario 2b. Through scenario 2b, the company could increase the market share by 10% and will be able to dominate the market with a percentage of 21.3192% in West Java, Banten, and Jakarta.
Table 5. Comparison between First and Second Scenario
Risk Mitigation Scenario Market Share (%) Percentage of Increased Market Share Scenario 1a 19,2764 0% Scenario 1b 19,2764 0% Scenario 2a 20,2988 5% Scenario 2b 21,3192 10%
1037
5. CONCLUSION
We developed a proposed framework for the decision-making of supply chain risk mitigation strategies through the integration of FMECA method and system dynamic simulation. We had identified, analyzed, and evaluated risk events to determine which critical events should be given priority of its mitigation actions. System dynamic simulation was utilized to model and simulate the critical risk events within the existing system to investigate the frequency of risk occurrence and risk impacts. Furthermore, we simulate the effectiveness of mitigation alternatives in reducing risk events to the tolerable threshold. The selected mitigation alternative was the best option relative to a particular response variable.
The excellence of our proposed framework lies in its ability to design and specify the simulation parameter appropriately. Through the proposed framework, the decision maker can easily analyze the impact of mitigation strategy towards the risk events, in terms of risk occurrence frequency and risk impact. Moreover, sensitivity analysis can also be conducted against the risk mitigation alternatives to estimate the limit where the alternative is still feasible and effective to be implemented.
This paper has successfully demonstrate that the integration of FMECA and system dynamic simulation is capable to generate the new instrument to evaluate the alternative of risk mitigation strategies for the risk events which classified as high risk category. However, in this paper, the emergence of risk event and its treatment efforts were considered mutually exclusive. In performing case study, each risk event only reduced by a single risk mitigation strategy, vice versa. Therefore, we suggest that the future research may use the combination of mitigation strategy to simulate risk mitigation alternatives. In addition, the proposed framework can also be tested to simulate more complex risk mitigation scenario which involving more control and response variables.
6. REFERENCES
Behdani, B., (2013). Handling Disruptions in Supply Chains: An Integrated Framework and an Agent-based Model, Thesis Ph.D., Sharif University of Technology, Iran.
Carvalho, H., Barroso, A. P., Machado, V. H., Azevedo, S., & Cruz-Machado, V. (2012). Supply chain redesign for resilience using simulation. Computers and Industrial Engineering 62, 329-341.
Dani, S. (2009), Predicting and managing supply chain risks, in G. A. Zsidisin & B. Ritchie (eds.), Supply chain risk: A handbook of assessment, management, and performance, Springer, New York, USA. Ghadge, A., Dani, S., & Kalawsky, R. (2012). Supply chain risk management: Present and future scope.
International Journal of Logistics Management 23 (3), 313-339.
Ghadge, A., Dani, S., Chester, M., & Kalawsky, R. (2013). A system approach for modelling supply chain risks. Supply Chain Management: An International Journal 18 (5), 523-538.
Han, M., Chen, J. (2007). Managing operational risk in supply chain. Wireless Communication, Networking, and Mobile Computing International Conference, 4919-4922.
Henke, M. (2009), Enterprise and supply risk management, in G. A. Zsidisin & B. Ritchie (eds.), Supply chain risk: A handbook of assessment, management, and performance, Springer, New York, USA. Jain, J., Dangayach, G. S., Agarwal, G., & Banerjee, S. (2010). Supply chain management: Literature
review and some issues. Journal of Studies on Manufacturing 1 (1), 11-25.
Khan, O., Burnes, B. (2007). Risk and supply chain management: Creating a research agenda. The International Journal of Logistics Management 18 (2), 197-216.
Lavastre, O., Gunasekaran, A., & Spalanzani, A. (2012). Supply chain risk management in French companies. Decision Support Systems 52, 828-838.
Mullai, A. (2009), Risk management system: A conceptual model, in G. A. Zsidisin & B. Ritchie (eds.), Supply chain risk: A handbook of assessment, management, and performance, Springer, New York, USA.
1038
Pujawan, I N., Geraldin, L. H. (2009). House of Risk: A model for proactive supply chain risk management. Business Process Management Journal 15 (6), 953-967.
Segismundo, A., Miguel, P. A. C. (2008). Failure Mode and Effects Analysis (FMEA) in the context of risk management in new product development: A case study in an automotive company. International Journal of Quality & Reliability Management 25 (9), 899-912.
Shukla, R. K., Dixit, G., & Agarwal, A. (2011). Understanding of supply chain: A literature review. International Journal of Engineering and Technology 3 (3), 2059-2072.
Singhal, P., Agarwal, G., & Mittal, M. L. (2011). Supply chain risk management: Review, classification, and future research directions. International Journal of Business Science and Applied Management 6 (3), 15-42.
Trkman, P., McCormack, K. (2009). Supply chain risk in turbulent environments: A conceptual model for managing supply chain network risk. International Journal of Production Economics 119, 247-258. Tuncel, G., Alpan, G. (2010). Risk assessment and management for supply chain networks: A case study.
Computers in Industry 61, 250-259.
Vanany, I., Zailani, S., & Pujawan, N. (2009). Supply chain risk management: Literature review and future research. International Journal of Information Systems and Supply Chain Management 2 (1), 16-33. Vilko, J. P. P., Hallikas, J. M. (2012). Risk assessment in multimodal supply chains. International Journal
of Production Economics 140, 586-595.
Zegordi, S. H., Davarzani, H. (2012). Developing a supply chain disruption analysis model: Application of colored Petri-Nets. Expert Systems with Applications 39, 2102-2111.