Accredited by RISTEKDIKTI, Decree No: 32a/E/KPT/2017
doi: 10.14203/jet.v19.83-90
A Simple Real-Time Energy Analytics Model for Smart
Building Using Open IoT Platforms
Muhammad Nasar
a, *, Novendra Setyawan
a, Amrul Faruq
a, Indah Sulistiyowati
b a Department of Electrical EngineeringUniversity of Muhammadiyah Malang Jl. Raya Tlogomas 246
Malang, Indonesia
b Department of Electrical Engineering
University of Muhammadiyah Sidoarjo Jl. Raya Gelam 250
Sidoarjo, Indonesia
Abstract
Monitoring energy in buildings can ease us to have a better understanding of electricity consumption patterns to support efficiency and avoid potential damages. However, indoor installations are mostly unmonitored because their panel meters are usually difficult to access. Yet, indoor maintenance tends to be more difficult since the cables are inside the wall, ceiling, or concrete. Internet of Things and big data analytics can be used to track electricity usage either in residential, commercial, or industrial buildings. This paper presents how a simple real-time energy data analytics was built at a low cost and high accuracy to inspect energy fluctuations, anomaly, and its significant pattern. We proposed 3 layers of architecture namely acquisition, transportation, and application management. An electronic module named PZEM004T was used to sense voltage, current, and other electrical parameters. Through a microcontroller ESP8266, the data was processed and sent it to an application layer via an existing wireless network. The actual and historical data of electricity were visualized on high-resolution graphs. The experiment was conducted at our office building. The experimental results showed that data of electrical energy usage can be captured close to real-time and power anomaly and pattern can be figured. Performance and functionality testing showed acceptable use of this system with more than 99% accuracy. This system is intended to empower building managers in evaluating the electrical network balance as well as anticipating damage due to overload, overvoltage, and voltage drop. If this model is widely implemented it will produce big data that is useful for advanced analysis.
Keywords: Energy data analytics, energy management, Internet of Things, smart building.
I. INTRODUCTION
Monitoring electricity in buildings is crucial as it takes a dominant portion (73%) of final energy world usage in the form of electricity [1]-[2]. In Europe alone, residential, tertiary, and commercial building sector is responsible for over 50% of the electricity consumption [3]. Yet, most people currently spend 90% of their time indoors relying on electricity for most of their activities such as lighting and air conditioning for room comfort [4]. This leads buildings becoming the largest energy consumers worldwide and motivates people to find accurate and easy ways to monitor and control their electricity. The efficacy of monitoring actual electricity load in buildings not only provides convenience in controlling energy savings but also able to accurately manage load balancing to avoid outage and further damages as power overload, over or under voltage are still common problems on the consumers’ side [5], [6]. If this occurs for a long time, it may potentially damage not only the network installation itself but also consumer
equipment or even building fire. Unfortunately, most electricity networks in buildings cannot be easily monitored because the power company provides kWh meters only at the main connection, and the data is difficult to access [7]. These make it harder for building managers to conduct energy evaluations while repairing indoor electrical installations tends to be more difficult since cables are often covered with ceiling, wall, or concrete.
In a smart building perspective, buildings should be able to self-regulate their energy footprint to reduce overall energy consumption and peak power usage, while better aligning consumption with a renewable generation [3]. The recent development of Information and Communication Technology (ICT) especially the Internet of Things (IoT) makes the electricity either at residential, commercial, or industrial buildings possible to be tracked [8], [9] with higher data resolution in real-time at low cost. Big Data Analytics helps to analyze large scale data collected from IoT sensors to give more insightful information on what was, is, or will be happening [10]. This article aims to show how a simple, real-time, and high-resolution energy monitoring and analytics using open IoT platforms is constructed as a monitoring model for smart buildings. This model should be able to visualize either short or long term fluctuation
* Corresponding Author.
Email: [email protected]
of loads, voltage, current, frequency, and apparent and real power as they are common abnormality of electrical AC building’s installation especially in Indonesia [6] and therefore energy savings can be controlled, and potential failure and damages can be anticipated.
Researchers have developed numerous approaches to enable fine-grain tracking of electric usage for buildings. The top motivation of those studies is to support the energy conservation program planned by most countries including Indonesia by enabling smart grids [11]-[13]. Smart grids functionality enables consumers to produce their own electricity using renewable resources and sell it back to the power company using the same power line [14]. C. Choi, et al. [15] proposed the construction of an effective energy monitoring system based on open IoT hardware and software platforms that can evaluate the consumer’s energy habits as well as forecast energy demand. However, the study did not focus on detailing indoor energy use. Instead, it was focused more on LoRa technology as a method of supporting long-distance data communication networks to reach wider outdoor areas. In addition, it also did not discuss how the energy data is acquired and how power outlier inside the wiring installation is detected as they focus more on renewable energy generation facilities, consumer demand patterns, and pricing prediction.
D. Risqiwati, et al. [16] proposed a prepaid electricity metering system to collect energy data and put it online. The system used ACS712-20A to acquire electricity current from the 220VAC power grid. A microcontroller Arduino Uno was used to convert analog energy data from the current sensor into digital format. This data is captured every 3 minutes and sent it to a web server through a core computer network and the users could monitor their energy usage on the web. However, there are some shortcomings to this study in order to provide more accurate monitoring. First, the energy data sensed was only current while it indeed requires more variables like voltage, frequency, and power factor metrics. Secondly, since the data were collected in 3-minute intervals, there is much more information lost during the intervals which were not monitored. Additionally, the average error measurement of the current data sampling was more than 25%, which was a significant accuracy issue.
Similarly, A.R. Al-Ali, et al. [10] emphasized the scalability of IoT based energy data collection from houses using MQTT protocol. The researcher used Business Intelligence (BI) system to generate insightful information for analytics. This analytical system generates information and classifies it into four different stakeholder levels namely homeowner, community representative, state representative, and country
representative. Security and data privacy issues were protected using https and encrypted authentication. This was comprehensive research, however, the area of how electricity metrics namely voltage, current, frequency, and power factor are monitored in real-time and high resolution remains unclear. On the other hand, D. Irwin, et al. [2] explored home automation (HA) protocols optimization for load monitoring in smart buildings.
They assumed that one of the typical issues on HA was bandwidth. They evaluated two HA protocols namely X10 and Insteon Powerline protocol that was designed explicitly for remote load control for collecting data from sensor networks. Their experiment found that although both protocols have extreme bandwidth limitations, Insteon is generally more reliable than X10. To make the sensor networks more reliable, a smart pooling system using the round-robin method has been adopted. This shows that their study was emphasized on link layer protocol for handling data collection and query in that extremely limited bandwidth network. Furthermore, although accurate real-time information about various characteristics like occupancy, lighting, temperature and power consumption at the different levels of granularity have been modeled, none of the power quality issues in buildings was discussed.
These literature reviews indicate there is a need for simple and accurate real-time electricity monitoring in buildings that enables building managers to evaluate energy consumption thoroughly. A clear example of this need is if a user requests to operate certain equipment, the building manager can assure whether the building has the capacity to fit and service it and that the building operation will not have any negative impacts on other sensitive equipment [17]. This can be achieved through a granular electricity analytics system that will be discussed further in this paper. This system can be developed to support advanced analytics either descriptive, predictive, or prescriptive analytics of energy in modern buildings including operation abnormality. The data collected can also be used to develop predictive models of the power quality either in the power generation side, transmitter, or consumer, with the aim of more rapid product quality assessment.
II. PROPOSED METHOD
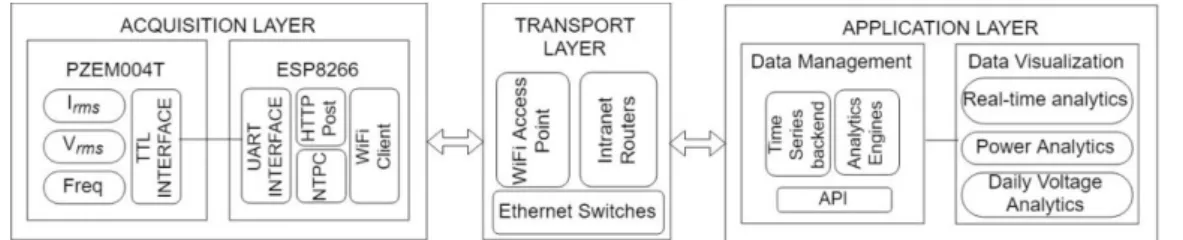
The proposed architecture of this real-time energy analytics system is divided into three main layers: acquisition, transport, and application layer. The acquisition layer consists of sensors and a node as a data processor to collect and send electrical data. This data was sent to an application layer through a local area network called the transport layer. The detailed function of how each part works is illustrated in Figure 1.
A. Acquisition Layer
To validate the proposed architecture, a prototype was designed, build, and tested. We built the acquisition using microcontroller ESP8266, put it inside the MCB of our building, and connect it via WiFi to a server located at our local campus building. This layer consists of two main components: sensors and a data processor. Because the aim is to acquire building electricity data supplied from the 220 VAC 50Hz national grid, these sensors
should be able to determine the root mean square (RMS) of voltage (𝑉𝑟𝑚𝑠), current (𝐼𝑟𝑚𝑠), and AC frequency (Hz). Having these basic properties, other derivative parameters such as apparent power (VA), real power (W), and power factor (PF) can be calculated [13], [18]. The apparent power which is the trigonometric results of active and reactive power is given in equation (1) while the real power is in equation (2).
𝑉𝐴 = 𝑉𝑟𝑚𝑠 . 𝐼𝑟𝑚𝑠 (1)
𝑊 = 𝑉𝐴 . 𝑃𝐹 (2)
1) Sensors
In this research, we used PZEM004T-100A capable of sensing voltage, current, active power, total energy, frequency, and power factor. Using systems-on-chip (SoC) SD3004 electric energy measurement with built-in MCU, PZEM004T can be operated at voltages from 80 to 260 V, current up to 100 A, AC frequency from 45 to 65 Hz, as well as power factor (PF) from 0 to 1 [19]. This device is attached to the MCB panel of our building. The acquisition steps are as follows.
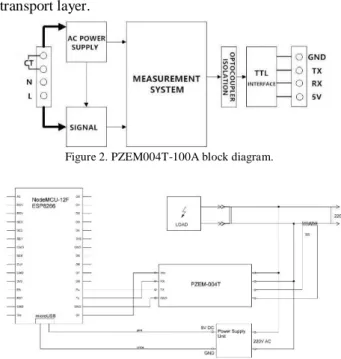
First, signals of RMS voltage, RMS current, and frequency are read by signaling block. The measurement block is analyzing these signals, then it is able to determine the value of VA, PF, and W. The values are stored in 8-bit registers and retrieved through the TTL interface at 9600 bps speed in every 1000 ms. An optocoupler is used to isolate the measurement circuit (220 VAC) from hazarding the TTL circuit (5 VDC). The
block diagram of the device is shown in Figure 2.
2) Microcontroller
Secondly, a low-cost microcontroller ESP8266 is used to regularly acquire the data from the TTL interface before transmitting it to the application layer. This microcontroller is an open-source platform for IoT prototyping with an integrated WiFi module. Moreover, this microcontroller unit can be programmed via the Arduino IDE [13]. Open-Source library code of PZEM004T Power and Energy meter needs to be compiled and installed on the ESP8266. This code is free and downloadable at Github online repository. The wiring diagram of this acquisition block is illustrated in Figure 3. To prepare data to be ready to transport in nearly real-time and fully automatic without human intervention, we developed a private API that works in machine-to-machine (M2M) communication mode over hypertext transfer protocol (HTTP). At the client-side, the ESP8266 employs the HTTPClient Arduino library to work with the API using the HTTP Post method. The API is written in PHP language and run it on an Apache webserver. This will be described in the application layer section. At the end of this layer, WiFi client mode in the
ESP8266 is activated to enable data transfer to the transport layer.
Figure 2. PZEM004T-100A block diagram.
Figure 3. Wiring diagram of acquisition layer.
B. Transport Layer
Third, the transport layer is needed to carry data from the acquisition block to its application. In this research, we used our existing IP based intranet campus infrastructure where human users also use it simultaneously for internet access (H2M or H2H). We assume every modern building today has this network infrastructure. The network may consist of some segments and various physical layers, but our system involves only two network segments where the ESP8266 is connected to WiFi infrastructure routed with an Ethernet network before reaching the server at the application layer. Figure 4 illustrates the topology.
C. Application Layer
Finally, to get actionable information the energy data harvested from the acquisition layer is processed in the application layer. An Ubuntu Linux operating system is used for running an Apache web server and MySQL relational database engine. On top of the webserver, we run an analytics system of real-time energy data using ChartJS visualization. PHP software is used to compute the energy data within the program. In this experiment, PHP roles two functions, carrying data from the API to the database, and processing or computing data from the database to the visualization system interface.
1) Database and Data Structure Design
The acquisition layer proceeds three different sources of energy data from three-phase electricity sensors: R, S, and T. Each sensor carries five elements of energy data namely voltage, current, watt, frequency, and power factor. The data is then stored in a database. To keep it as simple and the size as lighter as possible, we designed an SQL table shown in Figure 5. We add the other two important fields into the table named ID and reading_time. ID acts as a primary key in which 18 digits
of alphanumeric data format,
Figure 4. Transport layer topology of real-time energy data analytics.
Building_ID MCB_ID Line_ID Stored_Date Stored_Time
AA BB CC YYMMDD hhmmss
Figure 5. Eighteen digits of primary key data structure.
This code consists of four different entities. AA represents two digits of building code, BB is two digits of MCB location code, CC is two digits of electricity line code, and another YYMMDDhhmmss is 12 digits of current timestamp taken from two digits of the year, two digits of the hour, two digits of minute, and two digits of the second. This time-block indicates the timestamp of the data received by the server while the reading_time field is the timestamp of the data taken from its sensors. We then use these records to measure the performance of data transfer. The whole fragments of this key ID are described in Figure 6.
2) API Design
An application programming interface (API) is a set of functions allowing an application to store or to retrieve data to or from a system or service [20]. In IoT based applications, designing an API means providing an effective interface that enables IoT sensors to store data collected from an object to a server or maintain sensor status effectively [10]. In this study, we designed an HTTP based API that bridges the wireless sensor network at the acquisition layer to send data to the database in the application layer. To verify an authorized client, we use a key inside the API code and only if the key match the data can be stored. The key can be changed at any time. The overall process can be described in the pseudocode as depicted in Figure 7.
3) Anomaly Detection
The term anomaly in this paper is used to describe the outlier of power fluctuation data in a certain time frame. We developed an analytical module for dynamic energy anomaly detection base on the concept of Interquartile Range (IQR) as it has been used in [21] for a real-time decision-based system. IQR is calculated by sorting the data set, then finding the median, quartiles, and interquartile range. The first (Q1), second (Q2) also called median, and third quartiles (Q3) are set at 25%,
Figure 6. Database design for storing energy data.
Start
Listen to a post request
If the request method is post mode { If the API key matches {
Read energy data values;
Store the data into the
database; } } else {
No response }
End
Figure 7. The energy data API pseudocode.
50%, and 75% quartile respectively. Those below the Q1
are considered low outliers while above Q3 is high outliers. The basic formula of IQR is defined in equation (3). However, scientists have agreed that a data point is an outlier if distributed more than 1.5 IQR above the Q3 or 1.5 IQR below the Q1. Therefore, the threshold of a low outlier (LO) and a high outlier (HO) can now be derived as in equation (3) and (4) respectively [23]-[24].
𝐿𝑂 = 𝑄1 – 1.5𝐼𝑄𝑅 (4)
𝐻𝑂 = 𝑄3 + 1.5𝐼𝑄𝑅 (5)
4) Data Visualization
Data visualization is a graphical form of representing data. In this research, we show how the RMS value of voltage (𝑉𝑟𝑚𝑠), current (𝐼𝑟𝑚𝑠), power factor (𝑃𝐹), and real power (𝑊) are visualized into two different modes. Using ChartJS, an open-source JavaScript library that allows us to draw different types of charts including bars, lines, and pies on HTML5 canvas element, we made nearly real-time analytics of 𝑊, 𝑉𝑟𝑚𝑠, 𝐼𝑟𝑚𝑠, and 𝑃𝐹, refreshing them at every 20 second, shown in Figure 8. On the other hand, using descriptive analytics we also visualize hourly 𝑉𝑟𝑚𝑠 that illustrate power quality trends through voltage analysis. The maximum and minimum 𝑉𝑟𝑚𝑠 deviation of each hour is computed to see the voltage fluctuations as well as the trend of the day, as shown in Figure 9. This will be discussed further in the next section.
III. RESULT AND DISCUSSION
Sets of testing were developed to evaluate accuracy, performance, anomaly, and scalability. For this experiment, the proposed architecture based on PZEM004T sensors, an ESP8266 microcontroller, and a web server has been setup as in Figure 4. We installed the acquisition block inside the MCB box of our building, connecting it via WiFi to a server located at our local campus building.
A. Accuracy
The accuracy was tested by comparing the electrical parameter readings of voltage, current, and frequency on various static loads. A calibrated AVO meter to measure the targeted parameter was used simultaneously in comparing the PZEM004T readings. Table 1 shows both readings.
As we used the PZEM004T that has very small reading error (<0.5%) [22], table 1 proves that statement is true. The overall error was 0.12% for the voltage, 0.44% for the current, and 0% for the frequency. We did not evaluate PF since the AVO used did not have any FP meter to compare, but the reading PF values for each load were reasonable. For example, iron and rice cooker in which their equivalent circuits are purely a resistor indicated that both FP values were 1 while the refrigerator where the equivalent circuit consists of resistor, inductor, and capacitor was 0.7. These values were acceptable and consistent, and therefore the accuracy is good.
B. System Performance
The second evaluation was the performance of the system. In this model, we designed this system to be able to record both reading and storing time for each data as it has been shown in Figure 5. Reading time is the time of data opted from sensors while storing time is of the data inserted into the database. This time difference is used to measure the speed of data transfer from the acquisition
Figure 8. Nearly real-time energy data visualization.
TABLE 1
AVO VERSUS PZEM READINGS IN VARIOUS STATIC LOADS
Load Profile @220V
RMS Voltage RMS Current Frequency
PFPZEM
VAVO
(V)
VPZEM
(V)
Error (%)
IAVO
(A)
IPZEM (A) Error
(%)
fAVO
(Hz)
fPZEM
(Hz)
Error (%)
1. No Load 228.80 229.01 0.09 0.02 0.02 0 50 50 0 0
2. Iron 350W 223.30 222.90 0.18 1.62 1.63 0 50 50 0 1
3. Refrigerator 140W 227.76 227.50 0.11 0.57 0.58 1.75 50 50 0 0.7
4. Rice cooker 400W 222.00 221.77 0.10 1.89 1.89 0 50 50 0 1
Average 0.12 0.44 0
TABLE 2
THE SPEED OF READING AND STORING TIME OF DATA:
SAMPLES REPRESENT OF OFFICE-HOURS (RIGHT) AND NON-OFFICE-HOURS (LEFT)
# Read (date, time) Store (date, time) Delay
(second) # Read (date, time) Store (date, time)
Delay (second)
1 2019-09-21 21:27:59 2019-09-21 21:28:00 1 1 2019-09-22 10:34:44 2019-09-22 10:34:45 1 2 2019-09-21 21:28:10 2019-09-21 21:28:10 0 2 2019-09-22 10:34:55 2019-09-22 10:34:56 0 3 2019-09-21 21:28:20 2019-09-21 21:28:21 1 3 2019-09-22 10:35:05 2019-09-22 10:35:06 1 4 2019-09-21 21:28:31 2019-09-21 21:28:31 0 4 2019-09-22 10:35:16 2019-09-22 10:35:17 0 5 2019-09-21 21:28:41 2019-09-21 21:28:42 1 5 2019-09-22 10:35:26 2019-09-22 10:35:27 1 6 2019-09-21 21:28:52 2019-09-21 21:28:53 1 6 2019-09-22 10:35:37 2019-09-22 10:35:37 1
7 2019-09-21 21:29:02 2019-09-21 21:29:03 1 7 2019-09-22 10:35:47 2019-09-22 10:35:48 1 8 2019-09-21 21:29:13 2019-09-21 21:29:13 0 8 2019-09-22 10:35:58 2019-09-22 10:35:59 1 9 2019-09-21 21:29:23 2019-09-21 21:29:24 1 9 2019-09-22 10:36:08 2019-09-22 10:36:08 1 10 2019-09-21 21:29:34 2019-09-21 21:29:34 0 10 2019-09-22 10:36:19 2019-09-22 10:36:19 0
average 0.6 average 0.7
system performance. This measurement involves data acquisition, data transfer, and data storing time, then called processing time. We used the same NTP (Network Time Protocol) server at both layers to make sure they have exactly the same time reference. The bigger the difference, the lower the performance. Some samples of this experimental result are presented in Table 2.
The data on Table 2 showed that the processing time was fairly fast with no significant gap between the speed in office hours and non-office hours. The average speed was 0.6 seconds during non-office hours and 0.7 during office hours. These were normal because in office hours the network was much busier than non-office hours. But most importantly, there was no delay in more than 1 second, and therefore the overall performance for serving real-time monitoring system was reasonably acceptable.
C. Real-time Visualization Analytics
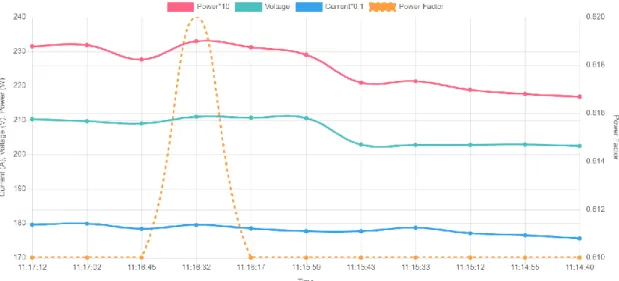
This testing was to evaluate the developed interface to monitor actual electricity condition in nearly real-time. This is mainly intended to gain situational awareness from the streaming energy data focusing on every event that matters most for making the right decision at the right time. The following experimental result was done at our ICT building and it includes voltage, current, watt, and power factor as shown in Figure 8. For convenience due to the limitation of the scale used, we grouped the voltage, current, and real power at the left axis while the right is for power factor. On the left axis, the red line that represents Watt is the multiplication result of the green and blue lines (voltage and current). Meanwhile, the right axis is used by the orange line to represent the power factor (FP). For higher scale resolution, unused number (0-169) on X-axis has been cut.
With a high-resolution graph shown in Figure 8 above, it can be seen that all parameters were fluctuating
accordingly, moving from right to left, and as a result, it might show different meanings. For example, there was a sudden increase of voltage at 11:15:59 from about 202 V to around 210 V which lead to a significant rise as well on the real power line from approximately 2.2 to 2.3kW. Referring to the normal value of our national grid voltage which is 220 V, this may mean that the grid line was just back from suffering to nearly normal. However, since the current was relatively stable (around 17.9 A), this event may probably be caused by a heavy load outside of our grid building installation. It was also interesting to note that a little increase in FP improved output power. As shown at minute 11:16:32, a little rise of PF from 0.61 to 0.62 lead significant increase in output power from around 2.31 to 2.33 kW, which was the peak of the graph. Overall, the graph presents that the trend of power consumed tended to rise slightly during the period. This phenomenon has shown that this interface was able to visualize the streaming energy data every 10-second intervals properly.
D. Anomaly Detection
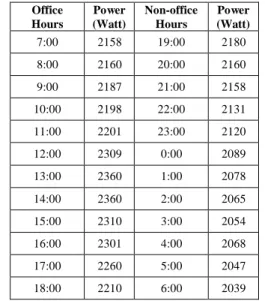
From the dynamic energy usage, we sampled two power consumption datasets namely office hours labeled as dataset 1 and non-office hours labeled as dataset 2 to evaluate their anomaly. Then we computed them based on the equation (3), (4), and (5) above. Both datasets are shown in Table 3. Featuring 12 records of the dataset with the maximum and minimum power data distribution, Pmax=2360W and Pmin=2158W of the dataset
TABLE 3
OFFICE AND NON-OFFICE HOURS POWER CONSUMPTION DATA
Office Hours
Power (Watt)
Non-office Hours
Power (Watt)
7:00 2158 19:00 2180
8:00 2160 20:00 2160
9:00 2187 21:00 2158
10:00 2198 22:00 2131
11:00 2201 23:00 2120
12:00 2309 0:00 2089
13:00 2360 1:00 2078
14:00 2360 2:00 2065
15:00 2310 3:00 2054
16:00 2301 4:00 2068
17:00 2260 5:00 2047
18:00 2210 6:00 2039
Similarly, the non-office-hours abnormality test presented IQR = 76, LO = 1949, and HO = 2251. With Pmax = 2158 W and Pmin = 2360W, this test also indicated
that the power consumption was fluctuating in the normal distribution and still far from those outlier thresholds. Referring to the features, this operation is said abnormal only if the power consumption is either below 1949 W or above 2251 W. From this experiment, although they both showed no outliers due to the similar dataset used, these have shown that evaluating power anomaly using Interquartile Range (IQR) has been done successfully. To give the overall picture, the two evaluations have been summarized in Figure 9.
E. Pattern Analytics
Another interesting feature to be discussed from this experiment was the daily trend of voltage that helps how a building manager should act. As it is generally known that good power quality can be evaluated through its voltage [23]. Depending on the grid standard, most appliances can only be working optimally if the supply given is stable and in the range of their working voltage. A sensitive appliance such as a computer may not be working or will be at high risk if working in such
fluctuating voltage. Therefore, it is crucial to keep the building manager aware of whether the voltage supplying the building is normal. Through our descriptive-analytic interface, the building managers can easily monitor the electricity supply quality in real-time as well as the daily voltage pattern. As the data keep changing, at the application layer we computed the minimum and maximum distribution of voltage each hour to be analyzed during the day. Figure 10 illustrates how the daily trend of RMS voltage of our building fluctuated.
Overall, the chart indicates that the voltage began falling from 7:00 am to 21:00 pm. During the fall period, there had been a sharp drop in voltage between 12:00 pm and 15:00 pm. The blue line presented that the deepest drop was as low as about 178V fluctuating up to about 200V to the red line. Of this circumstance, the building managers should be aware that the most critical condition was happening between 12:00 noon and 15:00 pm and the farthest deviation at 15:00 pm. This resulted in a 42- volt drop and was the worst power quality during the period. On the other hand, the red line also clearly showed that there was no voltage over 230V, meaning that the only problem was about overload but noting worried about the electricity supply of being overvoltage. By recognizing this pattern, there is a clear recommendation that the building managers should be aware of whether to avoid operating more loads or to improve the supply system to anticipate further damages. Additionally, since this system runs over the network, it can be monitored remotely as well.
F. Sensor Network Limitation
In this paper, we assumed that the local area network (LAN) that could be used to transport the sensor’s data to the application layer has existed in every building. The LANs are typically constructed of Ethernet cable connected with switches and WiFi infrastructure. However, since every acquisition layer should be attached to an MCB panel, there might be some cases where the network does not cover it. As discussed in [15], various physical layer technologies such as LoRa can be adopted to solve this problem, even though re-adjusting the acquisition interval may be required due to its bandwidth limitation.
CONCLUSION
The simple real-time energy analytics for smart building using open IoT platforms has been modeled and tested. Both accuracy and performance tests showed an acceptable result. The functionality tests of streaming, anomaly, and pattern analytics also worked as expected. Therefore, this system can be used to empower building managers or other energy stakeholders to be more knowledgeable in controlling and maintaining power quality whether onsite or online. To make it more usable, future work may be required including to develop visualization interface to be more portable as well as to use LoRa or other possible media to improve sensor network scalability if it is used in buildings where LAN coverage is still the issue. Also, the development of other energy anomaly analytics such as voltage, frequency, and power factor may be useful for advanced needs.
REFERENCES
[1] S. Barker, S. Kalra, D. Irwin, and P. Shenoy, “Empirical Characterization and Modeling, of Electrical Loads in Smart Homes,” in Proc. of IEEE International Green Computing Conference, 2013.
[2] D. Irwin, A. Wu, S. Barker, A. Mishra, P. Shenoy, and J. Albrecht, “Exploiting Home Automation Protocols for Load Monitoring in Smart Buildings,” The Third ACM Workshop on Embedded Sensing Systems for Energy-Efficiency in Buildings, 2011. [3] E. Peytchev, M. Lyaskov, K. Popovski, G. Spasov, “Home
Energy Monitoring System based on Open Source Software and Hardware,” in Proc. ofInternational Conference on Computer Systems and Technologies, 2016, pp. 145-150.
[4] X. Cao, X. Dai, J. Liu, “Building energy-consumption status worldwide and the state-of-the-art technologies for zero-energy buildings during the past decade,” Energy and buildings, 128, 198-213, 2016.
[5] I.K. Darminta, I.G.P.M.E Putra, I.N.H. Yusa, “Rancang Bangun Alat Monitoring Beban Lebih Secara Otomatis dengan SMS berbasis Mikrokontroler ATMEGA 328P,” Jurnal Logic, vol. 16, no. 3, Nov. 2016.
[6] Y. Mulyadi, L.Farida, A.G. Abdullah, K.A. Rohmah, “Anomalous STLF for Indonesia Power System using Artificial Neural Network,” in Proc. of International Conference on Science and Technology, 2015.
[7] M. Djamin, F. Armansyah, H. Hilal, N.A. Aryono, Muklis, E.S. Hariatie, S. Syafei, H.Yuniarto, Supriyadi, “Teknologi Smart Grid untuk Smart City,” BPPT, 2012.
[8] A. Zanella, N. Bui, A. Castellani, L. Vangelista, and M. Zorzi, “Internet of Things for Smart Cities,” IEEE Internet of Things Journal, vol. 1, no. 1, Feb. 2014.
[9] A. Orestis, A. Dimitrios, D. Dimitrios, and C Ioannis, “Smart Energy Monitoring and Management in Large Multi-Office Building Evironments,” in Proc. of the 17th Panhellenic Conference on Informatics, 2013, pp. 219-226.
[10] A.R. Al-Ali, I. A. Zualkernan, M. Rashid, R. Gupta, M. AliKarar, “A Smart Home Energy Management System Using IoT and Big Data Analytics Approach,” IEEE Transactions on Consumer Electronics, Vol. 63, No. 4, November 2017
[11] A. Prastawa, “Inovasi Teknologi Smart Grid,” Balai Besar Teknologi Konservasi Energi, BPPT, 2017.
[12] G. Wibisono and N. Badruzzaman, “Strategy of smart meter infrastructure implementation using LPWAN technology, pilot project PLN Bali Case Study,” MATEC Web of Conferences 218, 03013, ICIEE, 2018.
[13] T. Tantidham, S. Ngamsuriyaros, N. Tungamnuayrith, T. Nildam, K. Banthao, P. Intakot, “Energy Consumption Collection Design for Smart Building,” in 2018 International Conference on Embedded Systems and Intelligent Technology & International Conference on Information and Communication Technology for Embedded Systems (ICESIT-ICICTES), 2018, pp. 1-6.
[14] I. Colak, H. Wilkening, G. Fulli, J. Vasiljevska, F. Issi, O. Kaplan, “Analysing the Efficient Use of Energy in a Small Smart Grid System,” in International Conference on Renewable Energy Research and Applications (ICRERA), 2012.
[15] C. Choi, J. Jeong, I. Lee, W.Ki, “ILoRa based Renewable Energy Monitoring System with Open IoT Platform,” Korea Institute of Energy Technology Evaluation and Planning (KETEP), 2017. [16] D. Risqiwati, A.G. Rizal, Z. Sari, “Rancang Bangun Sistem
Monitoring Listrik Prabayar dengan Menggunakan Arduino Uno,” Kinetik, vol.1, no.2, hal. 47-54, Agustus 2016.
[17] A. Prouzeau, Dharshini.M.B, M. Balasubramaniam, “Visual Analytics for Energy Monitoring in the context of Building Management,” in 2018 International Symposium on Big Data Visual and Immersive Analytics (BDVA), 2018, pp. 1-9. [18] T. Nusa, S.R.U.A. Sompie, M. Rumbayan, “Sistem Monitoring
Konsumsi Energi Listrik Secara Real Time Berbasis Mikrokontroler,” E-journal Teknik Elektro dan Komputer, vol.4 no.5, 2015
[19] PZEM-004T V3.0 User Manual.
[20] T. Hong, W. Feng, A. Lu, J. Xia, L. Yang, Q. Shen, P. Im, M. Bhandari, “Building Energy Monitoring and Analysis,” Final Report of the Two-Year CERCBEE Energy Monitoring Project, 2013.
[21] K.D. Buch, “Decision based Non-linear Filtering using Interquartile Range Estimator for Gaussian Signals,” in Annual IEEE India Conference (INDICON), 2014.
[22] R. Khwanrit, S. Kittipiyakuly, J. Kudtongngamz, and H. Fujita, “Accuracy Comparison of Present Low-cost Current Sensors for Building Energy Monitoring,” in 2018 International Conference on Embedded Systems and Intelligent Technology & International Conference on Information and Communication Technology for Embedded Systems (ICESIT-ICICTES), 2018.
[23] S. Bhattacharyya, J. M. A. Myrzik, W. L. Kling, “Consequences of Poor Power Quality – An Overview,” in 42nd International Universities Power Engineering Conference, 2007.