130
ECONOMIC AND FINANCIAL ASPECTS OF THE ACTIVITIES SC
GOVORA VALCEA COUNTY
MEDELETE D.M., PÂNZARU R.L.
Faculty of Agriculture and Horticulture, University of Craiova
Key words: income, expenses, profit, loss structure.
ABSTRACT
The unit was established in 1990, with the object of activity "civil and industrial construction, precast and concrete" - unique registration code RO 1474711, Nr. ord. reg. com. / year: J38/231/1991.
On setting the unit had a share capital of: 1,261,590 ROL, is located in Rm, Str. Olt outlet, No.11, Block 5.
The study covers (2009-2011) period characterized by numerous changes related to specific market developments. It can be seen that the activity peaked in 2010 and then in 2011 recorded a decrease of the performance, while the 2009 indicators examined had low levels
INTRODUCTION
SC GOVORA S.A. was founded by GD. 1304 / 15.12.1990 under Law No. 15 / 08.07.1990 taking over a large part of the Ramnicu Valcea Group's assets and liabilities belonging to TAGCIND Pitesti Shipyards units that have been disbanded.
SC GOVORA S.A. is a trading company with a capital stock subscribed and paid lei 1,261,590 divided into 12,615,900 registered shares of lei 0.10 each, owned by individuals and companies.
Ownership structure SC GOVORA S.A. According to the Register of Shareholders on 01.04.2013 sent by SC Central Depository S.A. Bucharest was the following: 914 individual shareholders who owned a total of 12,457,650 shares with a nominal value of 0.10 lei, 1 shareholder legal person who owns Broadhurst Investments LIMITED Bucharest 158 250 registered shares with a nominal value of 0.10 lei .
SC GOVORA SA. has a stable shareholding, top 5 shareholders named in the articles of association and who occupy leadership positions and holds a number of 6,523,215 shares, representing a rate of 51.71% of the share capital, which ensure a balance in business activity and a certainty in continuity.
SC GOVORA SA carries out its activity with cover the quality and performance, continuous improvement of quality management being certified to current standards compatible with European standards as follows: Certification of Quality Management System according to the requirements of ISO 9001:2008 standard SREN for all areas of construction, the certificate issued nr.17/30.08.2002, certified periodically by SC CERTROM SRL.
Certified Environmental Management System according to ISO 14001:2005 standard requirements SREH for all areas of construction, the certificate issued nr.72/30.07.2008 being recertified periodically by SC CERTROM SRL.
Management System Certification as Occupational Health and Safety OHSAS 18001: 2008.Authorization Certificate level III laboratory for performing laboratory tests and checks.
METHOD AND MATERIAL
131
containing financial data. Bureau phase was accomplished trough data ordering and usage – as working method – of time comparison.
RESULTS AND DISCUSSIONS
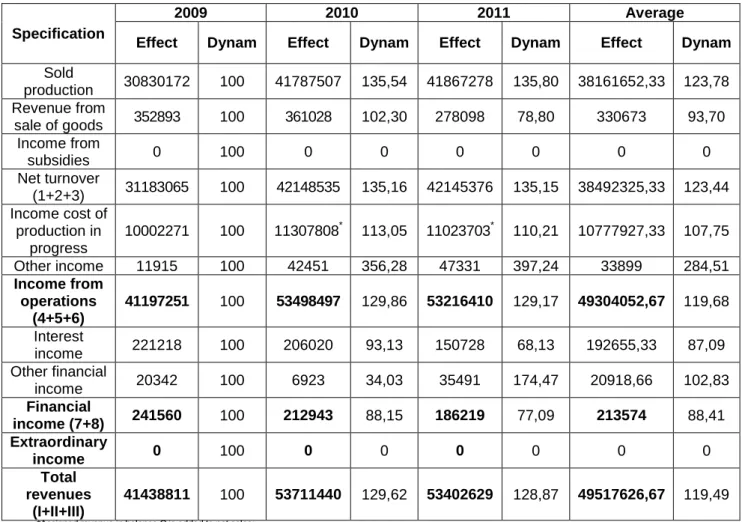
Table 1. presents the level of income indicators for the years 2009, 2010 and 2011. The first indicator of income is the production sold. This indicator varied ascending from 2009 level of 30,830,172 lei, being surpassed by 35.54% in 2010 (41,787,507lei) and 35.80% in 2011 (41,867,278 lei), so the average was 38,161,652.33 lei (23.78% compared to 2009).
Revenue from sale of goods ranged from 361,028 lei in 2010 to 278,098 lei in 2011, the average period being 330,673 lei. The dynamics is lower than in 2011 (78.80%) and the average period (93.70%) and over-unit for 2010, 102.30%, compared to the dynamic report (2009 level).
Income from subsidies are not found in the analyzed indicators.
Table 1. Indicators of income
-lei-
Specification
2009 2010 2011 Average
Effect Dynam Effect Dynam Effect Dynam Effect Dynam
Sold
production 30830172 100 41787507 135,54 41867278 135,80 38161652,33 123,78 Revenue from
sale of goods 352893 100 361028 102,30 278098 78,80 330673 93,70 Income from
subsidies 0 100 0 0 0 0 0 0
Net turnover
(1+2+3) 31183065 100 42148535 135,16 42145376 135,15 38492325,33 123,44 Income cost of
production in progress
10002271 100 11307808* 113,05 11023703* 110,21 10777927,33 107,75
Other income 11915 100 42451 356,28 47331 397,24 33899 284,51
Income from operations
(4+5+6)
41197251 100 53498497 129,86 53216410 129,17 49304052,67 119,68
Interest
income 221218 100 206020 93,13 150728 68,13 192655,33 87,09 Other financial
income 20342 100 6923 34,03 35491 174,47 20918,66 102,83
Financial
income (7+8) 241560 100 212943 88,15 186219 77,09 213574 88,41 Extraordinary
income 0 100 0 0 0 0 0 0
Total revenues
(I+II+III)
41438811 100 53711440 129,62 53402629 128,87 49517626,67 119,49
*Assigned revenue in balance C is added to net sales;
Based on the indicators listed was determined the turnover this averaging 38,492,325.33 lei (23.44% compared with 2009-31183065 lei). The indicator values recorded for other years being of 42145376 lei in 2011 (35.15% dynamic) and 42,148,535 lei in 2010 (35.16% of the reporting).
132
Other categories of income compared to the above were 11915 lei in 2009 increased 3.56 times in 2010 to a value of 42,451 lei and 3.97 times in 2011 - level of income of 47331 lei so that the average period was 33899 lei (over the reporting 184.51%).
Operating income is calculated by adding the turnover, cost of production-related income under execution and other income their levels are as follows (Figure 1.) 41,197,251 lei in 2009, 53,498,497 lei for 2010-129 86% in dynamically 53,216,410 lei for the year 2011 to 129.17% 49,304,052.67 lei period average (19.68%).
Figure 1. Income from operations
The unity recorded incomes from interests of 221,218 lei in 2009, 206,020 lei in 2010 and 150,728 lei in 2011, therefore the average period was 192,655.33 lei. The dynamics reveals subunit values beside the term of reference with 6.87%, 31.87% and 12.91% in 2010, 2011 and for the period average. Other financial income was 20,918.66 lei on average, with a maximum of 35,491 lei in 2011 (74.47% dynamic), a minimum of 6923 lei in 2010 (-65.97%) and a level 2009 of 20342 lei.
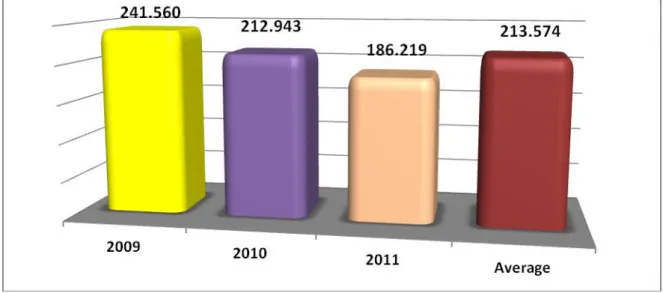
Financial income (resulting from adding interest income from other financial income) decreased during the period under review, being (Figure 2.): 241 560 lei in 20096, 212 943 lei in 2010 (88.15% over the previous year) , 186,219 lei in 2011 (77.09%) 213 574 lei for period average (88.41% compared to the first term).
Figure 2. Financial income
It should be noted that the company has not recorded during the period, any extraordinary income.
133
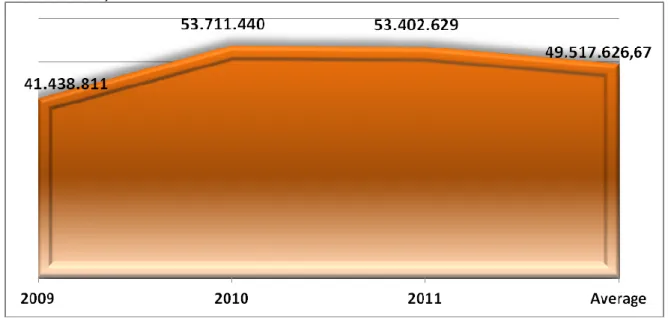
53,711,440 lei in the year 2010 to 129.62 % in dynamically 53402629 lei for 2011 (outrunning by 28.87% of base reporting) period average 49,517,626.67 lei (19.49% compared to 2009 - term of reference).
Figure 3. Total revenues
Table 2. presents indicator level of expenditure for the period under review. Refer to the operating expenses, financial expenses, extraordinary expenses and total expenses. Expenses with raw materials and consumables ranged from 15099998 lei in 2009 to 23,874,779 lei in 2011, while the average period was 20,332,706.67 lei in 2010 being the level of 22,023,343 lei.
The dynamics points ascending trend of the indicator, being reference earlier deadline: 45.84% in 2010, 58.11% in 2011 and 34.65% in average.
Other materials have an average of 4976122 lei (8.58% dynamic), involving the temporal sequences: 4,582,993 lei in 2009, 5,469,849 lei in 2010 (19.35%), 4,875,524 lei in 2011 (6.38% compared to the first term).
Expenses (water and energy) have decreased in the period from 433,195 lei in 2009 to 401,193 lei in 2010 (previous year 92.61%) and 399,116 lei in 2011 (92.13% compared to the first term) so that on average they were 411 168 lei (94.91%).
Cost of merchandises increased by 10.05% in 2010 compared to the year 2009 (from 275 415 lei to 303 083 lei) 2011-321941 lei (reaching16.89% dynamic). Under these conditions, the average for this indicator was 300,146.33 lei (8.98% compared to 2009).
Due to this situation, the total material costs had an average of 26020143 lei, which represented a 27.6% increaseing in 2009. For years from analyzed interval they were: 20391601 lei in 2009, 28,197,468 lei in 2010 (38.28%) 29,471,360 lei in 2011 (44.53% in the dynamics composed).
Wages increased from 6495272 lei in 2009 with 18.16% in 2010 (7,675,118 lei) and 32.11% for 2011 (8,581,062 lei). The same tendency presents also the average period which extends beyond compared to 16.76% - 7,583,817.33 lei.
Security costs have averaged 1934779 lei (18.69% of the reporting) with extremes of 1,630,118 lei in 2009 and 2,244,535 lei in 2011 (37.69%). In 2010 the indicator exceeded the benchmark 18.38% - 1,929,674 lei.
134
Table 2. Spending indicators
-lei-
Nr.
crt. Specification
2009 2010 2011 Average
Effect Dynam Effect Dynam Effect Dynam Effect Dynam
1
Raw materials and consumable
materials
15099998 100 22023343 145,85 23874779 158,11 20332706,67 134,65
2 Other material
expenses 4582993 100 5469849 119,35 4875524 106,38 4976122 108,58
3 Expenses (water,
energy) 433195 100 401193 92,61 399116 92,13 411168 94,91
4 Expenditure for
goods 275415 100 303083 110,05 321941 116,89 300146,33 108,98
5
Total expenditures for
materials and goods (1+2+3+4)
20391601 100 28197468 138,28 29471360 144,53 26020143 127,6
6 Salaries 6495272 100 7675118 118,16 8581062 132,11 7583817,33 116,76
7 Insurance
expenses 1630118 100 1929684 118,38 2244535 137,69 1934779 118,69
8 Personnel
expenses (6+7) 8125390 100 9604802 118,21 10852597 133,56 9527596,33 117,26
9 Adjustments
fixed asset 1172363 100 1018025 86,83 1269863 108,32 1153417 98,38
10
Expenses concerning external services
8738343 100 9706509 111,08 10314959 118,04 9586603,66 109,71
11
Other taxes, fees and similar
payments
195273 100 179758 92,05 228574 117,05 201201,66 103,04
12 Other expenses 252827 100 217437 86,0 244799 96,82 238354,33 94,28
13
Other operating expenses (10+11+12)
9186443 100 10103704 109,98 10788332 117,44 10026159,67 109,14
I
Total operational expenses (5+8+9+13)
38875797 100 48923999 125,85 52382152 134,74 46727316 120,2
14 Interest expense 74391 100 18862 25,35 4353 5,85 32535,33 43,74
15 Other financial
expense 0 100 0 - 3 - 1 33,33
II Financial
expenses (14+15) 74391 100 18862 25,35 4356 5,85 32536,33 43,74
III Extraordinary
expenses 0 100 0 - 0 - 0 -
IV Total expenditure
(I+II+III) 38950188 100 48942861 125,66 52386508 134,5 46759852,33 120,05
Another item of expenditure appears as the adjustments concerning assets indicator that has an uneven evolution. The year 2009 is characterized by a value of 1,172,363 lei adjustments, value drops to 1,018,025 lei in 2010 (86.83% over the previous year), and then to increase to 1,269,863 lei in 2011 (8.32% compared to first term). Under these conditions the average period reached 1153417 lei (98.38% of the reporting).
Expenditure on external services were 8738343 lei in 2009 increased by 11.08% in 2010 (9,706,509 lei) and 18.04% in 2011 (10,314,959 lei), while the average period outrun by 9.71% the reporting term - 9,586,603.66 lei.
135
For the item "other expenses" average is 238,354.33 lei (-5.72% over the reporting period), the sequential variable values: 217 437 lei in 2010 14.0%), 244,799 lei in 2011 (-3.18% compared to the reporting base) and 252 827 lei for the first time (2009).
Following the values quoted for the last three indicators were determined other operating expenses which have been: 9186443 lei in 2009, 10,103,704 lei for 2010 to 109.98% 10,788,332 lei - 117.44% in 2011. With these values we determined the average period was 10,026,159.67 lei, which in dynamic was exceeded by 9.14% in the reporting database.
Total operating costs (Figure 4.) Based on total material costs, personnel costs, adjustments fixed asset and other operating expenses. Based on parameter values, remember earlier, it was sequential levels: 38875797 lei in 2009, 48,923,999 lei for 2010 (25.85% dynamic) 52,382,152 lei in 2011 (34.74% compared with the term reference) 46727316 lei period average (20.2% in dynamic composed).
Figure 4. Total operational expenses
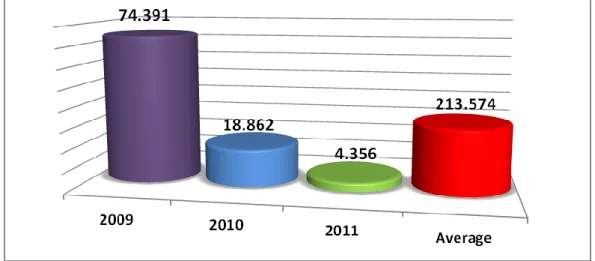
These values remark the upward trend of operating expenses for the period analyzed. In the interest expense is recorded an average of 32535.33 lei (43.74% compared to 2009), with annual sequential levels of 4353 lei in 2011 (5.85% compared to 2009), 18,862 lei in 2010 (25.35%) and 74,391 lei in 2009.
Other financial expenses are recorded only in 2011 and are 3 lei, so the amount of financial expenses is equal to the interest concerning except of that year (4356 lei) - fig. 5.
Figure 5. Financial expenses
136
2010 (25.66% over the previous year) , 52386508 lei in 2011 (34.50% compared to the first term) 46,759,852.33 lei the average range (20.05% dynamic).
Figure 6. Total expenditure
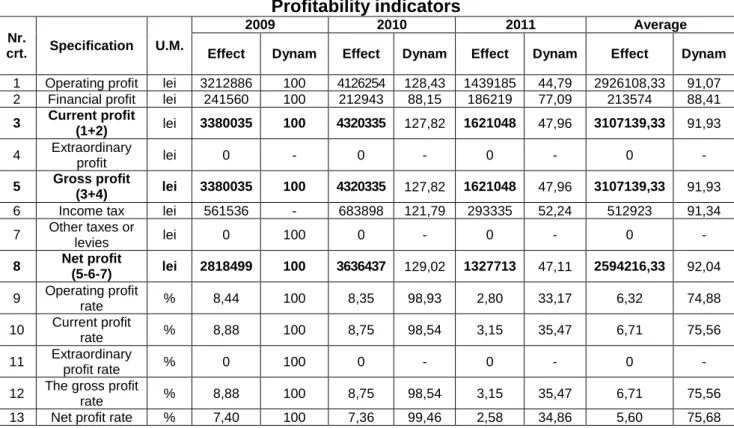
Table 3. presents the level of profitability indicators for the period.
Table 3. Profitability indicators
Nr.
crt. Specification U.M.
2009 2010 2011 Average
Effect Dynam Effect Dynam Effect Dynam Effect Dynam
1 Operating profit lei 3212886 100 4126254 128,43 1439185 44,79 2926108,33 91,07
2 Financial profit lei 241560 100 212943 88,15 186219 77,09 213574 88,41
3 Current profit
(1+2) lei 3380035 100 4320335 127,82 1621048 47,96 3107139,33 91,93
4 Extraordinary
profit lei 0 - 0 - 0 - 0 -
5 Gross profit
(3+4) lei 3380035 100 4320335 127,82 1621048 47,96 3107139,33 91,93
6 Income tax lei 561536 - 683898 121,79 293335 52,24 512923 91,34
7 Other taxes or
levies lei 0 100 0 - 0 - 0 -
8 Net profit
(5-6-7) lei 2818499 100 3636437 129,02 1327713 47,11 2594216,33 92,04
9 Operating profit
rate % 8,44 100 8,35 98,93 2,80 33,17 6,32 74,88
10 Current profit
rate % 8,88 100 8,75 98,54 3,15 35,47 6,71 75,56
11 Extraordinary
profit rate % 0 100 0 - 0 - 0 -
12 The gross profit
rate % 8,88 100 8,75 98,54 3,15 35,47 6,71 75,56
137
Operating profit is characterized by an average of 2,926,108.33 lei (-8.93% compared to 2009), the annual levels resulting from sequential 3,212,886 lei in 2009, 4,126,254 lei specific 2010 (28.43% of previous year) and 1439185 lei for 2011 (-55.21%).
Financial income was 241 560, 212 943 and 186 219 lei for the three components of the dynamic series 2009, 2010 and 2011 respectively (-11.85 and -22.21% compared to time dynamic reporting). Due to this situation, the average period reached 213,574 lei, ie 88.41% fixed base index value.
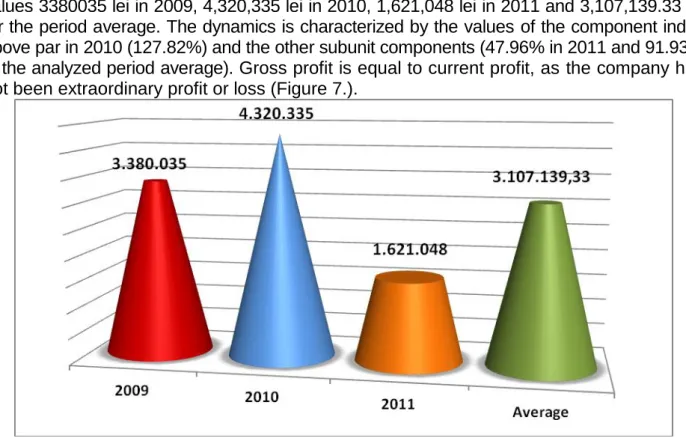
Current profit appears as the sum of operating profit and financial profit. So talk about values 3380035 lei in 2009, 4,320,335 lei in 2010, 1,621,048 lei in 2011 and 3,107,139.33 lei for the period average. The dynamics is characterized by the values of the component index above par in 2010 (127.82%) and the other subunit components (47.96% in 2011 and 91.93%
in the analyzed period average). Gross profit is equal to current profit, as the company has
not been extraordinary profit or loss (Figure 7.).
Figure 7. Gross profit
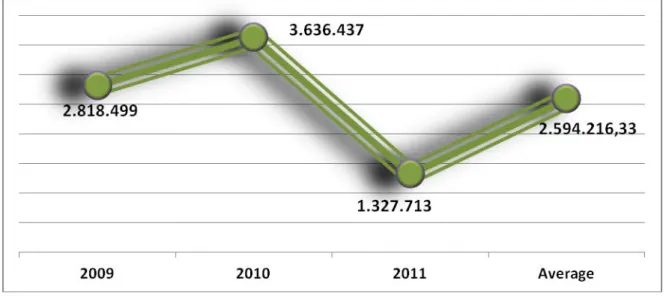
The Company has not paid "other taxes", but paid income tax which stood at 561,536 lei in 2009, 683,898 lei in 2010 (21.79% dynamic) 293 335 lei in 2011 (-47 , 76%). Under these conditions the average period was 512 923 lei, which was lower with 8.66% reporting base. Net profit (fig. 8.) is characterized by an average of 2,594,216.33 lei, while the extreme values of the indicator occurred 2011-1327713 lei and 2010-3636437 lei.
Dynamics of indicators are characterized by a over-unit value in 2010 (29.02% compared to the 2,818,499 lei in 2009) and two levels below par in 2011 (-52.89%) and the average period (-7.96% ).
Operating profit rate was 8.44% in 2009, 8.35% for 2010, 2.80% in 2011 and to 6.32% for the period average. Evolution in time of the indicator is in the form of a downtrend, falls compared to the benchmark being 7.07% in 2010, 66.83% for 2011 and 14.12% for the period average.
It can be seen that the current profit rate is higher than the previous indicator, being 8.88% in 2009, 8.75% in 2010 (98.54% compared to the first term), 3.15% in 2011 (35, 47% compared with 2009) and 6.71% to the average period (75.56% in dynamics).
The gross profit rate is equal to the current rate of profit as the company has not registered extraordinary profit or loss.
138
7.40% for 2009 and 2.58% in 2011 . Due to this situation, the dynamics is strictly downward 2010 representing 99.46% of the base, in 2011 only 34.86%.
Figure 8. Net profit
CONCLUSIONS
In the total income structure prevailing operating income with 99.57%, financial income being only 0.43% of the total. Components are included in operating revenue ratios: 94.33% the turnover 21.86% revenues from production costs, 0.07% other income. Net turnover, consists of 99.14% and 0.86 sold production revenue from the sale of goods (Figure 9.).
Figure.9. The ratio of total income and its main components (%)
139
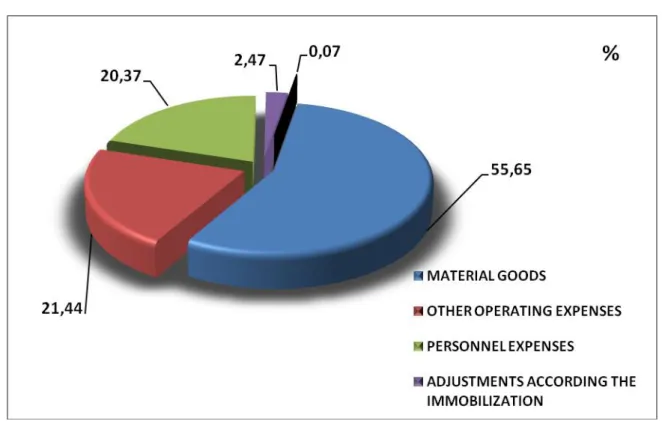
Figure 10. Structure of total expenditure
The unity record operating profit and financial profit - 2,926,108.33 lei and 213 574 respectively, which make current profit - 3,107,139.33 lei.
Given that the unit has not reported profit or loss is found extraordinary similarity between current profit and the profit, the latter decreasing by taxes paid (512 923 lei), so reaching a net profit of 2,594,216, 33 lei.
The poor results is remarkable 2011 year net profit fell very sharply from 3,636,437 lei (in 2010) to 1,327,713 lei (-63.49%).
BIBLIOGRAPHY
1. Pânzaru RL, Medelete DM, Ştefan G., 2011, Management and Marketing terrestrial measurements, Universitaria Publishing House, Craiova
2. XXX, 2001 Guide economic indicators Teora Bucharest