170
CONSIDERATIONS REGARDING WORLD WINE MARKET
ION PIRVUTOIU1, AGATHA POPESCU2 1Hyperion University, 169 Calea Calarasilor, District 3, Bucharest, Romania 2University of Agricultural Sciences and Veterinary Medicine of Bucharest, 59 Marasti, District 1,
Bucharest, 011464, Romania, Phone:+40213182564, Fax:+40213182888, Email:[email protected]
Keywords: consumption, production, trade, wine, world market
ABSTRACT
In 2010, world wine production accounted for 26,384 Million liters, wine export for 10,436 Million liters and import for 9,865 Million liters. Even thou, wine production registered a slight decline, export and import have been intensively developed. Wine consumption increased by 5.45 %, accounting for 23,200 Million liters, meaning 3.47 liters/capita in average at world level. Wine export/import ratio has slightly declined from 111.35 % in 2000 to 105.78 %, but it is still an over unitary ratio showing a highly efficient wine trade. As a conclusion, wine will continue to be an attractive drink and food product of high efficiency in international production and trade.
INTRODUCTION
Wine has continued to be an important product achieved and commercialized in many regions and countries of the world. While the surface covered by vineyards has registered a decline, wine production has grown due to a higher performance in grape yield (Karlsson, 2012).
Wine market is dominated by Europe, where are situated the most important producers and exporters (Ruitenberg, 2012). Important changes are taking place at world level regarding the forces ratio in an increased competition, while wine consumption is decreasing in the European countries, in other regions and states wine demand is higher and higher: North and South America, Australia, China and Africa (Spahni, 2012, Truong, 2012).
MATERIALS AND METHODS
The paper was carried out based on the Statistical data provided by FAO Stat, 2012 and International Organization of Vine and Wine and other information source for the period 2000-2010. The data were processed using the index, share and comparison methods. The main indicators taken into consideration have been: wine production, consumption, consumption per inhabitant, export and import quantity and value, pointing out the main trends at world level and the most important countries in wine market.
RESULTS AND DISCUSSIONS
World wine production accounted for 26,384 Million liters in 2010, being by 6.86 % lower than in the year 2000 (Table 1).
Table 1
World Wine Production, Export, Import, Consumption in 2000 and 2010
M.U. 2000 2010 2010/
2000 %
Production Mil. liters 28,327 26,684 93.14
Consumption Mil. liters 21,999 23,200 105.45
Consumption per capita Liters/capita 3.64 3.47 95.32
Export Mil. liters 6,101 10,436 171.05
Import Mil. liters 5,479 9,865 180.05
Export value USD Mil. 12,704 29,113 229.16
Import value USD Mil. 12,771 29,971 234.68
171
Its level has been directly influenced by the evolution of area cultivated with vine, grape yield, climate conditions, applied technologies and other factors.
Vineyards surface declined by 2.8 %, from 7,847 thousand ha in 2000 to 7,628 thousand ha in 2010. Of the 7.6 Million ha covered by vineyards at world level, 57 % are in Europe, 22 % in Asia, 13 % in Americas, 5 % in Africa and 2.7 % in Oceania (Karlsson, 2012). The top countries by vineyard acreage are Spain (1,082 thou ha), France (825 thou ha), Italy (798 thou ha), Turkey (505 thou ha), China (490 thou ha), USA (404 thou ha), Iran (300 thou ha), Portugal (243 thou ha), Argentina (228 thou ha) and Romania (204 thou ha.
In the EU, in 2010, there were 3,620 thousand ha vineyards, representing 47.1 % of world area. This happened also with the European vineyards, whose surface decreased by 13.23 % from 3,290 thousand ha in 2000 to 2,855 thousand ha in 2010. Therefore, the decline of vineyards area in Europe has had a deep impact on grape and wine production at world level, knowing that Europe is the main grape and wine producer in world.
Grape production recorded 4.89 % growth rate in the period 2000-2010, accounting for 679.5 Million quintals in the last year of the analyzed interval. In 2010, 222 Million quintals grapes, that is 32.81 % of world grape production was destined for fresh consumption compared to 152 Million quintals in 2000 (OIV, 2012). Therefore, wine production was positively influenced by the increased grape yield and the share of grape production destined to be processed in wine.
Wine production is carried out in different percentage from a continent to another: 66 % in Europe, 19 % in Americas, 5.5 % in Asia, 5 % in Oceania, 4 % in Africa.
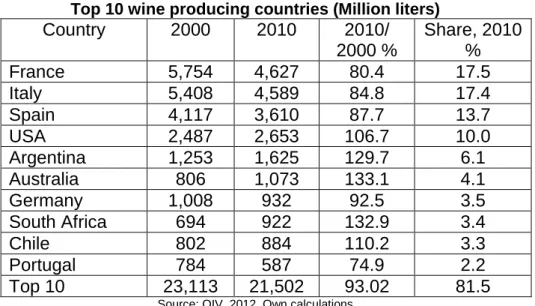
The top 10 wine producing countries: France, Italy, Spain, USA, Argentina, Australia, Germany, South Africa, Chile and Portugal achieved together 21,502 Million liters wine in 2010, by about 7 % than in 2000, but all together contributing by 81.5 % to the world wine production. At world level, in the analyzed period, wine production recorded different development from a region to another.While in the traditional producing areas, it registered a decrease: France (-20 %), Portugal (-25 %), Italy (-15 %), Spain (-12 %), Germany (- 7.5 %), Greece (-26 %), Hungary (-24 %), Russian Federation (-13 %), Romania (-11 %), in other regions like Americas, Oceania and Africa recorded an increase: New Zeeland (+59 %), Australia (+33 %), South Africa (+33 %), Argentina (+20 %), Chile (+10 %), USA (+6.7 %).
The market share for the top wine producers in 2010 was: 17.5 % France, 17.4 % Italy, 13.9 % Spain, 10 % USA, 6.1 % Argentina, 4.1 % Australia, 3.5 % Germany, 3.4 % S. Africa, 3.3 % Chile and 2.2 % Portugal. Three countries: France, Italy and Spain are the main wine producers, contributing by 48.6 % to the world production (Table 2).
Table 2
Top 10 wine producing countries (Million liters)
Country 2000 2010 2010/
2000 %
Share, 2010 %
France 5,754 4,627 80.4 17.5
Italy 5,408 4,589 84.8 17.4
Spain 4,117 3,610 87.7 13.7
USA 2,487 2,653 106.7 10.0
Argentina 1,253 1,625 129.7 6.1
Australia 806 1,073 133.1 4.1
Germany 1,008 932 92.5 3.5
South Africa 694 922 132.9 3.4
Chile 802 884 110.2 3.3
Portugal 784 587 74.9 2.2
Top 10 23,113 21,502 93.02 81.5
172
World wine consumption increased from 21,999 Million liters in the year 2000 to 23,200 Million liters in 2010, registering 5.45 % growth rate (Table 1). In 2010, wine consumption distribution was the following: 65 % Europe, 22 % Americas, 7.9 % Asia, 2.9 % Africa and 2.7 % Oceania.
The top 10 countries situated in the top based on amount of consumed wine
were France, USA, Italy, Germany, China, United Kingdom, Russian Federation, Spain, Argentina and Romania, whose consumption all together accounted for 166 Million hl, representing 71.6 % of world consumption. While wine consumption registered a high growth rate in some countries like: Russian Federation (+146.8 %), and China (+47.7 %), USA (+30.2 %), in other countries it has deeply fallen: Spain (-26 %), Romania (-25 %), Argentina (-22 %), Italy (-20 %), France (-16 %) (Table 3).
Table 3
Top 10 wine consumers based on total wine quantity consumed (Million hl)
Country 2000 2010 2010/
2000 %
Share, 2010 %
France 34.5 28.9 83.7 12.5
USA 21.2 27.6 130.2 11.9
Italy 30.8 24.6 79.9 10.6
Germany 20.1 20.2 100.5 8.7
China 10.7 15.8 147.7 6.8
U. Kingdom 9.7 13.2 136.1 5.7
Russian Fed. 4.7 11.6 246.8 5.0
Spain 14.0 10.4 74.2 4.5
Argentina 12.5 9.8 78.4 4.2
Romania 5.2 3.9 75.0 1.7
Top 10 163.4 166.0 101.6 71.6
Source: FAO Stat, 2012, Own calculations
The wine consumption per inhabitant varies according to population and total wine consumption. In the top positions are countries where wine consumption per capita exceeds 35 liters/capita/year, while at world level wine consumption per capita declined from 3.64 liters in 2007 to 3.47 liters in 2010 (Table 2). In 2010, in top it was placed Vatican City State with 54.78 liters/capita, followed by Norfolk Island with 54.50 liters/capita and Luxembourg with 52.46 liters/capita. In France, Italy and Portugal, wine consumption per capita varied between 41.81 liters in Portugal and 45.70 liters in France. Denmark is placed on the 10th position with 35.09 wine liters/inhabitant. In Norfolk Island, Luxembourg, France, Portugal and Slovenia, it was consumed less wine per capita.
World wine export increased by 71.05 % from 6,101 Million liters in the year 2000 to 10,436 Million liters in 2010 (Table 1). However, while the share of the EU major wine exporters decline from 70 % to 65 %, the share of the countries situated in the Southern hemisphere and USA has increased from 14 % to 25 %.
173
Table 4
Top 10 wine exporters (Million hl)
Country 2000 2010 2010/
2000 %
Share, 2010 %
Italy 14.7 20.6 140.1 19.7
Spain 7.8 17.1 219.2 16.4
France 14.8 13.5 91.2 12.9
Australia 3.1 7.8 251.6 7.5
Chile 4.0 7.3 182.5 7.0
USA 2.8 4.4 157.1 4.2
South Africa 1.7 3.9 229.4 3.7
Germany 2.4 3.8 158.3 3.6
Argentina 0.9 2.7 300.0 2.6
Portugal 1.9 2.6 136.8 2.5
Top 10 54.1 83.7 154.7 80.20
Source: FAO Stat, 2012, Own calculations
The wine import performed 80.05 % growth rate in the period 2000-2010, reaching 9,865 Million liters in 2010 (Table 1).
The main countries situated on the top based on the amount of imported wine
were Germany, United Kingdom, USA, Russian Federation, France, Canada, Netherlands, Belgium, China and Japan.
All these together imported 60.9 Million hl in the year 2010, by 65.6 % more than in 2000.
In all these countries wine imports increased, but the highest growth rate was carried out in China (625 %), Spain (+566 %), Russian Federation (+243.7 %), USA (+111 %).
The lowest increase was recorded by France (+2.3 %). In 2010, Germany, United Kingdom, USA, Russian Federation and France accounted for 46.9 % of world wine import (Table 5).
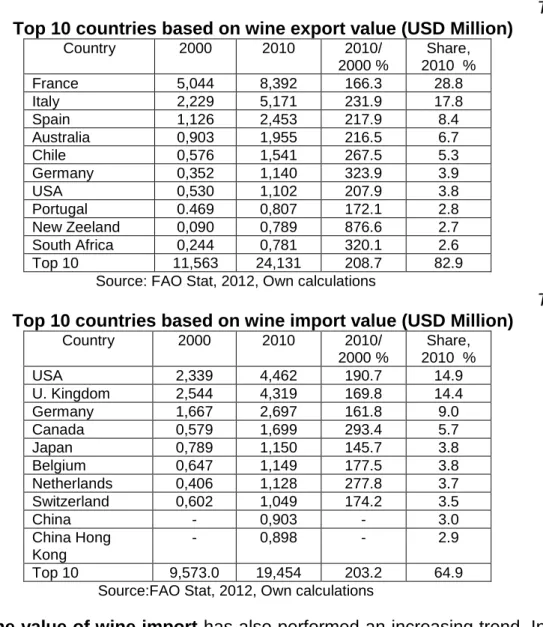
World Wine Export value has grown up by 129.16 % from USD 12,704 Million in 2000 to USD 29,113 Million in 2010.
The top 10 countries based on wine export value were France, Italy, Spain, Australia, Chile, Germany, USA, Portugal, New Zeeland and South Africa.
Their wine export value accounted for USD 24,131 Million in 2010, representing 82.9 % of world wine export value (Table 6).
Table 5
Top 10 Wine Importers (Million hl)
Country 2000 2010 2010/
2000 %
Share, 2010 %
Germany 9.9 14.2 143.4 14.4
U. Kingdom 8.9 12.5 140.4 12.7
USA 4.5 9.5 211.1 9.6
Russian Fed. 1.6 5.5 343.7 5.6
France 4.4 4.5 102.3 4.6
Canada 2.4 3.5 145.8 3.5
Netherlands 2.0 3.3 165.0 3.3
Belgium 2.6 3.0 115.4 3.0
China 0.4 2.9 725.0 2.9
Japan 0.3 2.0 666.6 2.0
Top 10 36.8 60.9 165.5 61.7
174
Table 6
Top 10 countries based on wine export value (USD Million)
Country 2000 2010 2010/
2000 %
Share, 2010 %
France 5,044 8,392 166.3 28.8
Italy 2,229 5,171 231.9 17.8
Spain 1,126 2,453 217.9 8.4
Australia 0,903 1,955 216.5 6.7
Chile 0,576 1,541 267.5 5.3
Germany 0,352 1,140 323.9 3.9
USA 0,530 1,102 207.9 3.8
Portugal 0.469 0,807 172.1 2.8
New Zeeland 0,090 0,789 876.6 2.7
South Africa 0,244 0,781 320.1 2.6
Top 10 11,563 24,131 208.7 82.9
Source: FAO Stat, 2012, Own calculations
Table 7
Top 10 countries based on wine import value (USD Million)
Country 2000 2010 2010/
2000 %
Share, 2010 %
USA 2,339 4,462 190.7 14.9
U. Kingdom 2,544 4,319 169.8 14.4
Germany 1,667 2,697 161.8 9.0
Canada 0,579 1,699 293.4 5.7
Japan 0,789 1,150 145.7 3.8
Belgium 0,647 1,149 177.5 3.8
Netherlands 0,406 1,128 277.8 3.7
Switzerland 0,602 1,049 174.2 3.5
China - 0,903 - 3.0
China Hong Kong
- 0,898 - 2.9
Top 10 9,573.0 19,454 203.2 64.9
Source:FAO Stat, 2012, Own calculations
The value of wine import has also performed an increasing trend. In 2010, world wine import value accounted for USD 29,971 Million, being 2.34 times higher than in 2000.
Among the top countries based on import value are: USA, United Kingdom, Germany, Canada, Japan, Belgium, Netherlands, Switzerland and China. Their wine import value accounted for USD 19,454 Million in 2010, being 2 times higher than in 2000 and contributing by 64.9 % to the world wine import value.
CONCLUSIONS
Wine demand is still high reflected by the increased consumption in the period 2000-2010. However, the average consumption of wine per capita decreased from 3.64 liters in 2000 to 3.47 liters in 2010. In the top consuming countries, wine consumption per inhabitant varies from 35 liters in Denmark to 54 liters in Vatican.
Despite that, wine production registered a slight decline in the analyzed period, wine trade has become more intensively developed. The amount of exported wine increased by 71 %, while the amount of imported wine increased by 80 %. Both the value of wine export and imported value doubled in 2010 compared to 2000.
175
As a conclusion, wine will continue to be an attractive drink and food product of high efficiency in international production and trade.
BIBLIOGRAPHY
Karlsson, P., 2012, World Wine Statistics, www.bkwine.com.
Ruitenberg, R., 2012, World Wine Trade, www.bloomberg.com
Spahni, P., 2012, The International Wine Trade, 2nd Edition.
Truong, Q.D., 2012, The global wine Industry, An Overview Global AgInvesting. Research and Insight: 1-14.
FAO Stat, Wine Production and Trade, 2012.
Global Economic Survey, 2012, OIV – International Organization of Vine and Wine.
Statistical Report on World Vitiviniculture, 2012, OIV.
Wine Annual Report and Statistics. Wine Annual EU-27. www.calwineexport.com
World wine production by country 2007-2010, www.wineinstitut.org.