Evaluation of dried blood spot technique for pharmacokinetic
study of hydrochlorothiazide and comparison of human plasma
versus dried blood spot
P Pavan Kumar
1,2*, TEGK Murthy
31Department of Pharmacy, Krishna University, Machilipatnam, Andhra Pradesh, India, 2Accutest Research
Laboratories India Private Limited, Khairane MIDC, Navi Mumbai, Maharashtra, India, 3Bapatla College
of Pharmacy, Bapatla, Guntur, Andhra Pradesh, India
ABSTRACT
Background: The dried blood spot (DBS) technique is a convenient alternative sample collection method to venipuncture. The use of DBS was fi rst widely introduced in the 1960’s by Dr. Guthrie to measure levels of phenylalanine in newborns for the diagnosis of phenylketonuria. The scientifi c community has recently expressed interest in applying the DBS technique for quantifi cation of drugs in biological fl uids. Materials and Methods: Reversed phase high performance liquid chromatography-tandem mass spectrometry (LC-MS/MS) assays for the determination of hydrochlorothiazide (HCTZ) in human plasma and DBS samples were developed and validated. Furthermore, clinical samples collected from human volunteers as a part of pharmacokinetic (PK) study and PK data from plasma were compared against DBS. Results: The range of reliable response in plasma and DBS was 2-200 ng/mL with a correlation coeffi cient ≥0.997. Inter-day accuracy was always within 85-115%, and inter-day precision for plasma and DBS were <15%. Conclusions: Comparison of HCTZ PK data in DBS and plasma yielded good correlation, indicating that DBS can be used as a plasma alternative for PK analyses invivo.
Key words: Dried blood spot, hydrochlorothiazide, pharmacokinetic, validation
INTRODUCTION
The use of dried blood spot (DBS) was fi rst widely introduced in the 1960’s by Dr. Guthrie, a neonatologist,
to measure levels of phenylalanine in newborns for the diagnosis of phenylketonuria.1 DBS has subsequently
been used as sampling technique in therapeutic drug monitoring of some drugs in clinical practice.2-4 In recent
years, DBS has gained interest in drug discovery and development process due to the fact that it offers several advantages over conventional plasma sampling: Collection of small blood volumes, lower volume of blood collected would certainly facilitate the recruitment of volunteers/patients for clinical studies, the number of animals could be reduced as no satellite group would be required for preclinical studies.
*Address for correspondence:
Mr. P Pavan Kumar, Vanta Bioscience, K2, 11th Cross Street, SIPCOT Industrial Complex, Gummidipoondi, Thiruvallur - 601 201, Tamil Nadu, India. E-mail: [email protected]
Access this article online Journal Sponsor
Website:
www.jyoungpharm.org
DOI:
A number of validated methods for quantitative analysis of small molecules using the DBS technique have been published.5-15 However, only a limited number of the
published articles describe complete analytical validation, unknown sample analysis as well as comparison and correlation of the data obtained from conventional plasma and DBS techniques. More extensive clinical validations of DBS analysis will therefore be essential before widespread use of the technique in preclinical/clinical studies is possible.
The present work describes the analytical validation of two methods for quantifi cation of hydrochlorothiazide (HCTZ) using plasma and DBS techniques. This validated method was successfully applied to pharmacokinetic (PK) study after oral administration of HCTZ 12.5 mg to compare PK profi les generated from plasma and DBS methods.
MATERIALS AND METHODS
Instrumentation
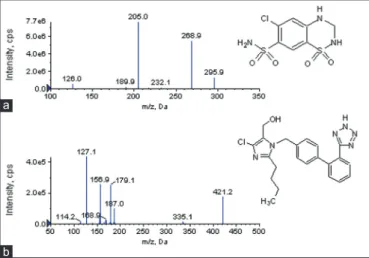
The high performance liquid chromatography (HPLC) system (Shimadzu, LC-20 AD) coupled with a mass spectrometer (MDS Sciex, API 3000) equipped with electrospray ionization (ESI) source was used. The chromatographic separations were performed on a Thermo Hypurity C18 column (50 mm × 4.6 mm, 5 μ) at 25°C using 0.2% v/v formic acid in water and acetonitrile (20:80, v/v) as mobile phase at a fl ow rate of 0.6 mL/min. The mass spectrometer parameters for mass spectrometry (MS) scan in negative ESI mode were optimized. The IS voltage and source temperature were set at −3000 V and 500°C, respectively. Multiple reaction monitoring mode was used with the mass transitions for HCTZ and losartan internal standard (IS) of 295.9→205.0 m/z and 421.2→127.1 m/z, respectively.
Chemicals and reagents
HCTZ and losartan (IS) were purchased from Clearsynth Labs (Mumbai, India). Formic acid (HPLC grade) was purchased from Sigma. Acetonitrile (HPLC grade) was obtained from Baker, USA. Milli-Q water was collected from Milli-Q system. Whatman drug metabolism and PKs-C cards were obtained from Whatman (GE Healthcare). Human blood and plasma with sodium heparin anticoagulant were procured from Navjeen Blood Bank (Hyderabad, India).
Preparation of stock solutions
Approximately 10 mg of HCTZ was dissolved in 10 mL of methanol to get 1 mg/mL stock solution. Losartan (IS)
stock solution was prepared at a concentration 200 μg/mL in methanol. All the intermediate and working solutions were prepared in diluent (methanol:water, 60:40, v/v). All the solutions were stored at 4°C and brought to room temperature (RT) before use.
Preparation of calibration standards and quality control (QC) samples
The human whole blood and plasma harvested using sodium heparin as anticoagulant, were fortified by mixing 25 μL of working solution with 475 μL of whole blood/plasma to arrive at fi nal concentrations of HCTZ for calibration standards (2, 4, 20, 40, 80, 120, 160, and 200 ng/mL) and QC samples (2, 6, 100, and 150 ng/mL). For DBS analysis, 25 μL from spiked whole blood calibration standards and QC samples were spotted on DBS cards. The cards were dried overnight and stored at RT in plastic bags with desiccant. The plasma calibration and QC samples were store at −70°C.
Sample preparation
Plasma extraction method
An aliquot of 100 μL of human plasma sample was taken into a 2 mL micro-centrifuge tube. An aliquot of 25 μL of diluent containing 0.5 μg/mL of IS was added to each tube. The contents were mixed for 30 s and centrifuged at 14000 rpm for 5 min. Condition the Strata-X 33 μm polymeric reversed phase (30 mg/1 mL) solid phase extraction (SPE) cartridge with 1 mL of methanol and equilibrate with 1 mL of HPLC water. Load the sample onto the SPE cartridge and elute it under vacuum at a pressure not more than 2 psi. Wash the sorbent bed with 1 mL of 0.2% v/v formic acid in water and followed by 1 mL HPLC water. Elute the samples with 0.5 mL of mobile phase. Transfer the samples into autosampler vials for injection.
DBS extraction method
A 3 mm diameter disk was punched out from the blood spots for extraction and placed into a 2 mL micro-centrifuge tube. An aliquot of 300 μL of methanol containing 0.5 μg/mL of IS was added to each tube. Samples were sonicated for 5 min followed by vortexing for 5 min and centrifuged for 5 min at 14000 rpm. Supernatants were then transferred to autosampler vials for LC-MS/MS analysis.
Method validation
according to Food and Drug Administration guidelines.16
In addition to the standard parameters (selectivity, linearity and lower limit of quantifi cation [LLOQ], precision and accuracy, matrix effect, recovery, and matrix stability), the challenging parameters (effect of hematocrit [Hct] and sample dilution procedures) were evaluated to address the major obstacles for the applicability of DBS in regulated bioanalysis.17
PK study
The validated bioanalytical method was successfully applied to investigate PK parameters of HCTZ in healthy human volunteers after oral administration of HCTZ 12.5 mg. PK parameters were calculated using non-compartmental analysis performed in Phoenix 1.3 (Pharsight Corporation, North Carolina, USA).
RESULTS
Optimization of LC-tandem MS conditions
The chemical structures of HCTZ and losartan (IS) along with their MS/MS spectrum are shown in Figure 1. Method optimization was performed by adopting a systematic approach during the optimization process of experimental conditions. The chromatographic conditions were optimized to achieve peak symmetry with a short retention time for analyte and IS. Retention times for HCTZ and IS were at 1.06 and 1.13 min, with a total run time of 2.5 min. The representative chromatograms of plasma and DBS samples spiked with analyte and their corresponding blank samples are shown in Figure 2. Blank and Blank with IS samples were free from interference, and signal-to-noise ratio of the LLOQ samples for analyte was more than fi ve.
Method validation
Selectivity
The selectivity for plasma and DBS methods was assessed by comparing the chromatograms of six different lots of blank plasma and whole blood, respectively. These samples were processed as per the method described above. All the plasma and whole blood lots were found to be free from signifi cant interference at the retention times of HCTZ and losartan (IS).
Linearity and LLOQ
The calibration curve was generated by plotting the peak area ratio of HCTZ and losartan (IS) against nominal concentration of HCTZ in plasma and DBS samples. The linearity of the calibration curve over a range of 2-200 ng/mL was determined by a weighted (1/x2)
linear regression for HCTZ in plasma and DBS assays. The calibration curves showed good linearity (Table 1). The LLOQ was taken as the concentration of analyte where signal to noise ratio is 10, and it was found to be 2 ng/mL.
Precision and accuracy
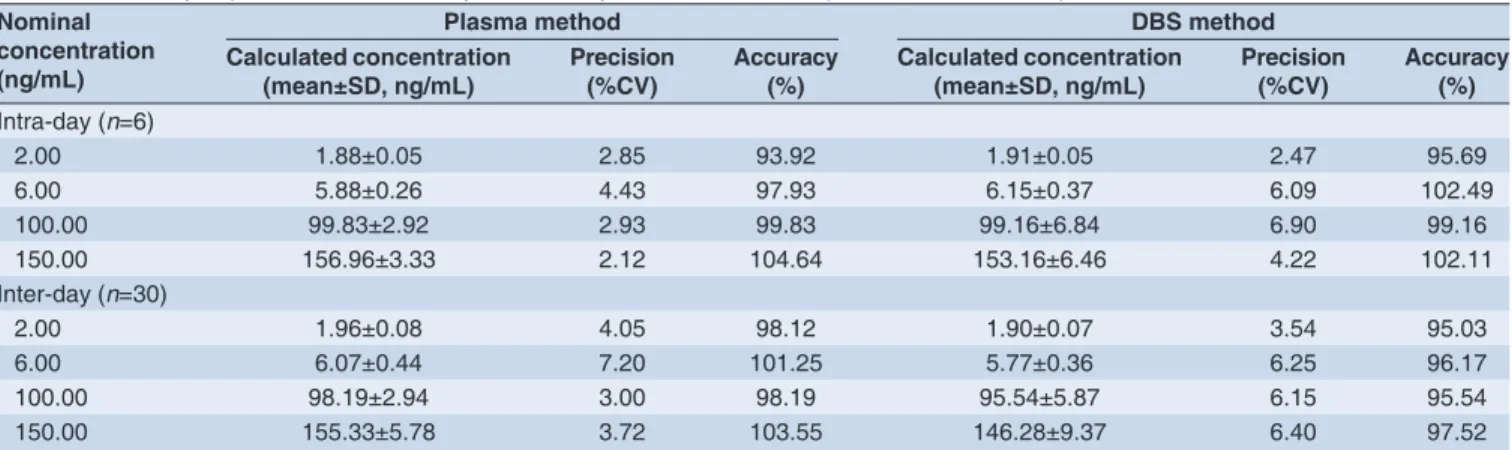
The intra- and inter-assay precision and accuracy of HCTZ in plasma and DBS were evaluated by using six replicates at four QC concentrations (i.e. 2, 6, 100, and 150 ng/mL) in
fi ve different batches. Concentrations were back calculated against a calibration curve. Accuracy (% deviation from theoretical concentration) and precision (% coeffi cient of variance [CV]) were evaluated. The data on intra- and inter-assay precision and accuracy of plasma and DBS are summarized in Table 2. This comparison shows that both the plasma and DBS methods provide similar performance in terms of intra- and inter-assay precision and accuracy.
Matrix effect
The matrix effect was determined by comparing the HCTZ and losartan (IS) peak areas of fortifi ed post-extracted
Table 1: Calibration curve details of hydrochlorothiazide
Nominal concentration (ng/mL)
Plasma method DBS method Calculated
concentration (mean±SD, ng/mL, n=5)
Precision (%CV,
n=5)
Calculated concentration
(mean±SD, ng/mL, n=5)
Precision (%CV,
n=5)
2.00 2.10±0.03 1.25 2.05±0.03 1.44
4.00 4.03±0.09 2.33 4.00±0.13 3.32
20.00 20.54±0.37 1.82 20.91±0.87 4.15
40.00 38.41±0.96 2.50 38.91±1.30 3.33
80.00 78.16±0.83 1.06 77.74±1.61 2.07
120.00 120.47±0.68 0.57 120.05±6.50 5.42 160.00 164.22±0.67 0.41 163.95±5.60 3.42 200.00 193.44±1.97 1.02 198.03±7.09 3.58 CV: Coeffi cient of variance, DBS: Dried blood spot, SD: Standard deviation
Figure 1: Chemical structures and mass spectrometry/mass spectrometry spectra of hydrochlorothiazide (a) and losartan (internal standard) (b)
plasma and DBS samples with peak areas of neat samples. The experiment was determined at two concentrations (6 and 150 ng/mL) with six different blank matrix lots. The variability expressed as %CV was between 3.9 and 5.7% for plasma and 4.8 and 6.6% for DBS assays, for both the levels tested.
Recovery
To determine recovery 25 μL spots were made and allowed to dry. The entire spot was then extracted as per the procedure mentioned earlier. Recovery for HCTZ and losartan (IS) were calculated for plasma and DBS in six replicates at three concentrations (6, 100 and 150 ng/mL). Resulting peak areas of HCTZ and IS after extraction from plasma and DBS were compared with the peak areas of blank samples fortifi ed after extraction with non-extracted standards. The mean extraction recoveries of HCTZ and IS from plasma and DBS were 91.04 ± 1.05%, 92.21 ± 0.78% (IS) and 40.54 ± 2.64%, 78.16 ± 2.12% (IS), respectively. Results of recovery meet the acceptance criteria for bioanalytical assays.
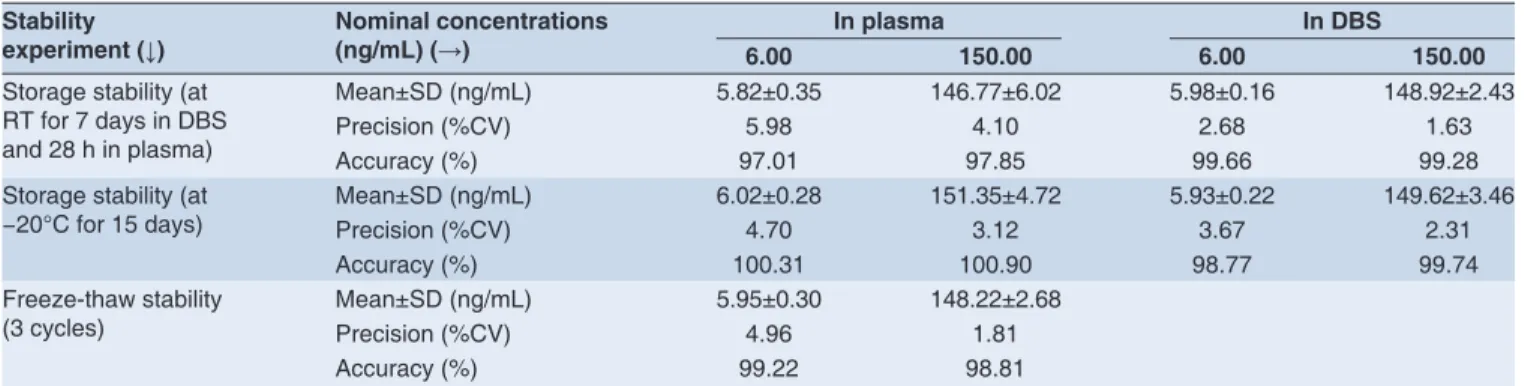
Matrix stability
The stability of HCTZ in plasma and DBS was evaluated by exposing to different conditions at two QC concentration levels (low and high) in six replicates. For plasma assay, bench top, freeze-thaw and long-term stability in plasma were evaluated. For DBS assay, on-card storage stability at RT and −20°C was evaluated. The stability QC sample concentrations were back-calculated against freshly extracted calibration curve and compared with those obtained from freshly prepared QC samples. The results revealed that HCTZ was stable in DBS for at least 7 days at RT and 15 days at −20°C. HCTZ in plasma was proven to be stable at RT for 28 h, after three freeze-thaw cycles and 15 days at −20°C. All the stability experiments met the acceptance criteria of the regulatory guidance.17 The results
were tabulated in Table 3.
Effect of Hct
Hct has a signifi cant effect on blood viscosity. Variability in viscosity leads to differences in fl ux and diffusion properties of blood through DBS card used for sample collection. Hct
Table 2: Summary of precision and accuracy results of hydrochlorothiazide in plasma and DBS samples
Nominal concentration (ng/mL)
Plasma method DBS method
Calculated concentration
(mean±SD, ng/mL) Precision (%CV) Accuracy (%) Calculated concentration (mean±SD, ng/mL) Precision (%CV) Accuracy (%)
Intra-day (n=6)
2.00 1.88±0.05 2.85 93.92 1.91±0.05 2.47 95.69
6.00 5.88±0.26 4.43 97.93 6.15±0.37 6.09 102.49
100.00 99.83±2.92 2.93 99.83 99.16±6.84 6.90 99.16
150.00 156.96±3.33 2.12 104.64 153.16±6.46 4.22 102.11
Inter-day (n=30)
2.00 1.96±0.08 4.05 98.12 1.90±0.07 3.54 95.03
6.00 6.07±0.44 7.20 101.25 5.77±0.36 6.25 96.17
100.00 98.19±2.94 3.00 98.19 95.54±5.87 6.15 95.54
150.00 155.33±5.78 3.72 103.55 146.28±9.37 6.40 97.52
CV: Coeffi cient of variance, DBS: Dried blood spot, SD: Standard deviation
Figure 2: Representative chromatograms of an extracted blank and linearity and lower limit of quantifi cation. Obtained by plasma method (a and b) and dried blood spot method (c and d)
d c
can directly affect the accuracy determinations of analytes in DBS samples.18 For that, clinically relevant variations
of Hct values should be evaluated during validation. The effect of 20%, 35%, and 60% Hct were tested at two concentrations (6 and 150 ng/mL) of HCTZ. These samples were processed as per the procedure outlined earlier. The concentrations of extracts were determined using linear regression equation generated from the calibration curve produced from standards of 35% Hct level. The % difference was calculated by subtracting the % bias of Hct 20% and 60% from % bias of 35% Hct, which was taken as standard Hct value. The results revealed that there was an apparent impact of Hct on the quantifi cation of HCTZ (Table 4).
Dilution integrity
An approach called IS-tracked dilution was used to evaluate dilution integrity of DBS samples.19 Two- and four-fold
dilution factors were investigated using concentration of twice the ULQ for HCTZ (400 ng/mL) in triplicate. Mean responses were multiplied by ×2 and ×4, respectively and were compared to nominal concentration. The %CV was within 4.37% for both dilution factors tested.
PK study
The validated method was successfully used to analyze HCTZ concentrations in DBS and plasma samples of human volunteers under fasting conditions after oral administration of a tablet containing HCTZ 12.5 mg. There were a total of 21 blood collection time points including the pre-dose sample. The plasma and DBS samples from
same human volunteers were analyzed with their respective methods. The maximum plasma concentration, time at which the concentration reached the maximum, area under plasma concentration-time curve (AUC0-t, AUC0-∞) for HCTZ were calculated. The detailed PK parameters are shown in Table 5. After comparison and statistical evaluation of results obtained by plasma and DBS methods, a strong correlation between the concentrations obtained with both methods were observed.
DISCUSSION
Our goal was to develop highly sensitive DBS and plasma assays that can be used for comparative PK study of HCTZ. Analytical method validations for quantifi cation of HCTZ in human plasma and DBS were performed according to guidelines from regulatory agencies. This method can be used in various phases involving PKs, drug interactions, and toxicokinetics. Only few works were traceable for comparative PK evaluation of DBS and evaluation of DBS and plasma.14,20-22 Our present
study has an advantage to have samples from PK study for assessment of HCTZ concentrations in two different matrices that were simultaneously collected at the same time points. This gives the advantage of the present assay being developed and validated in two different matrices.
DBS analysis presents some challenges such as the potential limitations introduced by the sampling method, such as the effect of Hct on blood viscosity and thus the scattering properties of blood applied to the paper.
Table 3: Hydrochlorothiazide stability data (n=6 at all concentration levels)
Stability
experiment (↓) Nominal concentrations (ng/mL) (→) 6.00 In plasma 150.00 6.00 In DBS 150.00
Storage stability (at RT for 7 days in DBS and 28 h in plasma)
Mean±SD (ng/mL) 5.82±0.35 146.77±6.02 5.98±0.16 148.92±2.43
Precision (%CV) 5.98 4.10 2.68 1.63
Accuracy (%) 97.01 97.85 99.66 99.28
Storage stability (at
−20°C for 15 days) Mean±SD (ng/mL)Precision (%CV) 6.02±0.284.70 151.35±4.723.12 5.93±0.223.67 149.62±3.462.31
Accuracy (%) 100.31 100.90 98.77 99.74
Freeze-thaw stability (3 cycles)
Mean±SD (ng/mL) 5.95±0.30 148.22±2.68
Precision (%CV) 4.96 1.81
Accuracy (%) 99.22 98.81
CV: Coeffi cient of variance, DBS: Dried blood spot, SD: Standard deviation, RT: Room temperature
Table 4: Hct assessment
Nominal concentration (ng/mL) 6.00 150.00
Hct values % 20 35 60 20 35 60
Calculated concentration (mean±SD, ng/mL, n=5) 5.50±0.11 5.94±0.07 6.10±0.10 140.19±0.98 148.89±0.68 152.77±1.94
Precision (%CV, n=5) 2.08 1.1 1.63 0.7 0.46 1.27
Accuracy (% bias) −8.31 −0.98 1.64 −6.54 −0.74 1.85
% difference from 35% Hct 7.32 0 −2.63 5.80 0 −2.59
Additional potential limitations include more complex matrix of clotted whole blood versus plasma or serum and the potential interactions with the matrix of fi lter paper. Previous studies have reported that the punching of the DBS is not a signifi cant source of variability in terms of sample volume, as long as the punch is made in a completely saturated area, ideally in the center of the preprinted circle.23
The good correlation between plasma and DBS would not have been possible if the DBS blood volumes in the punched fi lter paper spots had varied signifi cantly.
Throughout the accuracy and imprecision of HCTZ concentrations in DBS matched to those in plasma and the relationship between DBS and plasma concentrations confi rmed that DBS is a valid matrix for future PK studies.
CONCLUSION
The results from this study indicate that DBS analysis is an alternative technique with signifi cant potential as a robust method for drug quantifi cation in PK studies.
REFERENCES
1. Guthrie R, Susi A. A simple phenylalanine method for detecting phenylketonuria in large populations of newborn infants. Pediatrics 1963;32:338-43.
2. Coombes EJ, Gamlen TR, Batstone GF, Holgate ST. The validation of a fl uoroimmunoassay for the determination of theophylline concentration in dried blood spots suitable for domiciliary therapeutic drug monitoring. Clin Chim Acta 1984;136:187-95.
3. Thomson AH, Kerr S, Wright S. Population pharmacokinetics of caffeine in neonates and young infants. Ther Drug Monit 1996;18:245-53. 4. Edelbroek PM, van der Heijden J, Stolk LM. Dried blood spot methods
in therapeutic drug monitoring: Methods, assays, and pitfalls. Ther Drug Monit 2009;31:327-36.
5. Aburuz S, Millership J, McElnay J. Dried blood spot liquid chromatography assay for therapeutic drug monitoring of metformin. J Chromatogr B Analyt Technol Biomed Life Sci 2006;832:202-7.
6. Charles BG, Townsend SR, Steer PA, Flenady VJ, Gray PH, Shearman A. Caffeine citrate treatment for extremely premature infants with apnea:
Table 5: Mean pharmacokinetic parameters of hydrochlorothiazide
Pharmacokinetic
parameter DBS methodMean±SD, (Plasma methodn=6)
Cmax (ng/mL) 65.46±19.34 70.21±18.88
Tmax (h) 1.64±1.31 1.65±1.47
AUC0-t (ng h/mL) 387.42±95.55 393.48±98.38 AUC0-∞ (ng h/mL) 419.28±98.73 423.64±99.20
Cmax: Maximum plasma concentration, Tmax: Time at which the concentration reached the maximum, AUC: Area under plasma concentration-time curve, DBS: Dried blood spot, SD: Standard deviation
Population pharmacokinetics, absolute bioavailability, and implications for therapeutic drug monitoring. Ther Drug Monit 2008;30:709-16. 7. Al-Ghazawi M, Abu Ruz S. Determination of ciprofl oxacin in dried blood
spots for therapeutic drug monitoring. Chromatographia 2010;71:999-1005. 8. Barfi eld M, Spooner N, Lad R, Parry S, Fowles S. Application of dried
blood spots combined with HPLC-MS/MS for the quantifi cation of acetaminophen in toxicokinetic studies. J Chromatogr B Analyt Technol Biomed Life Sci 2008;870:32-7.
9. Kole PL, Majithia R, Singh TR, Garland MJ, Migalska K, Donnelly RF, et al. Dried blood spot assay for estimation of metronidazole concentrations in rats and its application in single animal drug pharmacokinetic study. J Chromatogr B Analyt Technol Biomed Life Sci 2011;879:1713-6. 10. la Marca G, Malvagia S, Filippi L, Fiorini P, Innocenti M, Luceri F, et al. Rapid
assay of topiramate in dried blood spots by a new liquid chromatography-tandem mass spectrometric method. J Pharm Biomed Anal 2008;48:1392-6. 11. Li W, Tse FL. Dried blood spot sampling in combination with LC-MS/MS for quantitative analysis of small molecules. Biomed Chromatogr 2010;24:49-65. 12. van der Heijden J, de Beer Y, Hoogtanders K, Christiaans M, de Jong GJ,
Neef C, et al. Therapeutic drug monitoring of everolimus using the dried blood spot method in combination with liquid chromatography-mass spectrometry. J Pharm Biomed Anal 2009;50:664-70.
13. Clark GT, Haynes JJ, Bayliss MA, Burrows L. Utilization of DBS within drug discovery: Development of a serial microsampling pharmacokinetic study in mice. Bioanalysis 2010;2:1477-88.
14. Youhnovski N, Michon J, Latour S, Mess JN, Bergeron A, Furtado M, et al. Determination of naproxen using DBS: Evaluation & pharmacokinetic comparison of human plasma versus human blood DBS. Bioanalysis 2010;2:1501-13.
15. Taneja I, Erukala M, Raju KS, Singh SP, Wahajuddin. Dried blood spots in bioanalysis of antimalarials: Relevance and challenges in quantitative assessment of antimalarial drugs. Bioanalysis 2013;5:2171-86.15. 16. USFDA Guidance for Industry, Bioanalytical Method Validation. 2001.
Available from: www.fda.gov/downloads/Drugs/Guidances/ucm070107. pdf. [Last accessed on 2014 May 29].
17. DeSilva B, Garofolo F, Rocci M, Martinez S, Dumont I, Landry F, et al. 2012 white paper on recent issues in bioanalysis and alignment of multiple guidelines. Bioanalysis 2012;4:2213-26.
18. Denniff P, Spooner N. The effect of hematocrit on assay bias when using DBS samples for the quantitative bioanalysis of drugs. Bioanalysis 2010;2:1385-95.
19. Liu G, Snapp HM, Ji QC. Internal standard tracked dilution to overcome challenges in dried blood spots and robotic sample preparation for liquid chromatography/tandem mass spectrometry assays. Rapid Commun Mass Spectrom 2011;25:1250-6.
20. Clavijo CF, Hoffman KL, Thomas JJ, Carvalho B, Chu LF, Drover DR, et al. Asensitive assay for the quantifi cation of morphine and its active metabolites in human plasma and dried blood spots using high-performance liquid chromatography-tandem mass spectrometry. Anal Bioanal Chem 2011;400:715-28.
21. Taylor RR, Hoffman KL, Schniedewind B, Clavijo C, Galinkin JL, Christians U. Comparison of the quantifi cation of acetaminophen in plasma, cerebrospinal fl uid and dried blood spots using high-performance liquid chromatography-tandem mass spectrometry. J Pharm Biomed Anal 2013;83:1-9.
22. Jimmerson LC, Zheng JH, Bushman LR, MacBrayne CE, Anderson PL, Kiser JJ. Development and validation of a dried blood spot assay for the quantifi cation of ribavirin using liquid chromatography coupled to mass spectrometry. J Chromatogr B Analyt Technol Biomed Life Sci 2014;944:18-24.