International Journal of Information Science and Technology
SERVICE FAILURE-RECOVERY IN ONLINE SHOPS IN IRAN
L. Boroumand, MSc.
Department of Statistics and Informatics Management, Isfahan University of Medical
Science, I. R. of Iran
Corresponding Author: lboroumand@hotmail.com
M. Aghdasi, Ph.D.
Department of Social Economic Planning Tarbiat Modares University of Tehran,
I. R. of Iran
e-mail: Aghdasim@tmu.ac.ir
A. Albadvi, Ph.D.
Department of Information Technology Tarbiat Modares University of Tehran
I. R. of Iran e-mail: mail@Albadvi.net
M. Jamshidian, Ph.D. Department of Management, Isfahan University, I. R. of Iran
e-mail: mehdijus@yahoo.com;
Hakan Perzon, Ph.D. Department of Marketing, Lulea University of Technology, Sweden
e-mail: Hakan.Perzon@ltu.se
Abstract - Present article focuses on service failure and recovery in the online shops in Iran. The article investigates interaction between service failure and online shops readiness for service recovery and resulting impact on customer reaction. The datawas collected by an e-questionnaire from 615 Iranian online shoppers. The findings suggest, although many online shops are severely breaching few fundamental business principles, defection is not happening as vast as in other similar studies. Furthermore, winning the customers back via service recovery seems to be depended rather on the process than the outcome of service recovery, which is very similar to the findings of another study in Chinese environment. Discussion of the findings suggests the researchers and managers to be conscious of the possible impact of the culture and environment on customer’s responses to service failure and service recovery states.
Keywords: Service Failure, Service Recovery, Complaint Management, Iran, Online Shops.
INTRODUCTION
Highly competitive and dynamic service sector market of the last two decades of
twentieth century has changed its environment to e-market in the third millennium.
International Journal of Information Science & Technology, Volume 6, Number 2 July / December, 2008
market, computer brings the market to the customer. Consequently, customer has more
time to search in a particular service for more numbers of businesses than before. In
such a condition customer expectations increase and quality of services gets more
visible and becomes the center of attention.
At the same time, because of the variable nature of services, failure is an
unavoidable part of it, which has been identified [2,12] as the major cause of customer’s
defection. Keaveney [18] presents eight reasons behind service switching behavior out
of which three ones refer to service failure. Thus, because of the unavoidable negative
impact of service failure, customer’s retention becomes a key management activity.
Based on such state, the term of “service recovery” is coined to response to failure when
they occur [16]. On one hand, it has been recognized that a poor service recovery
response or lack of it can yield into aggravated dissatisfaction and certain customer
defection [16]. On the other hand, a successful service recovery can result in higher
customer satisfaction and loyalty than if no service failure has occurred [9,20]. An
effective service recovery which encourages customers to complain and respond
effectively will benefit the firm in that it not only wins the dissatisfied customers back,
but also enhances firm’s information about their shortages and what they have to do to
improve customer’s satisfaction.
Academic research on service failure and recovery is relatively recent and still
evolving. As far as the authors are concerned, no research has been done in this field in
Iranian environment, particularly, in its Internet environment. A research on the state of
service failure and recovery in Iranian e-shops is of much importance, since the Internet
usage in Iran is still young and is growing rapidly. The number of Internet users in Iran
has increased from roughly 1 million users in 2001 to approximately 5 million in 2003
[21]. Moreover, ONI [21] reports that TCI (Telecommunication Company of Iran)
expects such market to reach 25 million users by 2009. According to a Stanford
University Report [28], Internet usage is growing faster in Iran than anywhere else in
the Middle East.
Rapid explosion of Internet usage can be a great threat to e-companies if they do not
treat service failure and recovery in a conscious manner, while it could be a great
opportunity for retaining the customers in an opposite way.
In present paper, authors will not present the managerial complexities of the entire
service recovery process, but rather examine certain aspects of online shopping
experiences from a consumer’s perspective. Especially an attempt is made to describe
the frequency of service failure occurrence and recovery performance of the online
shops and the impact of each on the customer’s reactions and to compare the reaction
BACKGROUND
A term that is synonymously used for a problem that a customer has with a service is
“service failure” [27]. Service failures are inevitable and occur in both the process and
outcome of service delivery. In online business, just as the same as offline businesses,
service delivery fails when it can not deliver services as promised. In these situations,
there is a gap between customer’s expectations and performance of the system, which
leads into dissatisfaction. Some authors [5,18] determined failure as a major cause of
customer defection. To avoid such defections, literature suggests two kinds of strategies.
First is to get things right the first time [5], by proactive planning, training and
anticipating customer’s needs and possible service failure and eliminating the most
likely areas of them. Yet, service failures are not completely avoidable. Thus, if they
occur, the second type of strategy called service recovery should be activated in order to
satisfy and retain the unhappy customer. Service recovery could be considered as a
proactive process, which seeks out and deals with failure [16]. However, most of the
studies consider service recovery as a process, which should be invoked after the
complaint is reported. Service recovery is of crucial importance, because if successfully
implemented, it will lead into positive WOM (Word Of Mouth) and customer loyalty
[27]. Otherwise, poor implementation is a major cause of dissatisfaction [2,16] and
results in customer defection [3] and / or his exit [25].
Figure 1 presents a simplified overview of the service recovery framework and its
possible outcomes. By facing a service failure, customer behaves in different ways,
which is called Consumer Complaint Behavior (CCB). Hirschman [11] introduces CCB
as exit, voice, and loyalty. "Exit" refers to the termination of the relationship; "voice" is
the customer's efforts to maintain the relationship by pressurizing the firm to change its
practices, products and policies through complaints to seller; and finally "loyalty"
derivates customer's hope for improvements. The "voice" complaint behavior will help
the firm to improve customer satisfaction and retention by recovering “at risk”
customers [8].
Many customers do not bother to complain / voice [24]. They, instead, exit or
“infect” others. Thus, service recovery should have some strategies in place to increase
the voice rate. Two main strategies can be considered, first considering those activities,
which increase the customer’s willingness to complain. For instance, service guarantees
are a tactic for encouraging customers to complain [1]. The second strategy is related to
communication channels. In online businesses, in particular, customer should have
multiple channels to report complaints. These channels should make complain filling
hassle free and easy. In fact, in offline transactions, buyers interact with a seller and if a
International Journal of Information Science & Technology, Volume 6, Number 2 July / December, 2008
while in online shopping a buyer interacts with a mediating environment, which does
not detect service failure. Therefore, to voice quickly and easily is of much importance,
particularly in online environment [1]. Once the complaints are lodged, the recovery
procedures should be invoked, with the aim of satisfying customers.
Unfortunately, despite the critical impact of service recovery responses on customer
retention, many service providers look at complaints negatively and do not want to hear
about them. [5]. Bitner, et al. [2] and Hoffman, et al. [13] all point to lack or poorness of
responses in many firms, as a fact. Jelassi and Enders [15] root these problems to
managers who are mostly graduated from right answer schools and are not actively
aware of the value of failure. Boshhoff [4] presents “denial” as the source of
dissatisfaction, defection and negative WOM. Ahmad [1] found “willingness” of the
representative to solve the problem as a necessary element of an effective service
recovery, and reported 100% of those who had experienced denial as lost customers.
Yet, even, if the service provider acknowledges service failures and decides to
provide redress through recovery procedures, many options are available. However, the
effectiveness of the recovery strategy, which is the complete salvage of the customer's
problem, depends on many items such as type of failure [19], “level of atonements” [4],
type of service [26] and compensation.
Thus, not every service recovery process leads into complete salvage of the
problem. Boschhoff [4] identifies the consequences of "willingness/making effort" both
as dissatisfied or satisfied customers. In fact, his model depicts that the right
combination of service recovery options is the identifier of satisfaction, retention, and
WOM behavior. If this combination is not right and the problem is not solved, the
customer may not be satisfied. Similarly, 100% of lost customers is occurred if the
problem has not been resolved despite representatives’ efforts [1]. Anyhow, if the
service recovery is implemented effectively, it can restore customers to a satisfied or
delighted state [17] and result in positive WOM and loyalty [2,27].
ONLINE SHOP INDUSTRY IN IRAN
Based on EIU rankings [8], in 2002, among 60 countries, Iran has the 53th place in
e-readiness. Obviously, e-commerce is something new in Iran, but it is growing rapidly.
There is still no information available about online shops industry in Iran. A pilot test
has been conducted by the authors on a convenient sample of 15 online shop managers
to gain a realistic picture of this industry. These managers have been interviewed either
by phone or face-to face.
The pilot study revealed some main issues about online shop industry. The industry
be very young and neither has enough credit nor are decision makers of the family to
buy large volumes of items. Furthermore, many of them are said to buy just out of
curiosity. Yet, some buy particular goods, which are not available in their geographic
areas and some even started to buy such items online and distribute them in their own
area as a business. With regard to the payment-delivery process, Internet payment does
not exist by now (June 2005). Thus, payment is either through bank accounts or Cash
On Delivery (COD) system. Some of the online shops have contracts with post-office,
which allows them to distribute their goods widely across the country with COD
system. However, some who do not have such contracts have to sell their items to a
restricted geographic area or work with bank accounts. Many online shops complain
about the problems that they have in their business, which seem to be caused by weak
integration before and after main processes. Some of these problems are such as
problems with delivery and payment, inconsistency with their suppliers, problems with
their websites that have not been designed by themselves and did not provide them the
desired options, and finally problems with the staff to update the website regularly.
METHODOLOGY
Data of this study was collected by an e-questionnaire from 615 people, who have
shopped from Iranian online shops at least once. They were asked whether they have
had problems in their shopping. And those who confronted problems were further asked
about their subsequent experiences from service recovery.
Because of the little size of the online shoppers’ population and their widespread
across the country, "survey" was the most suitable method for this research.
Furthermore, among survey techniques, Internet survey was the best option because of
meeting anonymous desire and cost constraints. It also reduces the non-response error
by lowering the re-delivery cost, which is a major weakness among self-administered
surveys [6]. Many other issues were also taken into consideration in order to minimize
the non-response error. That is, e-mails in the form of cover letter were sent to the
address of each online shopper. The e-mails contained anonymous promises, monetary
incentives, well improved instructions for how to fill the questionnaire and an
introduction to survey sponsor who was a well-known brand among online shoppers.
Finally, there was a link to the questionnaire.
The questionnaire was selected from the study of Ahmad [1], which was a paper
questionnaire handed out to students in US. The original questionnaire tailored to
Iranian format and content, and its Internet environment, where the speed is low and
costs are high. These adjustments took place by three steps. First, calling 20 online
International Journal of Information Science & Technology, Volume 6, Number 2 July / December, 2008
questionnaire to web designers who had online shopping experiences to get ideas on
designing the e-questionnaire and finally sending 200 e-questionnaires and correcting it
base on replies.
The questionnaire consisted of four main parts: Demographic information, Internet
usage patterns, online shopping profile, and finally service failure-recovery experiences
and subsequent reactions. Main variables of the study, which are illustrated in Table 1
and Figure 1, are mainly in the fourth part of the questionnaire.
Table 1: Main variables of the questionnaire.
Variable Question Answer (Code)
Service failure Any bad experience with online shopping?
Voice: Did you try to contact the online shop Regarding your problem?
Voice: Were you able to contact the online shop?
Denial/ Acknowledgement
Did the online product/service provider
(online shop) make an effort to fix the problem?
Output of process Was the problem resolved to your satisfaction?
N (1) Y (2)
Retention Would you consider shopping at the E-commerce site in the future?
N (1) MB (2) Y (3)
WOM: Would you voluntarily recommend this e-commerce site to your friends?
SD (1) D (2) NL (3)
R (4) SR (5)
Abbreviations: N-No; Y-Yes; MB-Maybe; SD-Strongly Discourage;D-Discourage NL-Neutral; R-Recommend; SR-Strongly Recommend [1].
In this part, the customers were asked for any possible experience regarding
service failure-recovery with YES/NO answer. That is, customers were asked whether
they had bad experiences in their online shopping or not. If they had experiences of
service failure, the next two questions asked would be “if they were willing to
complain” and, in case of willingness, “if they were able to complain.” These two
questions check complaints or not. Again if the customers were able to complain, they
would be asked about their experiences with regard to representative’s responsiveness.
Finally, those customers who experienced representative’s acknowledgement were
asked whether their problems were completely resolved or not. Through such answers,
frequency of service failure and recovery performance could be achieved in the form of
percentages. Next, all the customers with different experiences from service
failure-recovery were asked for WOM (Word Of Mouth) and repurchase intentions in the
future, which are measured on a 5 and 3 point scale. Then, to this end, the impact of
different service failure-recovery experiences on customer reactions was investigated.
Expectations (E) Performance (P) P<E Disconfirmation
P=E or P>E Confirmation Comparison
Voice: service recovery should -encourage complaints
-provide Communication modes
Acknowledgement & Willingness Denial
(Improved) satisfaction Dissatisfaction
Negative attitude towards Service provider (more) Positive Attitude
toward Service provider
Loyalty/ repeat purchases Positive WOM Negative WOM Lost customer
Loyalty
Dissatisfaction Satisfaction
Exit
Loyalty / repeat purchases
Positive word of mouth
The tech. of services- Correct combination of options
The tech. of services- wrong combination of options Expectations (E) Performance (P) P<E Disconfirmation
P=E or P>E Confirmation Comparison
Voice: service recovery should -encourage complaints
-provide Communication modes
Acknowledgement & Willingness Denial
(Improved) satisfaction Dissatisfaction
Negative attitude towards Service provider (more) Positive Attitude
toward Service provider
Loyalty/ repeat purchases Positive WOM Negative WOM Lost customer
Loyalty
Dissatisfaction Satisfaction
Exit
Loyalty / repeat purchases
Positive word of mouth
The tech. of services- Correct combination of options
The tech. of services- wrong combination of options Voice: service recovery should
-encourage complaints
-provide Communication modes
Acknowledgement & Willingness Denial
(Improved) satisfaction Dissatisfaction
Negative attitude towards Service provider (more) Positive Attitude
toward Service provider
Loyalty/ repeat purchases Positive WOM Negative WOM Lost customer
Loyalty
Dissatisfaction Satisfaction
Exit
Loyalty / repeat purchases
Positive word of mouth
The tech. of services- Correct combination of options
The tech. of services- wrong combination of options
Figure 1: Service recovery framework [4].
The main criterion for choosing the statistical sample was that the respondent
should have got at least one online shopping experience. Although a direct access to
online shoppers was impossible, online shops were not proper data collection sources.
That is, since the purpose of this study is to find out the “online shops” service recovery
performance and its impact on customer reaction, “online shops” may not provide us
with the real information of their performance and “customers” may not tell their real
reactions directly to the online shops. Consequently, the authors considered another
organization as a data collection source, which was known as pioneer of e-commerce in
Iran in the years 2003-2004 by the Ministry of Commerce of this country. This
organization supports online shops in different ways based on their request.
Such supports include: website design, offering global COD system and sending
advertising e-mails to online shoppers. Through this organization, authors found access
to 20000 unique online shoppers with its 38 under-support online shops. While selling
different products, these online shops were located in five provinces of Iran. Choosing
this organization as a data collection source was helpful in reaching a wide range of data
International Journal of Information Science & Technology, Volume 6, Number 2 July / December, 2008
Due to the disconnections of Internet and mail-server, about 13000 out of 20000
e-mails were sent properly. Yet, the authors did not re-send them, in order to avoid
duplicate e-mails to a single person. After two weeks, replies were collected and edited.
Finally, out of 750 replies only 615 records were totally completed, which were left for
classification and statistical computation.
RESULTS
The demographic characteristics show the information gathered of online shoppers are
from different segments. Different genders were included and they were from both
genders and age 15 to over 40, living in different geographic areas in Iran, with
educational spectrum of primary school to PhDs and different levels of income from
being jobless to being business owners. Furthermore, respondent's experiences have
been from 38 under-support online shops. Although some of the products, which
respondents mentioned were not purchased from the 38 mentioned online shops, they
were gathered from other online shops. Thus, the provided information is related to
more than only 38 online shops in Iran. Actually, it is related to any online shopping
experience of 615 Iranian online shoppers.
ONLINE SHOPPING PROFILE
Curiosity, access to unavailable/rare goods, and convenience respectively with 59%,
45% and 58% were the reasons mentioned by online shoppers. Approximately, 10% of
the shoppers experienced their first online shopping before one year ago; other 90%
have experienced it in the last 12 months (from June 2005). Furthermore, 48% of
shoppers had just one or two online shopping experiences and only 18% had more than
five shopping experiences. Just 0.2% of shoppers replied that they would not shop
online anymore. All the rest said that they will (81.6%) or may (18.2%) shop online in
the future.
SERVICE FAILURE OCCURRENCE AND RECOVERY PERFORMANCE
Problem avoidance rate was equal to 74.8%. That is, less than one third of the online
shoppers (25.2%) had experienced problems in their online shopping. From those who
confronted problems, 34.4% (53) were willing to repurchase from the particular shops.
Furthermore, 47% (24) were willing to repurchase, because they believed in
improvements or were looking doubtfully to the system. 14.2 % (8) of shoppers said
they had to buy from those shops because of their needs and having no other option.
to complain, out of which just 55.7% were able to contact the online shop. In fact,
44.3% of them were not able to contact the online shop to complain. In most of these
cases (71.4%), they had written e-mail to the online shop but never received any
answers. 22.8% had called the online shop but were confronted with busy lines or no
one answering the phone. Finally, 5.8% used both modes, yet they still were not able to
contact the representatives. Out of 44 online shoppers who were able to complain to the
online shop, 28 (63.6%) confronted a positive response from the online shop
representative and 16 (36.4) representatives did not try to solve their problems.
Figure 2: Online shopping pattern extracted from research analysis.
Some described confronting unrelated or negative replies from the representatives.
Ultimately, out of 28 problems, which online shops made effort to solve, only 18
problems (64.3%) were completely resolved (Figure 2).
IMPACT OF SERVICE FAILURE AND DIFFERENT STATES OF RECOVERY ON CUSTOMER REACTIONS
Impact of service failure variable on customer retention and WOM variables was tested
by Spearman correlation, which showed a significant negative relationship between
service failure and customer retention and WOM variables. That is, the correlation
between service failure and WOM had a result of p=0.00 and r = - 0.3 and service
failure and repurchase intention has also resulted in p=0.00 and r = - 0.3.
In order to describe the impact of service recovery states on customer WOM and
YES YES
YES
NO 25.2
(155)
51 (79)
55.7 (44)
63.6 (28)
49
(76) 44.3 (35) 36.4
(16)
YES
NO NO
NO 35.7 (10) NO
74.8 (460)
YES Bad
experience?
Able to contact? Willing to
contact?
Did the online shop make efforts to fix the problem?
Problem resolved?
International Journal of Information Science & Technology, Volume 6, Number 2 July / December, 2008
repurchase intention, the authors considered the following negative states of recovery:
Customer is “not willing” to complain; is willing to complain but “not able” to contact; is able to contact but confronts denial “no effort” of the service representatives. Service representative intended and tried to solve the problem after it
had been reported, however it had “not been resolved” completely; and the problem is reported and representatives effort to solve it concluded in a completely “resolved” state, which is the aim service recovery.
Author’s logic behind such consideration is two-folded. First, if the impact of the
positive states (i.e. being able to contact, etc.) on customer retention is tested, it could
never be known what has happened next to this customer, and the reactions might have
been a sequence of the next experiences. For instance, one may be able to contact the
online shop but has negative intentions because of confronting denial in the next step.
On the other hand, if the negative states are tested, what exactly could be known are the
positive and negative experiences of that customer. For instance, if a customer was not
able to contact, it would become clear that he/she had been willing to complain. When
customer’s intentions are analyzed, it could be clear whether it is related to the last
negative experience or to the pre-last positive experience. Table 2 and Table 3 provide
an overview of the retention and WOM information in different service recovery states.
Two tables depict high repurchase intention and positive WOM in “not resolved”
and “resolved” group and low repurchase intentions and low positive WOM in “not
willing”, “not able” and “ no effort” group. After this initial picture of the impact of
service recovery on retention and WOM, some tests were carried out.
Table 2: The impact of service recovery states on WOM extracted from research process.
Word of Mouth (frequency)
Status Strongly
Discourage Discourage Neutral Recommend
Strongly Recommend
No problem 0 (0) 0.7 (3) 7.2 (33) 54.1 (249) 38 (175) Not complaining 0 (0) 2.6 (2) 27.6 (21) 52.6 (40) 17.2 (13) Not able to
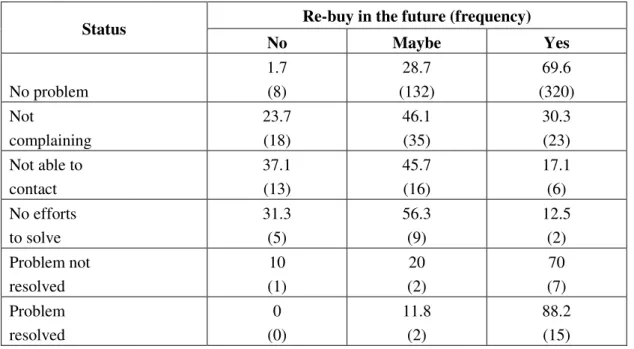
First, the variation of repurchase intention in different states has been tested (Table 3). Most of the customers who were in the first three states (i.e. not willing, not
able, no effort) had negative or neutral repurchase intentions as it has been 63.8%,
82.8% and 87.6% in “not willing”, “not able” and “no effort” respectively, whereas this
rate is much lower in those who have not experienced problems (30.4%). A
Kruskal-Wallis test among these three states (p=0.1) showed that repurchase intentions are not
significantly different among them (p=0.14). Yet, as we entered the “no problem” group
beside these three groups and repeated the Kruskal-Wallis test, it was shown the
existence of a significant difference (p=0.000). That is, if customer does not want or is
not able to complain or if his/her complains’ confronts are not considered by the
representatives, the customer is much more likely to be defected from the shop,
compared to those who did not faced problems at all.
Table 3: The impact of service recovery states on retention extracted from research process.
Re-buy in the future (frequency) Status
No Maybe Yes
No problem 1.7 (8) 28.7 (132) 69.6 (320) Not complaining 23.7 (18) 46.1 (35) 30.3 (23)
Not able to contact 37.1 (13) 45.7 (16) 17.1 (6) No efforts to solve 31.3 (5) 56.3 (9) 12.5 (2) Problem not resolved 10 (1) 20 (2) 70 (7) Problem resolved 0 (0) 11.8 (2) 88.2 (15)
Thus, these three states have all a negative impact on repurchase intention. Based
on this fact, it is clear that willingness and ability to complain are necessities of service
recovery.
Yet, a positive trend in repurchase intentions was obvious in those customers who
experienced the willingness to the online shop to solve their complaints, regardless of
whether their problems were solved or not. In fact, totally 70% in “not resolved” and
“88.2%” in “resolved” group were intended to repurchase from the particular shop, in
the future. As was expected, a Kruskal-Wallis test showed a significant difference
(p=0.013) between the three above-mentioned similar-negative states and “not
International Journal of Information Science & Technology, Volume 6, Number 2 July / December, 2008
changes the behavior of Iranian customers in a positive manner. Moreover, a
Man-Whitney test between “not resolved” and “resolved” groups showed no significant
differences (p= 0.2) in repurchase intentions of these two groups. The comparison of
these two recent groups with “no problem” group by Kruskal-Wallis, as well, showed
no significant differences (p= 0.248). Thus, it seems that just willingness to solve the
customer’s problem is quite enough to win back the Iranian customer to a normal state,
regardless of resolution of the problem.
In the next step, WOM has been analyzed in the same manner. As it could be seen in Table 2, people voted for negative or neutral WOM as much as 30.2% , 37.2% and
66.7% respectively in three groups of “ not willing”, “not able” and “no effort”, which
in turn, depicts a negative behavior in these groups compared to that rate in the group of
“no problem” (i.e. 7.9%). Man-Whitney and Kruskal-Wallis tests were used for two and
more than two independent samples (i.e. states). Actually, “not willing” and “not able”
were not significantly different (p=0.2) in WOM; besides negative WOM was
significantly (p=0.00) more in these two groups than in “no problem” group. At the
same time, Kruskal-Wallis showed a significantly (p=0.00) more negative WOM in “no
effort” group compared to the two similar-negative states. That is, WOM has a negative
trend in “not willing” and “not able” and particularly in “no effort” group compared to
those who do not have problem in the first place.
Just as the same as repurchase intentions trend, it can be seen positive WOM in “not
resolved” and “resolved” group, which is not significantly different from “ no problem”
group. That is, willingness and efforts to solve customer’s problems have been enough
to improve the WOM, regardless of what the outcomes of these efforts have been (i.e.
problem solved or not solved).
CONCLUSIONS AND DISCUSSIONS
The author’s findings suggest unwillingness to complain, lack of chance to complain
and particularly, confronting no efforts from online shops with regard to solving
reported problems, creation of negative WOM and repurchase intentions. Such finding
complies with Ahmad [1], Blodgett, et al. [3], Hart, et al. [9] and Singh [25], in that the
poor service recovery has let to negative repurchase intentions and WOM. Yet, these
findings are different from Ahmad [1] in that extent, that the reactions of USA online
shoppers are much more negative than Iranian shopper. In fact, Ahmad has reported
100% defection and negative WOM in each of these states while this rate has been
(NWOM=2.9% - defection=37.1%) in “not able” and (NWOM=26.7% - defection=
31.3%) in “no effort” in Iran.
new to this system, they may not have an initial negative attitude to poor recovery.
However, according to Boschhoff [4], if the failure will be repeated for them, the
resulting dissatisfaction may gradually result in overall negative attitude toward the
firm. Thus, it may witness higher rates of negative WOM and repurchase intentions of
those who experience poor recovery in the future. This matter can be unveiled by
further researches. However, it is important to notice that this is not the only possible
reason for the existing difference.
One alternative interpretation for the existence of such a difference could be
referred to lower expectation of Iranian customers. In this case, author’s finding is
supporting Hui and Kevin [14] result. They state PRC customers have much lower
expectations on service quality (i.e. service recovery) than industrialized countries due
to their underdeveloped service industry. He concludes that Chinese awareness of
consumer rights and existence of consumer protection laws are far behind that of
western. Thus, seeking redress is much less than in industrialized countries.
Furthermore, COD payment system, which has been used in many online shops in
Iran (June 2005), may also cause lower recovery expectation of Iranian customers.
Actually, the failures might be less serious in this kind of payment system than in
common Internet payment (i.e. pre-paid) systems, because in COD the customer will
pay money when he/she accepts the parcel. Consequently, since expectations from
service recovery differ based on the type of failure [16], Lower recovery expectations
could be assumed in Iranian COD-based systems.
Interestingly, authors’ findings also revealed that Iranian customers are significantly
driven to positive WOM and repurchase intentions when they just confront online shops
willingness to solve their problems. Furthermore, it seems that positive behaviors in this
state are not significantly different (i.e. less) from when the problem is completely
resolved. Yet, many studies show "complete problem resolution" as a determinant of
positive behaviors. For instance, Boschhoff [4] illustrates a model in which the
customer reactions after service recovery were depended on whether the right process is
implemented or not. In addition, Rust, et al. [24] and Hays and Hill [10] have not
distinguished problem resolution into efforts/willingness and problem resolution, yet
Hays and Hill [10] denote the not resolved group as dissatisfied customers, and the
resolved group as satisfied ones. Rust, et al. [24] reported 60% repurchase intentions in
the not resolved group compared to 90% in the resolved group. Moreover, Ahmad [1]
reports 100% defection and 88.9% NWOM in the group of customers who confronted
unsuccessful efforts of online shops, whereas this rate falls to 0% in the problem
completely resolved group.
One interpretation for the existence of such a difference could be lower customer
International Journal of Information Science & Technology, Volume 6, Number 2 July / December, 2008
recovery strategies. Yet, it should be noticed in the present case we would expect higher
positive reactions to “complete resolution”. However, this is not the case and positive
WOM and repurchase intention in the “problem completely resolved” group are not
significantly higher than that of the “not resolved” group. This statistical result might
have been achieved because of the low rate of cases in the last branches of Figure 2.
Actually, the percentage of repurchase intention has been 18% more in the “resolved
group” compared to the “not resolved” group, as it is 88.2% against 70% and it is 94.1%
against 80% for WOM. Yet, further research with larger samples is needed to disclose
this matter. To reach higher level of samples in last branches, more than 750 responses
should be received in the first place, which initially needs a sample of more than 12000
online shoppers.
If lower expectation would not be the case, another alternative explanation for the
difference might be the impact of cultures. Some studies such as Hui and Kevin [14]
have provided theories which interpret perceptions of the fairness of service recovery
processes as cultural dependants. This means some service recovery processes may be
of varied importance to different nations. In this case, “making effort” should be of
great importance to Iranian people. In this regard, author’s finding on Iranian shopper
matches with that of Hui and Kevin [14] on Chinese people.Hui and Kevin [14] define
Chinese to be of "collectivists" culture who are more conscious in their relationship
with other people and put high values on conflict avoidance, group harmony, and
respect. Chinese rather seem to be responsive to the fairness of the process of service
recovery, which could be a symbol of respect. If we consider Iranians as collectivists,
their positive responses to “representatives’ willingness and efforts to solve their
problems” (i.e. service recovery process) might be because of their respect perception of
this process. Yet, this study has not focused on the fairness/respectfulness of the service
recovery process. It just disclosed that Iranian customers are likely to differ in their
responses to service recovery strategies. Further research can reveal this difference in
more details, especially if it would be conducted on an old and stable industry of Iran.
IMPLICATIONS
The most important point for Iranian managers of online shops that should be taken into
consideration is that the sales figure seems to be unreliable since many people said to
buy online out of curiosity. In addition, this number is increasing tremendously as it has
increased from 20000 in June 2005 at IrPostStore to 80000 in Oct 2005. It actually
seems that more and more people are hearing about the new system and like to test it.
Thus, as Porter [22] says, notice should be taken not to correlate the revenue with
Another noteworthy issue for managers is to know that the number of online shops is
being multiplied rapidly as it has risen from 38 online shops in June 2005 (just in
IrPostStore system) to 158 online shops in OCT 2005. The major reason to that is
mentioned as low barriers to entry, which is a danger sign [22]. In such a high
competitive market, managers should concentrate attention on retaining rather than
attracting new customers [23].
Furthermore, findings revealed service failure and poor responses have negative
impact on customer repurchase intention and WOM. Yet, this negative impact may
worsen, as the service failure happens repeatedly and/or competition becomes higher.
The high rate of new customer’s should not neglect the managers of the long-term
impact of service failures and poor service recovery responses, which are happening in
high rates in Iran by now.
Getting it right the first time is the first and best strategy in dealing with failures [5],
since there is no guarantee on the outcome of service recovery. Service failures should
be avoided as much as possible through proactive planning, training, anticipating
customer needs and possible service failures and eliminating the most likely areas of
them instead of reactive fixing of failures [5].
In the case of service failure occurrence, effective service recovery should be in
place to retain the customers who have confronted failures. Since Iranian customer
seems to be rather influenced by the process of service recovery than its outcome,
managers should be aware that the effectiveness of service recovery strategies might be
different from elsewhere. Thus, since service recovery is a battleground in which stakes
are high and outcome is uncertain, its effectiveness should be first redefined in Iranian
environment. Otherwise, service recovery may just happen to be a waste of money.
REFERENCES
[1] Ahmad, S., “Service Failure and Customer Defection.” Managing Service Quality,
Vol. 12, No. 1, pp. 19-29, 2002.
[2] Bitner, M. J., et al., “The Service Encounter: Diagnosing Favorable and Unfavorable
Incidents.” Journal of Marketing, Vol. 54, No. 1, pp. 71-84, 1990.
[3] Blodgett, J. G., et al., “The Effects of Customer Service on Consumer Complaining
Behavior.” Journal of Services Marketing, Vol. 9, No. 4, pp. 31-42, 1995.
[4] Boshhoff, C., “An Experimental Study of Service Recovery Options.” International
Journal of Service Industry Management, Vol. 8, No. 2, pp. 110-130, 1997.
[5] Caranage, D., “Plan to Do it Right: and Plan for Recovery.” International Journal of
International Journal of Information Science & Technology, Volume 6, Number 2 July / December, 2008
[6] Cooper, D. R. and Schindler P. S., Business Research Methods. Eight Edition,
McGraw-Hill Inc., 2003.
[7] EIU, “The 2003 E-Readiness Rankings.” Available: at <http://graphics.eiu.com/
files/ad_pdfs/eReady_2003.pdf>, 2003.
[8] Fornell, C. and Wernerfelt, B., “Defensive Marketing Strategy by Customer
Complaint Management: A Theoretical Analysis.” Journal of Marketing
Research, 24 November, pp. 337-346, 1987.
[9] Hart, C. W. L., et al., “The Profitable Art of Service Recovery.” Harvard Business
Review, July-August, pp. 148-156, 1990.
[10] Hays, J. M. and Hill, A. V., “The Market Share Impact of Service Failures.”
Production and Operations Management, Vol. 8, No. 3, pp. 208-220, 1999.
[11] Hirschman, A. O., Exit, Voice and Loyalty: Responses to Decline in Firms,
Organizations, and States. Harvard University Press, Cambridge, MA., 1970.
[12] Hoffman, D. K., et al., “Customer Defection Analysis: A Critical Incident
Approach.” in Stern, B. B. and Zinkhan, G. M. (Eds.), Proceedings of the
American Marketing Association Summer Educators Conference, American
Marketing Association, Chicago, IL, pp. 346-352, 1995.
[13] Hoffman, D. K. and Kelley, S. W., “Perceived Justice Needs and Recovery
Evaluation: A Contingency Approach.” European Journal of Marketing, Vol. 34,
No. 3-4, pp. 418-432, 2000.
[14] Hui, M. K. and Au Kevin, Y., “Justice Perceptions of Complaint-Handling: A
Cross-Cultural Comparison between PRC and Canadian customers.” Journal of
Business Research, Vol. 52, pp. 161-173, 2001.
[15] Jelassi, T. and Enders, A., Strategies for E-Business: Creating Value through
Electronic Commerce and Mobile Commerce. England: Prentice Hall Press, 2005.
[16] Johnston, R., “Service Failure and Recovery: Impact, Attributes and Process.”
Advances in Services Marketing and Management: Research and Practice, Vol. 4,
pp. 211-228, 1995.
[17] Johnston, R. and Fern, A., “Service Recovery Strategies for Single and Double
Deviation Scenarios.” The Service Industries Journal, Vol. 19, No. 2, pp. 69-82,
1999.
[18] Keaveney, S. M., “Customer Switching Behavior in Service Industries: An
Exploratory Study.” Journal of Marketing, Vol. 59, pp. 71-82, 1995.
Setting.” TheJournal of Services Marketing, Vol. 15, No. 7, pp. 583-596, 2001.
[20] Michel, S., “Analyzing Service Failures and Recoveries: A Process Approach.”
International Journal of Service Industry, Vol. 12, No. 1, pp. 20-33, 2001.
[21] ONI, “Internet Filtering in Iran in 2004-2005.” Available: at <http://www.
opennetinitiative.net/studies/iran>, 2005.
[22] Porter, M. E., “Strategy and the Internet.” Harvard Business Review, March,
pp. 63-78, 2001.
[23] Reichheld, F. F. and Schefter, P., “E-Loyalty: Your Secret Weapon on the Web.”
Harvard Business Review, July-August, pp. 105-113, 2000.
[24] Rust, R. T., et al., “Making Complaints a Management Tool.” Marketing
Management, Vol. 1, No. 3, pp. 41-44, 1992.
[25] Singh, J. V., “Exit and Negative Word-of-Mouth Behaviours: An Investigation
across Three Service Categories.” Journal of the Academy of Marketing Science,
Vol. 18, No. 1, pp. 1-15, 1990.
[26] Smith, A. K., et al., “A Model of Customer Satisfaction with Service Encounters
Involving Failure and Recovery.” Journal of Marketing Research, Vol. 36, No. 3,
pp. 356-372, 1999.
[27] Spreng, R. A., et al., “Service Recovery: Impact on Satisfaction and Intentions.”
Journal of Services Marketing, Vol. 9, No. 1, pp. 15-23, 1995.
[28] Stanford Report, “In Print and on the Air.” Available: at <http://news-service.

![Figure 1: Service recovery framework [4].](https://thumb-us.123doks.com/thumbv2/123dok_us/8037240.2128204/7.892.136.763.178.663/figure-service-recovery-framework.webp)