Lucrări ştiinŃifice Zootehnie şi Biotehnologii, vol 41 (2) (2008),Timişoara
STUDY REGARDING THE CORELATION BETWEEN
TOTAL GERMS COUNT AND CHEMICAL COMPOSITION
IN RAW MILK
STUDIU PRIVIND CORELA
ł
IA DINTRE NUM
Ă
RUL TOTAL
DE GERMENI
Ş
I COMPOZI
ł
IA CHIMIC
Ă
A LAPTELUI
ACATINCĂI S., MARCU ADELA, CZISZTER L.T., STANCIU G., GAVOJDIAN D., BAUL SIMONA
Faculty of Animal Sciences and Biotechnologies, Timişoara, România
The aim of this study was to quantify the correlations between total germs count (TGC), the major chemical compounds in raw milk (fat, proteins and lactose) and milk acidity. Studies were carried out on Romanian Black and White cows, from March 2005 until March 2006 at the Didactical farm from the Banat University of Agricultural Sciences Timişoara. TGC was higher during the warm season (March 2005 – September 2005) 721400 – 841750 cfu/ml milk compared with cold season (October 2005 – March 2006) when values ranged between 635250 and 873000 cfu/ml milk. There weren’t any significant differences between seasons for this trait. Obtained results showed that among TGC, major chemical compounds (fat, proteins and lactose) and milk acidity there weren’t any statistically proven correlations.
Key words: milk, TGC, chemical composition, correlations
Introduction
After joining the E.U., Romania had to change the standards for milk quality according with the E.U. regulations. Milk quality is established taking into consideration chemical composition and total germs count (TGC) (1, 3) that should comply with the quality norms imposed on the market by the E.U. regulations.
Cow milk is indispensable for human nutrition. The nutritive value of milk is determinate by chemical composition equilibrate and rich in fats, proteins, carbohydrates, mineral salts and vitamins and by the hygiene of milk (3, 5).
Cow’s selection for milk yield is based on milk and fat quantity on a normal lactation. Economic efficiency of cow farms is also influenced by nutritive and hygienic qualities of milk. Consumers form Romanian market are more and more informed and want to be sure that milk and products obtained from milk sold in the stores are made according with quality and hygiene regulations. Those regulations are presented in specific Romanian laws (2, 4).
deficiencies and bad milk treatment between milking and delivery to milk processing units.
The number of bacteria from milk is an important indicator of milk quality. This indicator offers precise information about milking hygiene and the way milk was kept.
Milk processing units offer different prices for milk according with the number of bacteria from milk and other milk quality parameters. The main purpose for farmers is to produce milk with number of germs as small as possible and very high biologic value. To obtain these results, farmers must know how to handle the main parameters that influence the milk quality.
The aim of this paper was to quantify the correlations between the total germs count and chemical composition of milk.
Materials and Methods
Studies were carried out on Romanian Black and White cows from Didactical farm of the Banat University of Agricultural Science Timişoara. Physical and chemical analyses were made on bulk tank raw milk from the Didactical farm, for a year, during March 2005 and February 2006.
Laboratory analyses were made on samples taken in the morning and in the evening milking. Samples were collected in sterile bottles of 500 ml, and processed in maximum four hours from milking time (for TGC).
During collection and processing samples were kept at refrigerator temperature (+4oC). Chemical composition analyses and milk acidity were made on milk collected in the evening and stored in the refrigerator until the next morning.
The analyses for major chemical compounds (fat, proteins, lactose and solids non-fat) were made using modern methods with the help of MilkoScan S54B (samples are analyzed in infrared with one ray) and the analyses for acidity and TGC with the help of classic methods.
The experimental period was divided in two sub periods:
- warm season: the time between March 2005 and September 2005; - cold season: the time between October 2005 and March 2005. In both seasons average values and dispersion indices for studied parameters were calculated. The correlation between TGC and major chemical compounds in milk was calculated using the Spearman test.
Results and Discussions
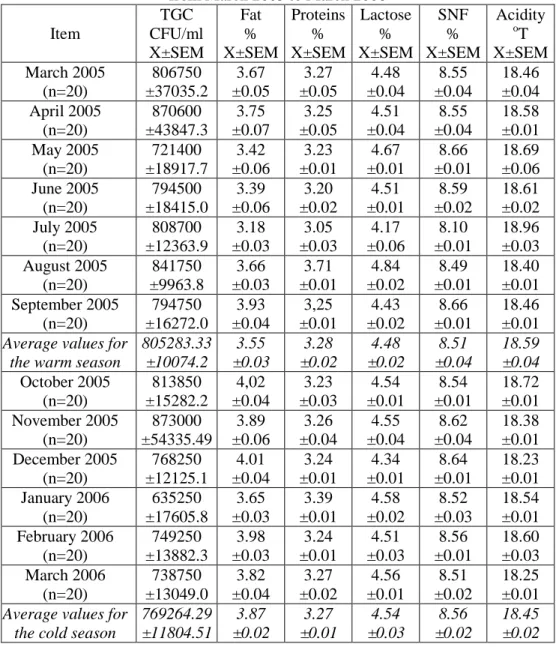
Table 1 presents the average values and dispersion indices for studied parameters and Table 2 reveals the correlations between TGC and main components in milk.
Table 1 Average and dispersion indices for TGC, physical and chemical parameters in milk
from March 2005 to March 2006
Item TGC CFU/ml X±SEM Fat % X±SEM Proteins % X±SEM Lactose % X±SEM SNF % X±SEM Acidity o T X±SEM March 2005 (n=20) 806750 ±37035.2 3.67 ±0.05 3.27 ±0.05 4.48 ±0.04 8.55 ±0.04 18.46 ±0.04 April 2005 (n=20) 870600 ±43847.3 3.75 ±0.07 3.25 ±0.05 4.51 ±0.04 8.55 ±0.04 18.58 ±0.01 May 2005 (n=20) 721400 ±18917.7 3.42 ±0.06 3.23 ±0.01 4.67 ±0.01 8.66 ±0.01 18.69 ±0.06 June 2005 (n=20) 794500 ±18415.0 3.39 ±0.06 3.20 ±0.02 4.51 ±0.01 8.59 ±0.02 18.61 ±0.02 July 2005 (n=20) 808700 ±12363.9 3.18 ±0.03 3.05 ±0.03 4.17 ±0.06 8.10 ±0.01 18.96 ±0.03 August 2005 (n=20) 841750 ±9963.8 3.66 ±0.03 3.71 ±0.01 4.84 ±0.02 8.49 ±0.01 18.40 ±0.01 September 2005 (n=20) 794750 ±16272.0 3.93 ±0.04 3,25 ±0.01 4.43 ±0.02 8.66 ±0.01 18.46 ±0.01 Average values for
the warm season
805283.33 ±10074.2 3.55 ±0.03 3.28 ±0.02 4.48 ±0.02 8.51 ±0.04 18.59 ±0.04 October 2005 (n=20) 813850 ±15282.2 4,02 ±0.04 3.23 ±0.03 4.54 ±0.01 8.54 ±0.01 18.72 ±0.01 November 2005 (n=20) 873000 ±54335.49 3.89 ±0.06 3.26 ±0.04 4.55 ±0.04 8.62 ±0.04 18.38 ±0.01 December 2005 (n=20) 768250 ±12125.1 4.01 ±0.04 3.24 ±0.01 4.34 ±0.01 8.64 ±0.01 18.23 ±0.01 January 2006 (n=20) 635250 ±17605.8 3.65 ±0.03 3.39 ±0.01 4.58 ±0.02 8.52 ±0.03 18.54 ±0.01 February 2006 (n=20) 749250 ±13882.3 3.98 ±0.03 3.24 ±0.01 4.51 ±0.03 8.56 ±0.01 18.60 ±0.03 March 2006 (n=20) 738750 ±13049.0 3.82 ±0.04 3.27 ±0.02 4.56 ±0.01 8.51 ±0.02 18.25 ±0.01 Average values for
the cold season
769264.29 ±11804.51 3.87 ±0.02 3.27 ±0.01 4.54 ±0.03 8.56 ±0.02 18.45 ±0.02
From data presented in Table 1 results that TGC has higher values during the first 9 months of control and lower values in the last four months.
between the two seasons was small. There weren’t any significant differences between the two seasons for this parameter (p>0.05).
The improvement in milk hygienic quality during the last four months of control is due to improvements in milking hygiene and milk keeping conditions.
Results about the variation of chemical parameters in milk (fat, proteins, lactose, SNF) are presented in Table1.
Data presented in Table 1 shows that during the studied period milk fat presented small differences among the controls. The higher values were found in the cold season (October 4.01% and December 4.02%).
There were significant differences for milk fat percent between the cold season 3.87% and the warm season 3.55% (p<0.05).
Proteins and lactose from milk varied in small limits. In both cases in the cold season values were higher but there weren’t any significant differences.
Solids non-fat percent is influenced by the proportion of proteins, lactose and mineral salts in milk. Difference between the two seasons was 0.4%, which did not reached the statistical significance level (p>0.05).
Milk’s acidity presents small differences among the controls and ranged within normal limits (15-19oT).
Acidity grows with time from milking, number of bacteria’s in milk and milk storage temperature.
Milk acidity was determinate after samples were kept 12 hours in the refrigerator and because of this obtained values were close to maximum limit admitted for this parameter.
The correlation between TGC and major chemical parameters was made with the help of Spearman test.
Table 2 presents data about the correlation between TGC and major chemical parameters (fat, proteins and lactose) and milk acidity.
Data presented in Table 2 reveals that there aren’t correlations between TGC, major chemical parameters (fat, proteins and lactose) and milk acidity.
Table 2 Correlation between TGC and major chemical parameters
(from March 2005 until March 2006)
Item Fat Proteins Lactose Acidity
TGC 0.037943 0.092889 0.045645 0.040599
Conclusions
Number of bacteria in milk (TGC), varied in tight limits indifferent of the season.
There were significant differences for milk fat between the cold season 3.87% and the warm season 3.55% (p<0.05).
Milk acidity presents smalls differences among the controls and ranges in normal limits (15-19oT). Milk acidity was determined after samples were kept 12 hours in the refrigerator and because of this values were close to maximum admitted limit for this parameter.
There aren’t correlations between TGC, major chemical parameters (fat, proteins and lactose) and milk acidity
Bibliography
1. Acatincăi S. (2004) – ProducŃiile bovinelor. EdiŃia a II-a. Ed. EUROBIT, Timişoara
2. Acatincăi S., Marcu Adela, Cziszter L.T., Ferencz Andreea, Tripon I. – Study regarding the influence of season and lactation order on milk yield, major components and somatic cell count of milk. Scientifical papers Animal sciences and Biotechnologies (2007), vol. 40(2), Timişoara, p. 501
3. Cziszter L.T. (2003) - Dirijarea funcŃiei glandei mamare. Ed. EUROSTAMPA, Timişoara
4. Cziszter L.T., Stanciu G., Acatincai S., Baul Simona, Erina Silvia, Tripon I. – Study on some factors influencing the milk somatic cell count in
Romanian Black and White cows. Lucr. ŞtiinŃifice Zootehnie şi Biotehnologii,
Timişoara, vol XXXVIII, 2005, P. 259