A Churn Resilience Technique on P2P Sensor Data Stream Delivery System
Using Distributed Hashing
Tomoya Kawakami
Graduate School of Information Science, Nara Institute of Science and Technology, Ikoma, Nara, Japan E-mail: [email protected]
Tomoya Kawakami, Yoshimasa Ishi, Tomoki Yoshihisa and Yuuichi Teranishi Cybermedia Center, Osaka University, Ibaraki, Osaka, Japan
E-mail: [email protected], [email protected]
Yuuichi Teranishi
National Institute of Information and Communications Technology, Koganei, Tokyo, Japan E-mail: [email protected]
Keywords:sensor data, data stream, delivery cycle, distributed processing, churn resilience
Received:July 16, 2015
Recently, sensor data stream delivery system that collects sensor data periodically and delivers succes-sively has been attracting great attention. As for this sensor data stream delivery, receivers are possible to require the same sensor data stream with different delivery cycles. Our research team proposed methods to distribute communication loads by relay nodes in the case of delivering the sensor data streams that have different data delivery cycles. However, in the previous methods, since the specific node builds delivery paths and notifies related nodes, the assigned node is required to be updated when the related nodes churn. Therefore, in this paper, we propose a churn resilience technique that enhances the robustness of delivery system. We confirmed in simulations that the proposed technique improves the reliability of the delivery system.
Povzetek: Razvita in stestirana je nova metoda za asinhrono pošiljanje in zbiranje toka podatkov.
1
Introduction
In recent years, various types of applications such as video delivery and environmental monitoring have been possi-ble, and therefore, sensor data stream delivery where sen-sor data is periodically collected and delivered successively has been attracting great attention. As for this sensor data stream delivery, it is possible for the same sensor data stream to have different collection periods depending on the receivers. In the case where a live video of a solar eclipse taken from a camera is delivered, for example, the video is delivered at 30 fps to personal computers con-nected to the Internet through a wire and is delivered at 10 fps to mobile computers connected to the Internet through a 3G channel while moving.
It is general in sensor data stream delivery that sensor data gained by one sensor is shared by a large number of users. Currently, various P2P-based techniques for dispers-ing the communication load of the deliverer (source) have been proposed in the data streaming [1–10]. In these re-searches, the same sensor data stream is delivered to a num-ber of terminals (destinations), the communication load of the source is dispersed by sending the received data to other
destinations. When the delivery cycle is different, the sen-sor data stream whose delivery cycle is a common divisen-sor of required cycles can be delivered to all of the destinations if the delivery cycles are in a multiple relationship or can be approximated as having a multiple relationship. How-ever, the destinations receive redundant data which are not included to the times of each required cycle.
We have proposed techniques for sensor data stream de-livery system in P2P model [11, 12]. In our previous tech-niques, destinations having a long delivery cycle transmit the sensor data stream to other destinations so that the load of the source is dispersed. However, in the previous meth-ods, since the specific node builds delivery paths and noti-fies related nodes, the assigned node is required to be up-dated when the related nodes churn.
2
Addressed problems
2.1
Assumptions
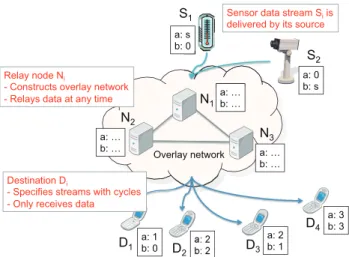
We assume that computers (nodes) to relay sensor data streams constructs P2P overlay network in the sensor data stream delivery system. The sensor data stream deliv-ery system distributes the delivdeliv-ery loads to the nodes and keeps high scalability in an environment where there are a huge number of sensor data streams and destina-tions. Sensor data streams are periodically sent from their sources through the Internet and delivered to destinations by the hops among nodes. Destinations request sensor data streams with those delivery cycles to a specific node also through the Internet. We assume that selectable delivery cycles for each sensor data stream are given. Nodes are able to send sensor data to other nodes anytime, and sensor data are distributed for each sensor data stream and time.
The sensor data streams are denoted by Si (i =
1,· · · , l), destinations are denoted byDi(i = 1,· · · , m), and nodes areNi (i= 1,· · · , n). Figure 1 shows a model of delivery system. In Figure 1, the number of sensor data streams isl = 2, the number of destinations ism= 4and the number of nodes isn= 3. The ‘a’ represents the sen-sor data streamS1, and the ‘b’ represents the sensor data
stream S2. The delivery cycles are shown near sources,
nodes and destinations in Figure 1. The ‘s’ represents the source of sensor data stream, and the numbers near desti-nations are requested delivery cycles from each destination. In the case where the delivery cycle is 0, it means that the destination does not request the sensor data stream. This corresponds to case where a live camera acquires an im-age once every second, and D1 does not view the image,
D2 and D3 view the image once every second, and D4
views the image once every three seconds, for example. In this paper, we assume that selectable delivery cycles for each sensor data stream are given and are represented byCi (i= 1,2,· · ·). The sensor data delivery system assigns de-livery cycles or times to relay sensor data streams to nodes. The nodes send and receive various sensor data each other on specific times.
2.2
Objective function
In sensor data stream delivery, it is important to avoid con-centrating of processes and loads to a specific computer or network because the processing time affects and accumu-lates a delay of delivery. Therefore, in this paper, we aim to distribute communication loads to relay nodes on sensor data stream delivery system.
The communication load of the nodeNi is given as the total of the load due to the reception of the sensor data stream and the load due to the transmission. The communi-cation load due to the reception is referred to as a reception load, and the reception load ofNi isIi. The communica-tion load due to the transmission is referred to as transmis-sion load, and the transmistransmis-sion load ofNiisOi.
D1 D
2 D3
D4 S1 S2 N2 N1 N3 a: 1
b: 0 a: 2 b: 2
a: 2 b: 1 a: 3 b: 3 a: … b: … a: … b: … a: … b: … a: s b: 0 a: 0 b: s
Sensor data stream Si is delivered by its source
Overlay network
Relay node Ni
- Constructs overlay network - Relays data at any time
Destination Di
- Specifies streams with cycles - Only receives data
Figure 1: System model.
In many cases, the reception load and the transmission load are proportional to the number of sensor data pieces per unit hour of the sensor data stream to be sent and re-ceived. The number of pieces of sensor data per unit hour of the sensor data stream that is to be received byNifrom
Nj or Sk (i 6= j; i, j = 1,· · ·, n; k = 1,· · ·, l) is
R(Nj, Ni)orR(Sk, Ni). In addition, the number of pieces of sensor data per unit hour of the sensor data stream that is to be sent byNi toNj orDk (i 6= j;i, j = 1,· · ·, n;
k= 1,· · · , m) isR(Ni, Nj)orR(Ni, Dk). The loadsLi,
IiandOiofNiare given in the following equations:
Li = Ii+Oi (1)
Ii = α n
X
j=1
R(Nj, Ni) +α l
X
k=1
R(Sk, Ni) (2)
Oi = β n
X
j=1
R(Ni, Nj) +β m
X
k=1
R(Ni, Dk) (3)
whereαandβ are loads with which one piece of sensor data is received and sent, respectively.
The communication loadSLof the entirety of the system is given by the following equation:
SL=
n
X
i=1
Li (4)
In addition, the following fairness index (FI) is often used as an index for load dispersion:
FI=( Pn
i=1Li)
2
nPn
i=1L 2
i
(5)
3
Robustness enhancement
technique
3.1
Previous methods
We have proposed techniques for a P2P model where such an environment that a number of destinations collect the sensor data stream during different cycle is assumed so that the load of the source is dispersed [11]. In addition, we have proposed a method which determines relay nodes based on distributed hashing and constructs delivery paths autonomously by each node [12].
The previous method using distributed hashing devides nodes into groups represented by the combination of sen-sor data stream and delivery cycle. In addition, the previous method assigns delivery times to nodes for each group of delivery cycle. The previous method distributes processes by assigning a node based on delivery time. In addition, the previous method avoids concentrating loads to a spe-cific node and time by assigning a node for each group of delivery cycle. However, in the previous methods, since the specific node builds delivery paths and notifies to re-lated nodes, the assigned node is required to be updated when the related nodes churn.
3.2
Redundancy of node assignment by
successor list
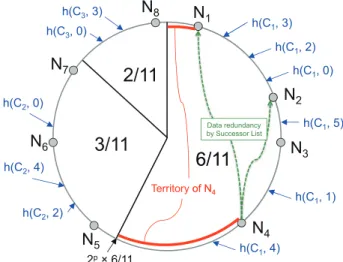
In the sensor data stream delivery, the number of data to send/receive varies among different delivery cycles. The shorter the delivery cycle is, the larger the number of data and the load are. Therefore, the previous method using distributed hashing first generates circular hash spaces for each sensor data stream and puts nodes on hash spaces based on the distributed hashing of the combination of sensor data stream and node ID. After that, the previous method divides each hash space into partial hash spaces as groups for each delivery cycle. By this process, partial hash spaces of the shorter cycle have the more nodes. The size of each partial hash space is determined based on its cycle. For example, in the case where the selectable delivery cy-cles areCi=i(i= 1,2,3), the ratio of the sizes of partial hash spaces is1/C1 : 1/C2 : 1/C3 = 1/1 : 1/2 : 1/3 = 6 : 3 : 2. The previous method treats each partial hash space as circular and assigns related times for each cycle to nodes on its partial hash space. In the case where there are no nodes on the partial hash space, the previous method assigns the partial hash space to the nearest neighbor node on the next partial hash space. In addition, the previous method determines the root node on the partial hash space of the shortest cycle based on distributed hashing such as the least common multiple of cycles. The root node first receives data from the source of sensor data stream.
In this paper, we propose a churn resilience technique that enhances the robustness of delivery system by a suc-cessor list used in Chord [13]. Figure 2 shows an example of the case where the number of nodes isn= 8, cycles are
Figure 2: Assignment to a group of cycle.
Require:
cycles: Arrangement of delivery cycles of the nodes sorted in ascending order (cycle of source node is−1and at index 0)
ownId: An identification of own (node)
assignedCycleIndex: An index of own assigned delivery cycle incycles
succCount: The length of a successor list
1:cycleLcm←calculateLCM(cycles);
2:ifassignedCycleIndex6= 0
orsearchNode(0,cycleLcm,0)6=ownIdthen 3: time←0;
4: whiletime<cycleLcmdo
5: assignedNode
←searchNode(assignedCycleIndex,time,0);
6: ifassignedNode=ownIdthen
7: longCycleIndex
←calculateLongestCycleIndex(cycles, time,0);
8: relayNode;
9: iflongCycleIndex=assignedCycleIndexthen 10: relayNode←searchNode(0,cycleLcm,0);
11: succList;
12: succNode←ownId;
13: fori←0tosuccCountdo
14: succNode←successor(succNode);
15: succList.add(succNode);
16: end for
17: else
18: succNodeIndex
←random(0,succCount+ 1);
19: relayNode←searchNode(
longCycleIndex,time,succNodeIndex);
20: end if
21: requestToSend(relayNode,ownId,time);
22: end if
23: time←time+cycles[assignedCycleIndex];
24: end while 25: end if
Figure 3: Pseudocode to construct delivery paths by nodes.
Ci =i(i= 1,2,3), the size of a hash space is2p, and the length of the successor list is 2. In Figure 2, the beginning values of each partial hash space are2p×0/11,2p×6/11, and2p×9/11.
Require:
cycles: Arrangement of delivery cycles of the nodes sorted in ascending order (cycle of source node is−1and at index 0)
ownId: An identification of own (destination)
requestCycleIndex: An index of request delivery cycle incycles
succCount: The length of a successor list
1: cycleLcm←calculateLCM(cycles);
2: time←0;
3: whiletime<cycleLcmdo 4: targetCycleIndex
←getRandomCycleIndex(cycles, time);
5: succNodeIndex
←random(0,succCount+ 1);
6: relayNode←searchNode(
targetCycleIndex,time,succNodeIndex);
7: requestToSend(relayNode,ownId,time);
8: time←time+cycles[requestCycleIndex];
9: end while
Figure 4: Pseudocode to construct delivery paths by desti-nations.
to the longest cycle on each time receives data from root node and sends to the nodes that belong to the other cy-cle groups. The node that does not belong to the longest cycle group on each time searches the node on the longest cycle group and requests to send data. On the other hand, the node that belongs to the longest cycle group on each time searches the root node of the sensor data stream and requests to send data. Figure 3 shows the pseudocode to construct delivery paths by a node.
In the the pseudocode on the Figure 3, the least common multiple of the selectable delivery cycles is calculated in the line 1. The case shown in the line 2 is a case where this node does not belong to the shortest cycle group or is not the root node. The case shown in the line 6 is a case wheretimein the cycle group is assigned to this node, and the case shown in the line 9 is a case where the cycle group of this node is the longest cycle at time. In the line 10, the root node is searched as a sender to this node attime. Successor node is searched in the line 14, and the searched node is added to the successor list in the line 15. Successor node that receives data is selected at random in the line 18, and the node that belongs to the longest cycle group and
succNodeIndexis searched as a sender to this node attime
in the line 19. Finally, delivery path from the relay node at
timeis constructed in the line 21.
Similarly destinations first calculate the least common multiple of selectable delivery cycles for each sensor data stream. After that, the destinations determine the cycle group for each time at random among the related cycles. The destinations search the senders in the determined cy-cle groups for each time and request to send data. Figure 4 shows the pseudocode to construct delivery paths by a des-tination.
In the the pseudocode on the Figure 4, the least common multiple of the selectable delivery cycles is calculated in the line 1. The cycle group able to send attimeand suc-cessor node that receives data are selected at random in the line 5. After that, the node that belongs to the selected cy-cle group andsuccNodeIndexis searched as a sender to this destination attimein the line 6. Finally, delivery path from
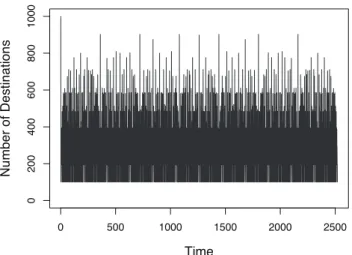
Figure 5: The number of desitinations for the longest cycle group at each time.
the relay node attimeis constructed in the line 7.
4
Evaluation
4.1
Simulation environment
In this section, we evaluate the proposed technique using distributed hashing in Section 3 by simulation. In the simu-lation environment, the number of nodes isn= 27= 128,
the number of sensor data streams isl = 27 = 128, and the number of destinations ism= 1000. The delivery cy-cles that destinations request areCi = i (i = 1,· · · ,10) and determined at random from 1 to 10 for each sensor data stream. In this environment, the maximum of the least common multiple of delivery cycles is 2520, and then the timetable for delivery is from time 0 to time 2519.
As an evaluated value, we calculated the load of each node, system total loads (SL), and fairness index (FI) among the time of the least common multiple of selectable delivery cycles. We executed this simulation 10 times for each method and environments described later. We calcu-lated the average of the results.
4.2
Number of influenced destinations
Figure 5 shows the number of destinations that cannot re-ceive the data stream in the case where the assigned node of the longest cycle group on each time churns.
Figure 6: Maximum instantaneous number of destinations for each cycle group.
Figure 7: Total number of destinations for each cycle group.
data stream in the case where the assigned node of the cy-cle group 10 at time 0 churns. Similarly, the longest cycy-cle group and the number of destinations are different among times, and the number of influenced destinations changes as shown in Figure 5. However, the successor list in our proposal makes this influence of node changes reduced.
Figure 6 shows the maximum instantaneous number of destinations for each cycle group and time. In addition, Figure 7 shows the total number of destinations for each cycle group.
In our assumptions, the longer cycle groups such as over 6 have the higher probability to become the longest cy-cle for each time. Therefore, the longer cycy-cle groups have the larger number of influenced destinations per unit time shown in Figure 6. On the other hand, the shorter cycle groups such as 1 deliver to destinations for more times. Therefore, the shorter cycle groups have the larger num-ber of the total influenced destinations between time 0 to 2519 as shown in the Figure 7.
4.3
Results by the length of successor list
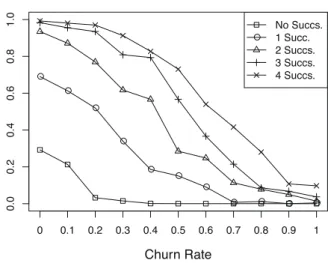
Figure 8, Figure 9 and Figure 10 show the minimum of the instantaneous system reliability in the proposed
tech-Figure 8: The minimum of instantaneous system reliability in the constant scenario.
Figure 9: The minimum of instantaneous system reliability in the Gaussian scenario.
nique and an environment where the number of successors is0,· · · ,4. The instantaneous system reliability shows the rate of destinations each time that receive data successfully. Figure 8 is the result in the case where the churn rate of nodes is constant to the value on the lateral axis. Figure 9 is the result in the case where the churn rate of nodes is individually determined based on the Gaussian distribution with the mean being the value on the lateral axis and the dispersion being 1. Figure 10 is the result in the case where the churn rate of nodes is individually determined at ran-dom from 0 to 1. The longitudinal axis is the minimum of the instantaneous system reliability.
Figure 11, Figure 12 and Figure 13 show the average of the instantaneous system reliability in the proposed tech-nique and same environment. The longitudinal axis is the average of the instantaneous system reliability.
Figure 10: The minimum of instantaneous system reliabil-ity in the random scenario.
Figure 11: The average of instantaneous system reliability in the constant scenario.
large even if there are a few successors. Therefore, the suc-cessor list is effective to enhance the robustness and relia-bility of the delivery system.
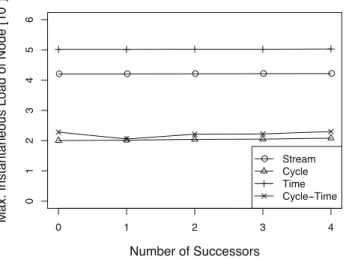
Figure 14 shows the maximum instantaneous load in an environment where the number of successors is 0,· · ·,4. The maximum instantaneous load is the maximum load for each node and time. The longitudinal axis is the maximum instantaneous load, and the lateral axis is the number of successors. In Figure 14, the difference of the maximum instantaneous load is small in this simulation environment. In the same environment, Figure 15 shows the maximum load of node, Figure 16 showsSL, and Figure 17 showsFI. Also the differences in those results are small in this simu-lation environment. Therefore, the maintenance cost of the successors is not influenced largely in the case where the number of destinations is especially higer than the number nodes.
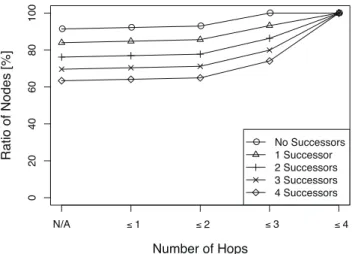
Figure 18 shows the rate of the number of hops to each node at time 0 in an environment where the number of suc-cessors is0,· · · ,4. The lateral axis is the number of hops, and the longitudinal axis is the rate of the nodes that re-ceive data under the number of hops. The nodes shown as
Figure 12: The average of instantaneous system reliability in the Gaussian scenario.
Figure 13: The average of instantaneous system reliability in the random scenario.
“N/A” do not receive data at time 0 because other nodes in the same cycle group are assigned to time 0. In Figure 18, the nodes shown as “N/A” are reduced in the longer suc-cessor list because the nodes that receive data at time 0 are increased. Although the rate of the number of the higher hops are increased in the longer successor list, all of the nodes receive data under four hops.
Figure 19 shows the rate of the number of hops to each destination at time 0 in the same environment. The longi-tudinal axis is the rate of the destinations that receive data under the number of hops. Although the rate of the number of the higher hops are increased in the longer successor list, all of the nodes receive data within five hops.
5
Related work
Various techniques for dispersing the communication load in the delivery of streams have been proposed [14].
di-Figure 14: Maximum instantaneous load by the number of successors.
Figure 15: Maximum load by the number of successors.
vided into a pull type technique and a push type technique. In a pull type technique, such as PPLive1, DONet [1], and SopCast2, the reception terminal that receives data requests
data from another terminal and acquires it. Although the reception terminal find terminals that have not yet been re-ceived the requested data, no redundant communications are carried out. In a push type technique, such as AnySee, data is sent from the transmission terminal that sends data to another terminal [2]. Although the transmission termi-nal find termitermi-nals that have not yet received the requested data, no such redundant communications are carried out. A technique combining a pull type and a push type, such as PRIME, has been proposed [3].
In P2P stream delivery techniques, a case where the same data stream is delivered to a number of terminals is assumed. In the delivery of the sensor data streams, how-ever, there are cases where a data stream of the same sensor having different delivery cycles is delivered. In this case,
1http://www.pplive.com/
2http://www.sopcast.com/
Figure 16: Total sytem loads by the number of successors.
Figure 17: Load balance by the number of successors.
sensor data streams having different delivery cycles are de-livered as different data streams.
Several techniques for preventing the communication load from being concentrated on a particular terminal by constructing a data delivery path, which is referred to as a multicast tree, in advance so that a data stream is deliv-ered have been proposed [6–10]. In the ZIGZAG method, a multicast tree is constructed by clusters that are collec-tions of terminals [7]. The number of clusters included in each depth of a multicast tree is made the same, and thus, the load is dispersed. Multicast trees are constructed only of information gained in the application layer, and it is not necessary to understand the physical network structure.
con-Figure 18: Rate of nodes by the number of hops to delivery.
Figure 19: Rate of destinations by the number of hops to delivery.
sideration the communication delay between only some ter-minals, though the physical network structure cannot be understood [9].
P2P sensor data stream delivery systems must be ro-bust and resilient against node churn because P2P net-works have high flexibility and always variable. Currently, techniques related to the churn resilience have been pro-posed [15–17], and also an analytical framework that al-lows to model retrieval times has been proposed [18]. In this paper, we applied a successor list to P2P sensor data stream delivery system to accommodate heterogeneous cy-cles, and we can also apply these related works, e.g., a logic layer named Dechurn that uses the complementary nature of node joining and leaving [16].
6
Conclusion
In this paper, we proposed a churn resilience technique that enhances the robustness of delivery system by a successor list in Chord. Validated through evaluation, the reliability of the delivery system is improved.
In the future, we will study an algorithm to calculate the appropriate length of the successor list each time because the required system reliability changes by applications, sit-uations, and so on.
Acknowledgement
This research was partly supported by the collaborative re-search of National Institute of Information and Commu-nications Technology (NICT) and Osaka University (Re-search on high functional network platform technology for large-scale distributed computing). This research was partly supported by the Strategic Information and Com-munications R&D Promotion Programme (SCOPE) of the Ministry of Internal Affairs and Communications.
References
[1] X. Zhang, J. Liu, B. Li, and T.-S. P. Yum, “Cool-Streaming/DONet: A data-driven overlay network for peer-to-peer live media streaming,” in Proceed-ings of the 24th Annual Joint Conference of the IEEE Computer and Communications Societies
(IN-FOCOM 2005), Mar. 2005, pp. 2102–2111.
[2] X. Liao, H. Jin, Y. Liu, L. M. Ni, and D. Deng, “Any-see: Peer-to-peer live streaming,” inProceedings of the 25th IEEE International Conference on Computer
Communications (INFOCOM 2006), Apr. 2006, pp.
1–10.
[3] N. Magharei and R. Rejaie, “PRIME: Peer-to-peer receiver-driven mesh-based streaming,” in Proceed-ings of the 26th IEEE International Conference on
Computer Communications (INFOCOM 2007), May
2007, pp. 1415–1423.
[4] L. Yu, X. Liao, H. Jin, and W. Jiang, “Integrated buffering schemes for P2P VoD services,”
Peer-to-Peer Networking and Applications, vol. 4, no. 1, pp.
63–74, 2011.
[5] S. Sakashita, T. Yoshihisa, T. Hara, and S. Nishio, “A data reception method to reduce interruption time in P2P streaming environments,” inProceedings of the 13th International Conference on Network-Based
In-formation Systems (NBiS), Sep. 2010, pp. 166–172.
[6] S. Banerjee, B. Bhattacharjee, and C. Kommareddy, “Scalable application layer multicast,” inProceedings of the ACM Conference on Applications, Technolo-gies, Architectures, and Protocols for Computer
Com-munications (SIGCOMM 2002), Aug. 2002, pp. 205–
217.
[7] D. A. Tran, K. A. Hua, and T. Do, “ZIGZAG: An efficient peer-to-peer scheme for media streaming,”
of the IEEE Computer and Communications Societies
(INFOCOM 2003), vol. 2, Mar. 2003, pp. 1283–1292.
[8] X. Jin, W.-P. K. Yiu, S.-H. G. Chan, and Y. Wang, “On maximizing tree bandwidth for topology-aware peer-to-peer streaming,”IEEE Transactions on
Mul-timedia, vol. 9, no. 8, pp. 1580–1592, Dec. 2007.
[9] K. Silawarawet and N. Nupairoj, “Locality-aware clustering application level multicast for live stream-ing services on the Internet,”Journal of Information
Science and Engineering, vol. 27, no. 1, pp. 319–336,
2011.
[10] T. A. Le and H. Nguyen, “Application-aware cost function and its performance evaluation over scalable video conferencing services on heterogeneous net-works,” inProceedings of the IEEE Wireless Commu-nications and Networking Conference: Mobile and Wireless Networks (WCNC 2012 Track 3 Mobile and
Wireless), Apr. 2012, pp. 2185–2190.
[11] T. Kawakami, Y. Ishi, T. Yoshihisa, and Y. Teranishi, “A P2P-based sensor data stream delivery method to accommodate heterogeneous cycles,”Journal of
In-formation Processing (JIP), vol. 22, no. 3, pp. 455–
463, Jul. 2014.
[12] ——, “A load distribution method based on dis-tributed hashing for P2P sensor data stream deliv-ery system,” in Proceedings of the 3rd IEEE In-ternational Workshop on Modeling and Verifying of Distributed Applications (MVDA 2014) in Conjunc-tion with the 38th Annual InternaConjunc-tional Computer, Software and Applications Conference (COMPSAC
2014), Jul. 2014, pp. 716–721.
[13] I. Stoica, R. Morris, D. Liben-Nowell, D. R. Karger, M. F. Kaashoek, F. Dabek, and H. Balakrishnan, “Chord: A scalable peer-to-peer lookup protocol for internet applications,” IEEE/ACM Transactions on
Networking, vol. 11, no. 1, pp. 17–32, Feb. 2003.
[14] Z. Shen, J. Luo, R. Zimmermann, and A. V. Vasi-lakos, “Peer-to-peer media streaming: Insights and new developments,”Proceedings of the IEEE, vol. 99, no. 12, pp. 2089–2109, Oct. 2011.
[15] S. Legtchenko, S. Monnet, P. Sens, and G. Muller, “RelaxDHT: A churn-resilient replication strategy for peer-to-peer distributed hash-tables,” ACM
Transac-tions on Autonomous and Adaptive Systems (TAAS),
vol. 7, no. 2, Article 28, Jul. 2012.
[16] X. Meng, X. Chen, and Y. Ding, “Using the comple-mentary nature of node joining and leaving to han-dle churn problem in P2P networks,”Computers and
Electrical Engineering, vol. 39, no. 2, pp. 326–337,
Feb. 2013.
[17] C. Hu, M. Chen, C. Xing, and G. Zhang, “Explor-ing the optimal substream schedul“Explor-ing and distribu-tion mechanism for data-driven P2P media stream-ing,” vol. 44, pp. 14–25, May 2014.
[18] L. Pamies-Juarez, M. Sanchez-Artigas, P. García-López, R. Mondéjar, and R. Chaabouni, “On the in-terplay between data redundancy and retrieval times in P2P storage systems,” Computer Networks: The International Journal of Computer and