Swarm Intelligence and its Application in Abnormal Data Detection
Bo Liu, Mei Cai and Jiazong Yu
College of Information Science and Technology, Jinan University, Guangzhou, China E-mail: [email protected]
Keywords: swarm intelligence, abnormal data, detection, ACO, PSO, BCO Received: June 18, 2014
This study addresses swarm intelligence-based approaches in data quality detection. First, three typical swarm intelligence models and their applications in abnormity detection are introduced, including Ant Colony Optimization (ACO), Particle Swarm Optimization (PSO), Bee Colony Optimization (BCO). Then, it presents three approaches based on ACO, PSO and BCO for detection of attribute outliers in datasets. These approaches use different search strategies on the data items; however, they choose the same fitness function (i.e. the O-measure) to evaluate the solutions, and they make use of swarms of the fittest agents and random moving agents to obtain superior solutions by changing the searching paths or positions of agents. Three algorithms are described and explained, which are efficient by heuristic principles.
Povzetek:Opisane so tri metode z roji za analizo kvalitet podatkov: na osnovi mravelj, delcev in čebel.
1
Introduction
Swarm Intelligence (SI) is a branch of Artificial Intelligence that is used to model the collective behaviour of social swarms (groups of agents) in nature, such as ant colonies, honey bees and bird flocks[1]. Each agent can not only interact with its local environment and other agents, but also respond to environmental change immediately, such that it can always find its objective. Swarm-based algorithms have emerged as a family of nature-inspired, population-based algorithms that are capable of producing low-cost, fast and robust solutions to several complex problems[2][3]. [4][5][6] introduce a slice of new developments made in the theory and applications of bio-inspired computation. For instance, Cui et al.[7] proposed the artificial plant optimization algorithm with detailed case studies, and Yang et al.[8] edited a special issue on meta-heuristics and swarm intelligence in engineering and industry.
Data quality mining (DQR) is a new and promising application of data mining techniques for the detection, quantification and correction of data quality deficiencies in very large databases. Typical data mining techniques, such as clustering, classification, association analysis, have been used to discover abnormal data in databases[9][10]. Recently swarm-based DQR approaches have also been developed. For example, Alam et al.[11] proposed SI-based clustering approaches for outlier detection, and Jindal et al.[12] surveyed of SI in intrusion detection.
The motivation of this study is dedicated to the application of SI in data quality mining, which explores new approaches for abnormal data discovery, avoiding searching the whole data space, such that improves efficiency and accuracy in abnormal data detection. The paper introduces typical SI models, and investigate their applications in abnormal data or behaviour detection. It discusses the inadequacy of current SI-based solutions in
abnormal data detection, and proposes new approaches utilizing three SI models for detection of abnormal attributes.
The rest of this paper is organized as follows: in Section 2, typical SI models are introduced. We give a survey of SI-based methods for outlier detection in Section 3. New approaches based on SI for abnormal attribute detection are presented in Section 4, and the paper concludes with our final remarks in Section 5.
2
Typical SI models
SI was first introduced by G. Beni and J. Wang in the global optimization framework as a set of algorithms for controlling robotic swarm [13], which has become one of popular natural computing[14] areas. The most popular models of SI include: Ant Colony Optimization (ACO), Particle Swarm Optimization (PSO) and Bee Colony Optimization (BCO). The main ideas of the three models are discussed below.
There is no single ‘Ant Model’, rather there is a
which was proposed by Dorigo and colleagues[18] as a method for solving combinatorial optimization problems. PSO was introduced by J. Kennedy et al.[19]. This is a population-based optimization technique inspired by the social behaviour of bird flocking and fish schooling. It was observed that large numbers of birds often change direction suddenly, and scatter and regroup. The synchrony of flocking behaviour is thought to be a
function of the birds’ efforts to maintain an optimum
distance between themselves and their neighbours. PSO researchers have implemented such natural processes to solve optimization problems in which each single solution, called a particle, joins other individuals to make up a swarm (population) for exploring within the search space. Each particle has a fitness value calculated by a fitness function, and a velocity of moving towards the optimum[20]. The PSO process starts by creating random particles and initializing the best positions for each particle and for the whole population. It then iterates the computation of the positions and velocities of each particle movement and the update of the local best position for each particle and the global best position for the entire swarm. PSO has been continually modified trying to improve its convergence properties, and the PSO variants have been used to solve a wide range of optimization and inverse problems [21].
BCO was proposed by D. Karabago as a new member of the family of SI algorithms[22]. In nature, bees reach a nectar source by following a nest-mate who has already discovered a patch of flowers. When a forager bee (recruiter) decides to attract more bee mates to a newly-discovered good food source, it returns to the hive and starts performing what is known as the waggle dance to communicate spatial and profitability information about the discovered food source, and recruit more honey bees (dancer followers) to exploit it [1]. BCO is based on a swarm of artificial bees cooperating together to solve a problem. First, a bee, named InitBee, settles to find a solution with good features. From this first solution a set of other solutions called SearchArea is determined by using a certain strategy. Then, every bee will consider a solution from SearchArea as its starting point in the search, and communicates the best visited solution to all its neighbours. However, if after a period of time the swarm observes that the solution is not improved, it introduces a criterion of diversification, preventing it from being trapped in a local optimum [23].
3
Survey of SI-based methods for
outlier detection
An abnormity is an object that does not conform to the normal behaviour of a dataset. Because abnormal data are very much in the minority in a dataset, they are also called outliers or noises. Although abnormal data or outliers may not be errors, detecting them is the most valid way to eliminate errors. There are two kinds of outliers: class outliers and attribute outliers[24]. Class outliers are records or tuples belonging to rare categories or labelled with wrong classes, and attribute outliers are attribute values deviating from the normal distribution or
error attribute values in dataset records. In other words, they are at two levels: the record level and the attribute value level.
Many studies have used traditional data mining or machine learning techniques to discover outliers, which need training on classifying rules, data patterns, or clustering instances of the dataset. There are also several approaches based on SI without training for detecting outliers, which are simple and heuristic. We focus on SI-based solutions in the rest of this study.
In [12], an ACO-based approach of clustering was proposed as a data preprocessing procedure, during which outliers can be detected. In this process, the continuity of ants for similar data points and dissimilar data points is collected into the next nodes. Each ant of the data points compares their property values according to the initial data point set, checks the importance of the data points and iteratively updates the values of the pheromones laid by other ants. Lastly, the data point selection matrix for obtaining final clustering results using another algorithm is generated; at the same time, those unselected data points are outliers. Without setting the number of clusters and initial centre points, the ACO-based clustering method can obtain the high clustering correctness rate and outlier filtering rate.
Alam et al.[11] proposed a SI-based clustering technique called Hierarchical PSO Based Clustering (HPSO-clustering) for outlier detection. HPSO-clustering uses a partitional approach to generate a hierarchy of clusters. The initial generation consists of the entire swarm. The swarm is then evolved towards a single cluster by merging two clusters of the swarm in each successive generation. For each particle of the swarm, updating of the position is continued until the particle comes to its most suitable position inside the cluster and becomes the true representative of the centroid. The cluster-based approach helps to find outliers based on their distance to the centroids. Less dense data falling at considerable distances from the centroid of the nearest cluster are considered as potential outliers.
Intrusion detection in computer networks is one of the common areas of application of outlier detection. There are some intrusion detection approaches based on ACO, PSO and BCO, and most of them categorize the detected behaviour into normal or abnormal, thus, in a sense, the intrusion detection problem is reduced to a classification or clustering problem[25]. Several examples are given below.
typically much smaller in size.
Most of the PSO-based intrusion detection systems (IDS) are hybrid anomaly detection systems, Kolias et al. [25] classified them into: (a) hybrid PSO-Neural Network Systems, (b) hybrid PSO-Support Vector Machine Systems, (c) hybrid PSO-K-means Systems and another category containing intrusion detection systems that employ PSO for the extraction of classification rules. In addition, Osama et al.[30] proposed an approach using BCO as a search strategy for subset generation, and using Support Vector Machine (SVM) as the classifier based on the selected feature subset, in which the feature selection is one of the prominent factors influencing the quality of intrusion detection systems. In this approach, first, an initial scout bee population is randomly generated, then the fitness of all the bees in the population is measured iteratively. The bees that have the highest fitness are selected as elite bees and the sites visited by them are chosen for neighbourhood search. At the end, SVM is trained based on the best feature subset.
As a whole, SI-based approaches have several advantages over other techniques. More specifically, SI techniques aim to solve complex problems by employing multiple but simple agents without a need for any form of supervision. Every agent collaborates with others toward finding the optimal solution via direct or indirect communication (interactions). These agents are used for discovering classification rules, clusters in anomaly detection[25].
However, to our knowledge, existing SI-based approaches have focused on discovering class level abnormities; and no SI-based approaches for discovering attribute level abnormities in a dataset have been studied. In reality, attribute abnormities happen more frequently, and correcting abnormal attributes rather than eliminating the tuple outliers has advantage of retaining information. Koh et al.[31] gave some statements: class outliers are often the result of one or more attribute outliers, and even when attribute outliers do not affect class memberships, they may still interfere with data analysis; in addition, many real world datasets do not contain class attributes or distinct clusters, and it is meaningful to identify attribute outliers which may be source errors. Thus we will study new approaches based on SI for attribute outlier detection in the following.
4
New ideas on SI approaches for
attribute outlier detection
Some studies[9][24] have used attribute correlation analysis to detect attribute outliers in a dataset, but the time complexity of these algorithms is very high. A distribution-based approach[32] eliminates attribute values that do not fit into the distribution models of the dataset, but the accuracy largely depends on the best-fit distribution models used[31].
In this section, we will discuss SI approaches for attribute outlier detection. The main motivation for using SI in the discovery of outliers is that they perform a global search and cope better with attribute interaction, and the time complexity will be reduced.
ID Name Gender City Province Country 1 L-199 F Guangzhou Guangdong China 2 L-200 M Guangzhou Guangdong China 3 L-201 M Nanning Guangxi China 4 L-202 F Guangzhou Guandon China 5 L-203 M Nanchang Jiangxi China
Table 1: An example of a dataset R.
4.1
Outlier measurement
Rarity is not an indicator of attribute outliers, and observations should be drawn from the correlation behaviour of attributes. Three measures, namely, the O-measure, the P-measure and the Q-O-measure, are provided in [31]. We use the O-measure in our approach. Related definitions referred to by [31] are described as follows.
Definition 1 (support) Let R be a relation with m
attributes A1,A2,……,Am. Let S be a projection on R over attributes Au,..., Av, i.e. S =∏Au,..., Av(R). The support of a tuple s in S, denoted by sup(s), is the count of the tuples in R that have the same values for attributes Au,….Avas item set s.
For example, in Table 1, let S = ∏City, Province (R), sup(Guangzhou, Guangdong) = 2, sup(Nanning, Guangxi) = 1.
Definition 2 (Neighbourhood) Let tuple s =
<au,……, av>. Suppose Av is the target attribute, the
extent of deviation of which we are interested in determining. The neighbourhood of Avw.r.t s is defined as N(Av, s) = < au,……,av− 1>. The support of N(Av, s) is
the count of tuples in R with the same values au,……, av
−1for Au,….Av− 1.
For example, in Table 1, let S = ∏City, Province(R), consider tuple s = <Guangzhou, Guangdong>, sup(N(Province, s)) = 3, sup(N(City, s)) = 2.
Definition 3 (O-measure) The O-measure of target
attribute Avw.r.t s is defined as
O-measure(Av, s) =
)) , ( sup(
)) , ( sup(
1
s A N
s A N
v v
u i
i
(1)
For example, let s = <Guangzhou, Guangdon, China> be a tuple of S = ∏City, Province, Country (R). The support of N(Province, s) is 3 while sup(N(Country, s)) and sup(N(City, s)) are both 1. The O-measure of the Province attribute w.r.t. s is (1 + 1)/3 = 0.6, i.e. O-measure(Province, s) = 0.6.
For comparison, we also compute the O-measure of the Province attribute in tuple t = <Guangzhou, Guangdong, China>. We have O-measure(Province, t) = (2 + 2)/3 = 1.33.
Consider a relation R with m attributes and n tuples. In the worst case, scanning all data subspaces (or projected relations) in R requires O(n×2m) searches, where 2mis the total number of projected relations on R. Therefore, computing the O-measure scores for each attribute w.r.t every projected relation requires O(2m×n×m) time complexity[31]. Obviously, the approach of searching all data subspaces of a relation for detecting outliers is highly inefficient. Thus, we make use of a swarm of agents to search heuristically and randomly.
Although different kinds of agents use different search strategies, if they use the same fitness function to evaluate the solutions, they tend to obtain a similar solution set. After stopping searching, the tuples having lower O-measure values (below a threshold) in the solution set include attribute outliers. This does not mean that they are all errors.
4.2
Overview of ACO for detecting
attribute outlier
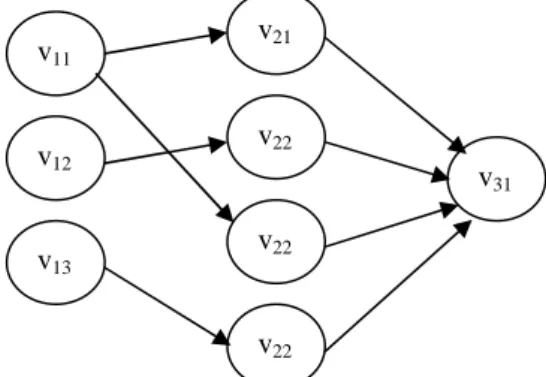
In a relational dataset, each tuple or its projection over some attributes can be represented as a path in a dataset graph (DG). A DG for a dataset with the attribute number m is defined as G = (V, E), where V is a set of all data items, i.e. V = {A = v| A is an attribute name, and v is a value in the domain of A}, and Viis a subset of V, which only includes data items related to the attribute Ai,
V Vi
m
i1
; E is a set of directed edges between two data items in each tuple, i.e. E = {<x, y >| x
Vi, y
Vj, i≠j}.For example, a dataset is shown in Table 1, and a DG for its projection S=∏Province, City, Country(R) is given in Figure 1, where
V = V1
V2
V3= {v11, v12, v13}
{v21, v22, v23, v24}
{v31}= {Guangzhou, Naning, Nanchang}
{Guangdong, Guangxi, Guangdon, Jiangxi}
{China}}Figure 1: A DG of the dataset projection in Table 1.
For a group of ants, the main steps in detecting attribute outliers by the constructed DG are shown as Algorithm 1.
Some explanations of Algorithm 1 are as follows:
●In step 2), the pheromone of each edge ei
(1≤i≤Edge_number) in DG is initialized as Equation (2),
where Edge_number is the edge number of DG.
number Edge
t
i
_ 1 )
0 (
(2)
Algorithm 1: The flow of ACO for detecting attribute outliers
1) Set ACO parameters (number of ants, pheromone evaporation rate, etc.);
2) Initialize the pheromone trails and create a null outlier table S;
3) Assign a group of ants to a start node of DG; 4) Each ant selects a path of DG by the transition rule; 5) Update pheromone trails;
6) Compute the O-measure of attributes from each ant’s
walking path and add or modify outlier information into table S;
7) Go to step 4) and repeat until the convergence and termination conditions are met.
●In step 2), the schema of outlier table S is (T, A, V, M), where T is a tuple ID on an ant traversed path, A is the target attribute name, V is the target attribute value of the tuple, and M is the O-measure of A for the tuple.
●In step 3), each of the start nodes is assigned the
same number of ants, and the degree of a start node is zero.
●In step 4), the probability that the adjacent edgeei
is chosen by the ant from node v is given by the Equation (3):
I e t t
P
j j
j j
i i
i
,) ( )
(
(3)
where
) sup(
1
i i
e
(4)
In Equation (3), I is the next adjacent edge set of node v,
i is a heuristic value of edge ei, vjand vkare twovertices of eiand sup(ei) is support of (vh, vk). From the
equation, it can be inferred that the less frequent (vh, vk)
is, the larger the heuristic value of eiis.
Pheromones placed on the edges in an ACO system play the role of a distributed long-term memory. This memory is not stored within the individual ants, but is distributed on the edges of the path, which allows an indirect form of communication. This benefits exploitation of prior knowledge. However, it increases the probability of choosing routes belonging to those previously traversed, thus inhibiting the ants from exhibiting a bias toward exploration. In order to enhance the role of exploration, we apply the following transition
rule for the ants’ selection of the next edge, whereq is a
random number in [0, 1] andis a parameter in (0, 1). if q≤φ then
select an edge randomly from I; else
choose eiwith max Pi;
end if
●In step 5), the pheromones of edges in the newest
v13 v11
v21
2
v22
v31 v12
v22
visited path P are updated by Equation (5), and the pheromones of other unvisited edges are normalized by Equation (6).
Q t t
t i i
i( 1) (1 ) () ()/
,
ei
P (5)
j j i
i t t
( 1) ( )/ ,
ei
P (6)In Equation (5), in [0,1] is the pheromone evaporation rate, which controls how fast the old visited path evaporates; Q=∑Sup(ei), ei
P, such that thesmaller Q is, the more the pheromone of the edge in P increases. In Equation (6),
j j
is the sum of the
pheromones of all edges.
●In step 6), for the newest selected path P, let the
tuple t consist of vertices on P, A is attribute set. Compute the measure of each attribute from P, i.e. O-measure(Ai, t), Ai
A, and obtain the minimum valueO-measure(Ak, t) among them; then search the tuple s in
table S where N(Ak, s[T]) = N(Ak, t) and s[A] = Akand s[V]≠t[Ak], and add or modify outlier information into table S by the following rule (call it Rule A).
Rule A:
if s exists then
if O-measure(Ak, t)<s[M] then
s[V]=t[Ak];
s[M] = O-measure(Ak, t);
end if; else
insert (t, Ak, t[Ak],O-measure(Ak, t)) into S;
end if.
4.3
Overview of PSO for detecting
attribute outliers
While ACO solves problems with search spaces that can be represented as a weighted construction graph, PSO solves problems with solutions that can be represented as a set of points in an n-dimensional solution space[1]. We regard each attribute value in a dataset as a point in the 2-dimensional space. The objective is to find the points that can minimize the fitness, i.e. the O-measure. The main steps for detecting attribute outliers in a given dataset by a swarm of particles are shown as Algorithm 2.
Algorithm 2: The flow of PSO for detecting attribute outliers
1) Set PCO parameters (number of particles, positive constants, etc.);
2) Initialize the swarm by assigning each particle to a velocity and a random position;
3) Evaluate the fitness for each particle’s position;
4) Update the solution table S and set or reset the best particle;
5) Update the velocities of all particles; 6) Move each particle to its new position;
7) Go to step 3) and repeat until the convergence and termination conditions are met.
Some explanations of Algorithm 2 are:
●In step 2), initialize the velocity of each particle to
be zero, i.e. vid= 0, vidrepresents the velocity of the ith particle in the dthdimension, where i = [1… particle
number] and d is 1or 2, where 1 represents the tuple dimension and 2 represents the attribute dimension. At the same time, assign each particle a random position, i.e.
pid, which represents the position of the ithparticle in the
dthdimension, where pi1is [1…tuple number] andpi2is [1…attribute number].
●In step 3), for the ithparticle, according to pi1and pi2, we know the particle is at the position of attribute Ak
of tuple t, for which the tuple ID is pi1and the attribute
ID is pi2, so the O-measure(A, t) can be calculated. ●In step 4), like the solution table used in ACO, the schema of the solution table S is (T, A, V, M), where T is a tuple ID, A is the target attribute name, V is the target attribute value of the tuple and M is the O-measure of A for the tuple. For the ithparticle, which is at the position of attribute Ak of tuple t, search the tuple s in table S
where N(Ak, s[T]) = N(Ak, t) and s[A] = Ak and s[V]≠t[Ak], add or modify the new information into table
S using Rule A presented in section 4.2.
Set or reset the global best particle that has the
swarm’s best fitness value (i.e. the minimum O-measure
value), and let it be the gthparticle.
●In step 5), thevelocity of each particle is updated by the following equation (7).
vid(t + 1) = vid(t) + c1R1(pid(t)−xid(t))
+ c2R2(pgd(t)−xid(t)), (7)
where
pgd represents the position of the swarm’s global
best particle in the dthdimension;
R1 and R2 are two 2-dimensional vectors with random numbers (each dimension has its own random number) uniformly selected in the range of [0.0, 1.0], which leads to useful randomness for the search strategy;
c1and c2are positive constant weighting parameters,
which generally fall in the range of [0, 4] with c1+ c2= 4. ●In step 6), the position of each particle is updated by the following equation shown in (8).
pid(t + 1) = | pid(t) + vid(t + 1)| mod Ld, (8)
where
L1is the number of tuples and L2is the number of
attributes.
4.4
Overview of BCO for detecting
attribute outliers
The BCO algorithm has a unique blend of neighbourhood search and random search that makes it appropriate for combinatorial and functional optimizations[33]. For a group of bees, the search area is a 2-dimensional plane, in which each site corresponds to an attribute value of a tuple, denoted as vij, i.e. the Aj
attribute value in tuple ti. The main steps for detecting
attribute outliers in a given dataset by a swarm of bees are shown as Algorithm 3.
Some explanations of Algorithm 3 are:
●In step 1), set parameters, such as the number of
of recruited bees around elite regions: k.
Algorithm 3: The flow of BCO for detecting attribute outliers
1) Set BCO parameters;
2) Locate each scout bee at a random position;
3) Evaluate the fitness for each scout bee’s position;
4) Select elite bees and update the solution table S; 5) Recruit a number of bees around the elite bees for
neighbourhood search and evaluate their fitness; 6) Select the fittest bee from each elite region;
7) Assign the remaining bees to search randomly and evaluate their fitness;
8) Go to step 4) and repeat until the convergence and termination conditions are met.
●In step 2), n bees are arbitrarily located on the
search plane, and each site is denoted as Lij, where Aj
attribute value in tuple tiis stored.
●In step 3), for each bee at siteLij, calculate the
O-measure of Ajfor the tuple ti, i.e. its fitness.
●In step 4), the elite bees with superior fitness (i.e. the lowest e O-measure values) are chosen from n bees, and the solution table S is updated using them. Like the solution table used in ACO, the schema of the solution table S is (T, A, V, M), where T is a tuple ID, A is the target attribute name, V is the target attribute value of the tuple, and M is the O-measure of A for the tuple. For the elite bee at Lij, search the tuple s in table S where N(Aj, s[T]) = N(Aj, ti) and s[A] = Aj and s[V]≠ti[Aj], add or
modify the new information into table S by Rule A presented in section 4.2.
●In step 5), recruitk bees around each elite bee for
the neighbourhood search and evaluate their fitness. For example, let k be 4, the sites for recruited bees around the elite bee at Lijmay be Li + 1,j + 1, Li− 1,j–1, Li + 1,j− 1, Li− 1,j + 1.
●In step 6), select the fittest bee from each elite
region, i.e. the best e sites.
●In step 7), the remainingn-e bees search randomly,
and their fitnesses is evaluated.
4.5
The time complexity analysis
Suppose that the number of agents is k, the dataset attribute number is m, and the tuple number in the dataset is n. From the descriptions of the above three algorithms, we can analyse the complexity of the time-consuming process for each algorithm.
Compute the O-measure: O(nm);
Update solution: O(s), where s is the changing size of the solution table, and s is much less than nm.
If the repeat time is q, the time complexity for each algorithm is O(kqnm), which varies linearly with n and m.
5
Conclusion
This study deals with SI-based approaches in data quality detection. Although SI models have been widely used in many applications, including detection of abnormal behaviour in networks and outliers in databases, limited research has been conducted on attribute outliers. The
paper introduces SI models into attribute outlier detection, and presents three approaches based on ACO, PSO and BCO. The algorithms for these approaches are explained in detail. The large searching space is a major bottleneck for detecting attribute outliers. Our SI-based approaches make use of swarms of the fittest agents and random moving agents, and obtain superior solutions by changing the searching paths or the positions of agents heuristically, which improves the time efficiency of outlier detection. Although different search strategies are applied for the three approaches, they use the same fitness function (i.e. the O-measure) to evaluate the solutions. For future study, we intend to perform experiments on large datasets and study a proper set of parameters that can lead to highly accurate results.
Acknowledgement
This work is supported by National Natural Science Foundation of China(U1431227,11403008), Guangdong
Scientific and Technological Project (2013B010401017), Natural Science Foundation of Guangdong (S2012010008831).
References
[1] Ahmed, H., Glasgow, J.(2012). Swarm Intelligence: Concepts, Models and Applications, Technical Report 2012-585, School of Computing Queen's University.
[2] Panigrahi, B. K., Shi, Y.H., Lim , M.-H. (2011). Handbook of Swarm Intelligence. Series: Adaptation, Learning, and Optimization, Vol 8, Berlin :Springer-Verlag.
[3] Blum ,C. , Merkle, D. (2008). Swarm Intelligence–
Introduction and Applications (Natural Computing serial). , Berlin : Springer.
[4] Yang, X.S., Cui, Z. H.(2014). Bio-inspired computation: success and challenges of IJBIC, International Journal of Bio-inspired Computation, 6(1): 1-6.
[5] Cui, Z. H., Xiao, R.B.(2014). Bio-inspired Computation: Theory and Applications, Journal of Multiple-valued Logic and Soft Computing, 22(3): 217-221.
[6] Yang, X. S., Deb, S., Loomes, M., Karamanoglu, M. (2013). A framework for self-tuning optimization algorithm, Neural Computing and Applications, 23( 7-8): 2051–2057.
[7] Cui, Z. H., Fan, S. J., Zeng, J. C., Shi, Z.,Z. (2013). Artificial plan optimization algorithm with three-period photosynthesis, Int. J. Bio-Inspired Computation, 5( 2): 133–139.
[8] Yang, X. S., (2012). Metaheuristics and swarm intelligence in engineering and industry: editorial, Int. J. Bio-Inspired Computation, 4( 4): 197–199. [9] Ciszak, L.(2008) Application of clustering and
[10] Chiang, F., Miller, R.J.(2008). Discovering data quality rules. Proceedings of the International Conference on Very Large Databases, pp:1166-1177. [11] Alam, S., Dobbie, G., Riddle, P., Naeem,
M.A.(2010). A swarm intelligence based clustering approach for outlier detection, 2010 IEEE Congress on Evolutionary Computation, pp:1-7.
[12] Jindal, R., Sharma, S.D., Manoj Sharma, M.(2013). A New Technique to Increase the Working Performance of the Ant Colony Optimization Algorithm. International Journal of Innovative Technology and Exploring Engineering, 3(2) 128-131.
[13] Beni, G., Wang, J.(1989). Swarm intelligence in cellular robotic systems. Proceedings of NATO Advanced Workshop on Robots and Biological Systems, vol.102, 703-712.
[14] Jiang, K.Q., Song, B.S., Shi, X.L., Song, T.(2012). An Overview of Membrane Computing, Journal of Bioinformatics and Intelligent Control, 1(1): 17-26. [15] Mohamed Jafar, O.A., Sivakumar, R.(2010).
Ant-based Clustering Algorithms: A Brief Survey. International Journal of Computer Theory and Engineering, 2(5) 1793-8201.
[16] Dorigo, M., Caro, G. D. (1999). Ant Algorithms for Discrete Optimization. Artificial Life, 5(3) 137-172. [17] Dorigo, M., Maniezzo, V. (1996). The ant system: optimization by a colony of cooperating agents. IEEE Transactions on Systems, Man, and Cybernetics, 26(1) 1-13.
[18] Dorigo, M., Maniezzo, V., Colorni, A.(1991). Positive feedback as a search strategy, Technical Report 91-016, Dipartimento di Elettronica, Politecnico di Milano, Italy.
[19] Kennedy, J., Eberhart, R. C.(1995). Particle swarm optimization. Proceedings of IEEE International Conference on Neural Networks, 1942–1948. [20] Aydin, M.E., Wu,J., Zhang,L.(2010) Swarms of
metaheuristic agents: A model for collective intelligence, 2010 International Conference on P2P, Parallel, Grid, Cloud and Internet Computing, pp:296-301.
[21] García-Gonzalo, E., Fernández-Martínez, J.L.(2012). A Brief Historical Review of Particle Swarm Optimization (PSO), Journal of Bioinformatics and Intelligent Control, 1(1): 3-16 . [22] Karaboga, D.(2005). An idea based on honey bee
swarm for numerical optimization, Technical
Report-TR06,Erciyes University, Engineering Faculty, Computer Engineering Department. [23] Djenouri, Y., Drias, H., Habbas, Z., Mosteghanemi,
H.(2012).Bees swarm optimization for web association rule mining, 2012 IEEE/WIC/ACM International Conferences on Web Intelligence and Intelligent Agent Technology,pp:142-146.
[24] Zhu, X., Wu, X. (2004). Class noise vs. attribute noise: A Quantitiative study of their impacts. Artificial Intelligence Review, 22(3) 177-210. [25] Kolias, C., Kambourakis, G. , Maragoudakis,
M.(2011). Swarm intelligence in intrusion detection: A survey. Computers & Security, 30(8) 625-642. [26] Tsai, C.L., Tseng, C.C., Han, C.C.(2009). Intrusive
behavior analysis based on honey pot tracking and ant algorithm analysis. Proceedings of the 43rd Annual 2009 International Carnahan Conference on Security Technology, pp:248-252.
[27] Soroush, E., Saniee A.M., Habibi J.A.(2006). Boosting ant-colony optimization algorithm for computer intrusion detection. Proceedings of The IEEE 20th International Symposium on Frontiers in Networking with Applications.
[28] Lumer, E., Faieta, B.(1994). Diversity and adaptation in populations of clustering ants, Proceedings of Third International Conference on Simulation of Adaptive Behavior: From Animal to Animats 3,pp: 499-508.
[29] Ramos,V., Abraham, A.(2005). ANTIDS: Self organized ant based clustering model for intrusion detection system. Proceedings of The Fourth IEEE International Workshop on Soft Computing as Transdisciplinary Science and
Technology(WSTST’05), pp:977-986.
[30] Osama, A., Zulaiha, A.O.(2012). Bees Algorithm for feature selection in network anomaly detection. Journal of Applied Sciences Research, 8(3) 1748-1756.
[31] Koh, J. L. Y. , Lee, M.L., Hsu,W., et al.(2007). Correlation-based detection of attribute outliers. Advances in Databases: Concepts, Systems and Applications(Lecture Notes in Computer Science,vol.4443), 164-175.
[32] Barnett, V., Lewis,T.(1994). Outliers in Statistical Data. New York : John Wiley and Sons.