The Asian Journal of Technology Management Vol. 4 No. 1 (2011) 28-40
Validating The ISO 9000 Construct of Measurement Instrument Through
Application of RASCH Model
Rohaizah Saad1*, Rushami Zein Yusuff2, Zakaria Abas3,Azrilah Abd Aziz4, Mohd Saidfudin Masodi5
1College of Business, Universiti Utara Malaysia, 2College of Business, Universiti Utara Malaysia 3College of Business, Universiti Utara Malaysia, 4Consultant Psychometrician, Integrated Advance
Planning Sdn Bhd, 5Program Coordinator, Exec. Dip in QMS/QMS ISO 9000 Lead Assessor
ABSTRACT
There are numerous researches conducted on the issues related to ISO 9001 quality management system. Among the issue is the impact of the ISO 9001 quality management system implementation on the performance of the organization. However the findings from the research appeared as inconclusive. Few literature suggest that the inconclusive result may due to the level of ISO 9000 implementation therefore further research is required. Generally the data collected for these types of researches are through mailed questionnaires and analyzed it using SPSS and SEM. In line with that this study also developed questionnaires correspond to a 5 point Likert to assess the implementation of ISO 9000 in the organization. As a result 231 items are identified within five dimensions. The five dimensions are derived from ISO 9001 and ISO 9004 quality management standards requirement and guidelines. Among the dimensions are management responsibility, resource management, product realization, measurement improvement and innovation and organizational performance. The questionnaires are sent to 78 automotive based companies located in the Northern region of Peninsular Malaysia. 19 questionnaires were returned and used as pilot test to validate and calibrate the instrument. The responds from the organization are tabulated and run in WinSteps software for the purpose of validating and calibrating the instrument by implementing the Rasch ‘quality control’ and reduction of items. Not all the outfit items are removed from the instruments, Rasch Model did provide room for the researcher to make decision either to remove or not those outfit items. In this study those outfit items need to be corrected in order to ensure that the instrument is reliable and fit to measure the performance of the organization. As a result 68 items are removed from the questionnaires.
Keyword: rasch model, ISO 9001, quality control and items reduction.
F
*
1. Introduction
Quality has emerged as a strategic competitive tool for organizational success in the domestic and international market (Kartha, 2004). Organizations have realized that the key to increase productivity and profitability is improving quality of product and services. The concept of quality was emerged way back in 18 century during the time of Juran and Deming. Along the period many concepts and techniques of quality have been developed and adopted to improve the standard of service and quality of products. And many organizations have reviewed that an effective quality management can enhance their competitive abilities and provide strategic advantages in the marketplace (Anderson, Rungtusanatham, & Schroeder, 1993).
There are numerous quality management system in the market. And ISO 9000 is the most popular quality management system since it is always considered as a base towards the total quality management (Chow-Chua, Goh, & Wan, 2003; Franceschini, Galetto, & Cecconi, 2006). It is also the fastest growing quality system in the world. According to the latest statistics released by the ISO, (2009b), as of the end of December 2009, 178 countries, with 1.1 million certifications world wide. The number of certifications has increased from year to year. Due to the wide acceptance of ISO 9000 has led to considerable interest in the research literature.
Among the issues discussed in the literature are motives of ISO 9000 certification, the benefit derived from the ISO 9000 implementation, the ISO 9000 criticism, its impact on organizational performance and its relationship with total quality management (TQM) (Psomas & Fotopoulos, 2009). Empirically, ISO 9000 has been proven to help the improvement of performance of the organization (Zain & Ahmad, 2000). However Feng, Terziovski, & Samson (2008) stated that there are some conflicting findings on the
bottom-line effects of ISO certification and the practices which lead to successful implementation. This conflicting result may due to the commitment to implement the ISO 9000 requirements. As suggested by Lee, To, & Billy (2009) organization can be classified into cluster in which some organizations implement the principles of ISO 9000 to the extent that certification can be obtained and some organizations implement the principles to level beyond the standard requirements. However this study is an exploratory work with a limited sample size. Due to that this research will extend this idea to empirically test the correlation between the ability of an organization in performing ISO 9000 standard requirements and lead to organizational performance.
Generally the studies related to quality management systems involving collecting quantitative data through questionnaire survey. And most of the data collected in the form of ordinal data and the output was analyzed using the statistical method SPSS or SEM which is in the form of raw scores. The raw score is only giving a ranking order which deemed an ordinal data and is of continuum in nature and not an interval scale. Due to that Rasch analysis model was adopted to analysed the level of ISO 9000 adoption and its ability in achieving organizational performance. Rasch Model through WinSteps software be able to transform ordinal data into ratio data in the form of logit value.
opinion involving management representative in the organization. Before further research was conducted it is important to ensure the instrument used is valid and reliable. Due to the importance of reliable instrument, the instrument should represent what it is supposed to measure, hence the objective of this paper is to conduct an exercise to check the reliability of the instruments using Rasch Model. Rasch Model is able to provide method in checking the reliability and quality of the instrument (Fisher, 2008).
2. Measurement method 2.1. Sample
The objective to this study is to evaluate the performance of automotive base companies located at Northern Region of Malaysia based on their ISO 9000 exercise. There are about 78 companies were involved in the automotive industry at the Northern region but only 19 companies returned the questionnaire and participated in the survey.
2.2. Instruments development
The questionnaire used in this research was developed based on ISO 9000 quality management standard requirements and guidelines, also from exhaustive literature review and expert opinion from appointed management representative in the organization. The questionnaire was designed to evaluate the ability of organization to perform items under ISO 9000. The questionnaire consisted of 231 questions separated into five dimensions or four independent variables and one dependent variable.
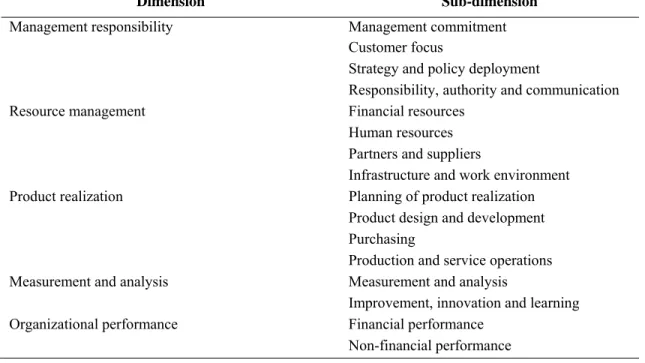
The five dimensions were management responsibilities, resource management, product realization, measurement, analysis and improvement which is according to ISO 9000 standard requirement and organizational performance. Those five dimensions were supported by sub-dimensions. Those dimensions are tabulated in the following table 1. The ability of responses were categorized using Likert scale rank from “1” very low to “5” very high (Sekaran, 2003).
Table 1: List of dimensions
Dimension Sub-dimension
Management responsibility Management commitment
Customer focus
Strategy and policy deployment
Responsibility, authority and communication
Resource management Financial resources
Human resources
Partners and suppliers
Infrastructure and work environment
Product realization Planning of product realization
Product design and development
Purchasing Production and service operations
Measurement and analysis Measurement and analysis
Improvement, innovation and learning
Organizational performance Financial performance
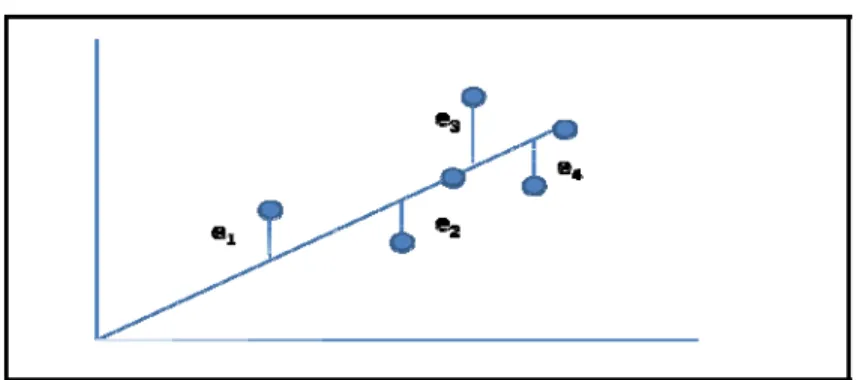
Current practice of measuring performance is only counting the responses of priorities from the organizations. The rating is only an order of preference; which is continuum in nature and it is not linear and also do not have equal intervals which contradict with the nature of numbers for statistical analysis (Aziz et al., 2008; B. D. Wright, 1997b). In Traditional Test, the scatter plot is applied to establish the best regression. However prediction from ordinal response is
almost impossible due to absence of intervals scale. The normal solution in linear regression approach is to establish a line which fits the points as best as possible; which is then used to make the required predictions by inter-polation or extra-polation as necessary (Aziz et al., 2008; Aziz, Mohamad, Arshad, Zakaria, & Masodi, 2007) as shown in Figure 1.
(1)
Figure 1. Best fit line concept
In obtaining the best fit line, however, there exist differences between the actual point; yi, and predicted point; , that is on best fit line. The difference is referred as error, e
(2)
Since there is always errors involve in the prediction model, the deterministic model of equation (1) renders itself less reliable. This can be overcome by transforming it into a probabilistic model by including the prediction error into the equation;
(3)
Under the Rasch philosophy the data collected have to fit the Rasch model’s specification (Aziz et al., 2007; Bond & Fox, 2007) rather than establishing “best fit line”. Rasch moves the concept of reliability from establishing “best fit line” of the data into producing a reliable repeatable measurement instrument Wright & Mok et al, (2004) extracted from Aziz et al. (2008). Rasch focuses on constructing the measurement
instrument with accuracy rather than fitting the data to suit a measurement model with of errors. By focusing on the reproducibility of the latent trait measurement instead of forcing the expected generation of the same raw score, i.e the common expectation on repeatability of results being a reliable test, the concept of reliability takes its rightful place in supporting validity rather than being in contentions. In Rasch it is required to test whether the data allow for measurement on linear interval scale specifically in a cumulative response process i.e. a positive response to an item stochastically implies a positive response to all items being easy or otherwise.
Rasch Model is expressed as the ratio of an event being successful as;
where:
e = base of natural logarithm or Euler’s number; 2.7183
βn = person’s ability
δi = item or task difficulty
Rasch exponential expression is a function of Logistic Regression which resulted in a Ѕigmoidal ogive and can be transformed into simpler operation by reducing the indices by logarithm:
ln[P(θ)] = ln [ ] (5)
Now ln[P(θ)]; as the probability of a successful event; x=1 is reduced to the expression termed logit and can be construed
simply as the difference of person ability; βn and the item difficulty; δi, which can be represented as;
ln[P(θ)] = βn - δi (6)
The main reason why the transformation into logit is required is to obtain a linear
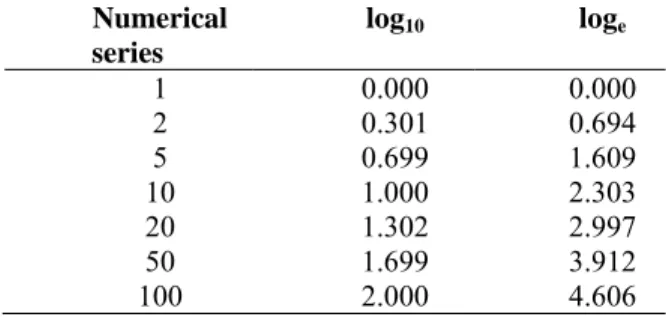
interval scale. It can be shown mathematically that a series of numbers irrespective of based used is not equally spaced but distant apart exponentially as the number gets bigger while
a log series maintain their equal separation; thus equal interval (Aziz et al., 2008). The Table 2 below shows the equal separation and term it as logit as measurement of ability. The
difference between log105 and log102 is constant and remain of equal distant between log1050 and log1020. Similarly for loge; hence
logit.
Table 2. Comparison of Numerical and Log intervals
Numerical series
log10 loge
1 0.000 0.000
2 0.301 0.694
5 0.699 1.609
10 1.000 2.303
20 1.302 2.997
50 1.699 3.912
100 2.000 4.606
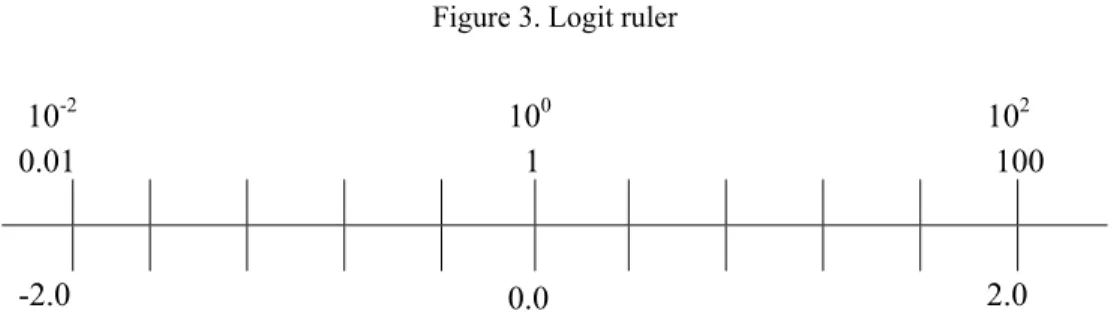
Rasch is a probabilistic model it is about the chances of choosing of one rank not the others. It involves the odd ratio. The Figure 2 below shows the probabilistic line diagram while Figure 3 shows the logit ruler.
0BFigure 2. Probabilistic line diagram
1/99 10/90 20/80 30/70 40/60 50/50 60/40 70/30 80/20 90/10 99/1
In order to achieve an equal internal scale, the logarithm used for odd probabilistic value in Figure 2 above. For example the value of 1/99 is equivalent to 10-2 when log
10 apply to it, then log1010-2 is equal to -2.0; value of log1010
-1 equals to -1; value of log
101 equals to 0 and so forth. The Figure 3 below shows the newly established logit ruler as linear scale with equal
Figure 3. Logit ruler
Based on the above theorem the rank order data can be transformed into equal interval separation
4. Data analysis
As mentioned earlier the purpose of this paper is to check on the reliability and calibrate the instrument used before further analysis is conducted. An instrument also shall also have the correct construct of linear scale which can be zero set and duly calibrated. A valid instrument can then be replicated for independent use of the subject hence measurement taken thereof is therefore a reliable data for meaningful analysis and examination to generate useful information (Saidfudin et al., 2010). However to further validate the construct validity, Rasch analysis provides indicators of how well each item fits within underlying construct. The concept of fit is a “quality-control mechanism” and it is important to ascertain whether the assumption of unidimensionality holds up empirically (Bond et al., 2007). Therefore the instrument is subjected to validity and reliability.
In classical test theory reliability and validity measures are from Cronbach-α and Factor analysis. However Rasch Modeal which is in line with the concept of modern test theory known Item Response Theory (IRT) goes beyond this measurement by focusing on the reproducibility of measures rather than expressing the reproducibility of raw scores (Aziz et al., 2007).
The total respondent involved in this pilot test is 19 and their organization located at Northern Region. The data from the survey was analyzed using Rasch Model statistical computer software program, Winstep 3.68.2 (Bond et al., 2007). In order to analyze how good the data collected fit the Rasch model, Summary Statistic Table as per Table 3 provides the overall summary statistic.
Table 3. Summary statistic
Validating ISO 9000 instrument
INPUT: 19 Person 231 Item MEASURED: 19 Person 231 Item 5 CATS WINSTEPS 3.69.1.16 ---
SUMMARY OF 19 MEASURED Person
--- | TOTAL MODEL INFIT OUTFIT | | SCORE COUNT MEASURE ERROR MNSQ ZSTD MNSQ ZSTD |
|---| | MEAN 857.8 230.6 1.56 .11 .99 -.9 .99 -.9 |
| S.D. 108.5 1.6 1.24 .01 .49 4.9 .50 5.1 |
10-2 100 102
0.01 1 100
| MAX. 1077.0 231.0 4.53 .14 2.30 9.7 2.29 9.7 | | MIN. 580.0 224.0 -1.26 .09 .34 -9.1 .31 -9.9 |
|---|
| REAL RMSE .12 TRUE SD 1.23 SEPARATION 10.29 Person RELIABILITY .99 | |MODEL RMSE .11 TRUE SD 1.23 SEPARATION 11.22 Person RELIABILITY .99 |
| S.E. OF Person MEAN = .29 | --- Person RAW SCORE-TO-MEASURE CORRELATION = .99
CRONBACH ALPHA (KR-20) Person RAW SCORE RELIABILITY = .99
SUMMARY OF 231 MEASURED Item
--- | TOTAL MODEL INFIT OUTFIT | | SCORE COUNT MEASURE ERROR MNSQ ZSTD MNSQ ZSTD |
|---| | MEAN 70.6 19.0 .00 .38 .98 -.1 .99 -.1 | | S.D. 5.8 .2 .78 .02 .41 1.1 .48 1.2 | | MAX. 82.0 19.0 3.34 .42 3.78 5.5 4.92 6.8 |
| MIN. 43.0 18.0 -1.76 .33 .29 -2.9 .31 -2.8 | |---|
| REAL RMSE .40 TRUE SD .66 SEPARATION 1.65 Item RELIABILITY .73 | |MODEL RMSE .38 TRUE SD .68 SEPARATION 1.79 Item RELIABILITY .76 |
| S.E. OF Item MEAN = .05 | ---
From the above table the Cronbach-alpha (α) value is at 0.99 which is consider acceptable reliability as Cronbach-alpha should be more than 0.60 (Nunnally & Bernstein, 1994). Generally this instrument is reliable in measuring the constructs (Sekaran, 2003). However in Rasch the reliability issues are discussed further in term of person reliability and item reliability. The person reliability and item reliability index provided in the above Table 3 indicates the replicability of person ordering and item placements respectively along the logit scale (Bond et al., 2007). The
person reliability index is given at 0.99 which is deemed ‘Excellent’ reliability (Fisher, 2007), showing the stability of the person response validity. Item reliability index is at 0.73 which is of ‘Fair’reliability (Fisher, 2007), inferring that the assessment tool can discriminate the person ability and the difficult item. This is the very crucial test as it determines the construct validity of the instrument hence valid data (Andrich, 1988; Bond et al., 2007).
The MeanItem is always set at 0.00 logit
and the MeanPerson is observed at 1.56 logit.
This indicates that the organization involved in this study in general have the ability to reach the items prescribed in the study. The most difficult item is located at 3.34 logit and the
easiest item is located at -1.76 logit with the
standard deviation of 0.78 logit which inferring
to the small spread within the data. While the maximum logit for person is 4.53 logit and the
minimum logit for person is -1.76 logit and the
range is 6.29 logit which indicate a bigger
spread among the respondents. The data also shows that there are respondents above the maximum item logit which indicates
respondent’s excellent ability in performing the items.Rasch analysis generates useful information in ensuring the data fit the model, the measures are Point Measure correlation (PtMea Corr), Outfit Mean Square (MNSQ) and z-Standard Test. These measures are used as ‘quality control’ to ensure the data can be used for further analysis. The guidelines given by Fisher, (2007) the quality control value for Pt-Mea Corr should lies between 0.40 and 0.80, MNSQ should be within 0.5 and 1.5 and the z-standard should be between -2 and 2.
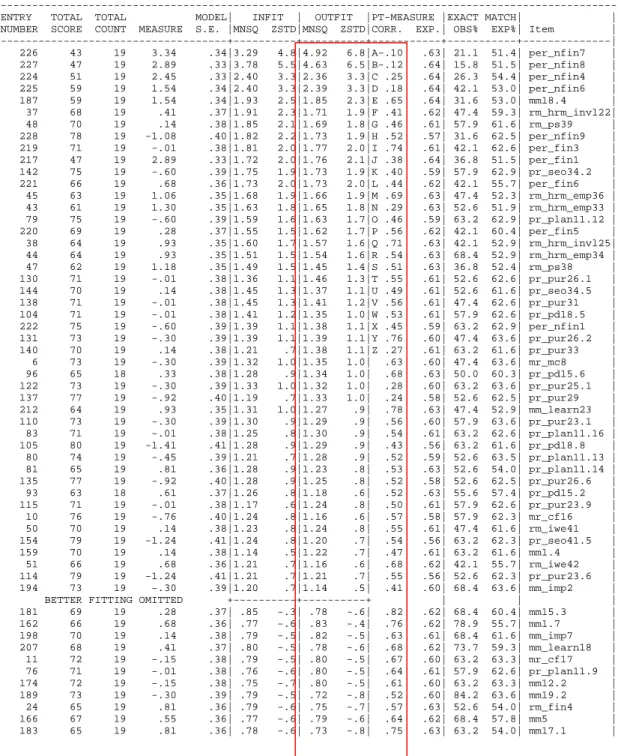
Misfit order report provides a guideline which items need to be considered.
The Table 4 below shows the Misfit Order report.
Table 4. Item statistic Misfit Order
Validating ISO 9000 instrument
INPUT: 19 Person 231 Item MEASURED: 19 Person 231 Item 5 CATS WINSTEPS 3.69.1.16 ---
Person: REAL SEP.: 10.29 REL.: .99 ... Item: REAL SEP.: 1.65 REL.: .73
Item STATISTICS: MISFIT ORDER
| 25 68 19 .41 .37| .76 -.7| .78 -.6| .60 .62| 52.6 59.3| rm_fin5 | | 148 78 19 -1.08 .40| .78 -.6| .74 -.7| .48 .57| 73.7 62.5| pr_seo35.1 | | 8 73 19 -.30 .39| .74 -.7| .77 -.6| .67 .60| 68.4 63.6| mr_mc10 | | 190 73 19 -.30 .39| .75 -.7| .76 -.7| .72 .60| 68.4 63.6| mm20 | | 180 67 19 .55 .36| .75 -.7| .76 -.7| .76 .62| 73.7 57.8| mm15.2 | | 136 77 19 -.92 .40| .73 -.8| .74 -.7| .59 .58| 63.2 62.5| pr_pur28 | | 64 65 19 .81 .36| .74 -.8| .72 -.9| .81 .63| 52.6 54.0| pr_plan4 | | 29 73 19 -.30 .39| .73 -.8| .74 -.7| .68 .60| 68.4 63.6| rm_fin9 | | 61 75 19 -.60 .39| .61 -1.2| .72 -.8| .62 .59| 78.9 62.9| pr_plan3.3 | | 17 71 19 -.01 .38| .71 -.8| .72 -.8| .73 .61| 68.4 62.6| mr_rac30 | | 210 61 19 1.30 .35| .71 -.9| .72 -.9| .76 .63| 42.1 51.9| mm_learn21 | | 172 69 19 .28 .37| .72 -.8| .67 -1.0| .82 .62| 78.9 60.4| mm11 | | 87 76 19 -.76 .40| .71 -.8| .68 -1.0| .74 .58| 68.4 62.3| pr_pd13.2 | | 129 68 19 .41 .37| .69 -.9| .71 -.9| .62 .62| 63.2 59.3| pr_pur25.8 | | 40 64 19 .93 .35| .71 -.9| .71 -.9| .81 .63| 68.4 52.9| rm_hrm_emp28 | | 231 71 19 -.01 .38| .68 -1.0| .71 -.8| .75 .61| 68.4 62.6| per_nfin14 | | 31 66 19 .68 .36| .71 -.9| .70 -.9| .68 .62| 63.2 55.7| rm_hrm12 | | 203 64 19 .93 .35| .71 -.9| .67 -1.1| .85 .63| 57.9 52.9| mm_learn11 | | 133 78 19 -1.08 .40| .70 -.9| .70 -.9| .77 .57| 63.2 62.5| pr_pur26.4 | | 175 73 19 -.30 .39| .70 -.9| .69 -.9| .74 .60| 68.4 63.6| mm12.3 | | 98 73 19 -.30 .39| .70 -.9| .67 -1.0| .66 .60| 68.4 63.6| pr_pd16.3 | | 204 70 19 .14 .38| .69 -.9| .69 -.9| .74 .61| 68.4 61.6| mm_learn13 | | 116 74 19 -.45 .39| .68 -.9| .69 -.9| .66 .59| 73.7 63.5| pr_pur23.10 | | 185 69 19 .28 .37| .69 -.9| .64 -1.1| .74 .62| 78.9 60.4| mm17.3 | | 60 75 19 -.60 .39| .68 -1.0| .69 -.9| .62 .59| 78.9 62.9| pr_plan3.2 | | 123 70 19 .14 .38| .66 -1.0| .69 -.9| .42 .61| 68.4 61.6| pr_pur25.2 | | 90 74 19 -.45 .39| .66 -1.0| .69 -.9| .67 .59| 73.7 63.5| pr_pd13.6 | | 103 75 19 -.60 .39| .68 -1.0| .68 -.9| .62 .59| 78.9 62.9| pr_pd18.4 | | 15 70 19 .14 .38| .67 -1.0| .67 -1.0| .74 .61| 68.4 61.6| mr_sp27 | | 84 70 19 .14 .38| .66 -1.0| .63 -1.1| .66 .61| 68.4 61.6| pr_plan11.17 | | 160 71 19 -.01 .38| .63 -1.1| .65 -1.0| .61 .61| 68.4 62.6| mm1.5 | | 52 71 19 -.01 .38| .64 -1.1| .65 -1.1| .69 .61| 68.4 62.6| rm_iwe43 | | 34 62 19 1.18 .35| .61 -1.3| .65 -1.2| .75 .63| 57.9 52.4| rm_hrm15 | | 92 65 18 .33 .38| .63 -1.1| .64 -1.1| .77 .63| 83.3 60.3| pr_pd15.1 | | 23 67 19 .55 .36| .61 -1.3| .60 -1.3| .71 .62| 68.4 57.8| rm_fin3 | | 193 73 19 -.30 .39| .59 -1.3| .60 -1.3| .65 .60| 78.9 63.6| mm_imp1 | | 111 69 19 .28 .37| .58 -1.4| .60 -1.3| .58 .62| 68.4 60.4| pr_pur23.3 | | 108 77 19 -.92 .40| .59 -1.3| .59 -1.3|z .69 .58| 73.7 62.5| pr_pd21 | | 208 67 19 .55 .36| .59 -1.3| .57 -1.4|y .81 .62| 78.9 57.8| mm_learn19 | | 28 69 19 .28 .37| .55 -1.5| .59 -1.3|x .65 .62| 57.9 60.4| rm_fin8 | | 196 68 19 .41 .37| .58 -1.4| .53 -1.6|w .80 .62| 73.7 59.3| mm_imp4 | | 214 73 19 -.30 .39| .57 -1.4| .57 -1.4|v .80 .60| 78.9 63.6| mm_learn27 | | 58 66 19 .68 .36| .56 -1.5| .56 -1.5|u .78 .62| 63.2 55.7| pr_plan2 | | 119 73 19 -.30 .39| .54 -1.5| .55 -1.5|t .69 .60| 78.9 63.6| pr_pur23.13 | | 19 69 19 .28 .37| .55 -1.5| .54 -1.5|s .73 .62| 68.4 60.4| mr_rac32 | | 27 74 19 -.45 .39| .55 -1.5| .55 -1.5|r .74 .59| 84.2 63.5| rm_fin7 | | 32 67 19 .55 .36| .51 -1.7| .55 -1.5|q .83 .62| 68.4 57.8| rm_hrm13 | | 20 71 19 -.01 .38| .54 -1.5| .54 -1.5|p .70 .61| 78.9 62.6| mr_rac33 | | 191 73 19 -.30 .39| .53 -1.5| .54 -1.5|o .69 .60| 78.9 63.6| mm21.3 | | 156 70 19 .14 .38| .51 -1.6| .54 -1.5|n .81 .61| 78.9 61.6| mm1.1 | | 18 70 19 .14 .38| .54 -1.5| .52 -1.6|m .82 .61| 68.4 61.6| mr_rac31 | | 66 67 19 .55 .36| .54 -1.6| .51 -1.7|l .85 .62| 78.9 57.8| pr_plan6 | | 67 70 19 .14 .38| .50 -1.7| .52 -1.6|k .78 .61| 68.4 61.6| pr_plan7 | | 132 72 19 -.15 .38| .50 -1.7| .51 -1.6|j .87 .60| 73.7 63.3| pr_pur26.3 | | 167 70 19 .14 .38| .48 -1.8| .48 -1.8|i .59 .61| 68.4 61.6| mm6 | | 192 70 19 .14 .38| .48 -1.8| .46 -1.9|h .72 .61| 68.4 61.6| mm21.7 | | 143 77 19 -.92 .40| .48 -1.9| .48 -1.8|g .76 .58| 84.2 62.5| pr_seo34.4 | | 201 68 19 .41 .37| .44 -2.0| .43 -2.1|f .85 .62| 84.2 59.3| mm_inv9 | | 202 71 19 -.01 .38| .43 -2.0| .42 -2.1|e .73 .61| 78.9 62.6| mm_inv10 | | 195 70 19 .14 .38| .36 -2.4| .39 -2.3|d .67 .61| 78.9 61.6| mm_imp3 | | 33 63 19 1.06 .35| .34 -2.7| .36 -2.6|c .84 .63| 84.2 52.3| rm_hrm14 | | 199 69 19 .28 .37| .34 -2.6| .36 -2.5|b .71 .62| 78.9 60.4| mm_inv8.1 | | 200 68 19 .41 .37| .29 -2.9| .31 -2.8|a .78 .62| 84.2 59.3| mm_inv8.2 | |---+---+---+---+---+---| | MEAN 70.6 19.0 .00 .38| .98 -.1| .99 -.1| | 62.3 60.4| |
1B| S.D. 5.8 .2 .78 .02| .41 1.1| .48 1.2| | 11.8 3.5|
Even though the above provide information on items outside the range but in order for the instrument to be good it should be able to avoid the items that have the same item measure. Those items with the same item
Table 5: Largest standardized residual correlations used to identify dependent item
TABLE 23.99 ISO 9000 constructs and organization
INPUT: 19 Person 231 Item MEASURED: 19 Person 231 Item ---
LARGEST STANDARDIZED RESIDUAL CORRELATIONS USED TO IDENTIFY DEPENDENT Item
--- |CORREL- | ENTRY | ENTRY | | ATION |NUMBER Item |NUMBER Item | |---+---+---| | .95 | 215 mm_learn28 | 216 mm_learn29 |
| .95 | 157 mm1.2 | 158 mm1.3 | | .94 | 148 pr_seo35.1 | 149 pr_seo35.2 |
| .94 | 40 rm_hrm_emp28 | 42 rm_hrm_emp31 | | .93 | 226 per_nfin7 | 227 per_nfin8 |
| .93 | 179 mm15.1 | 182 mm15.4 | | .92 | 87 pr_pd13.2 | 108 pr_pd21 | | .92 | 145 pr_seo34.6 | 151 pr_seo37.2 |
| .91 | 173 mm12.1 | 175 mm12.3 | | .89 | 153 pr_seo41.1 | 168 mm8.3 |
---
Based on the above table those items which are highly correlated are due for further investigation. This table is only suggesting the highly correlated items but those items with the same item measures in the same dimension that require further scrutiny.
The structure calibration table is used to confirm the rating classification used is true
where s-value being the separation between
each structure category label (Bond et al., 2007). The separation shall be in the range where s; 1.5 < s <5.0. If the value of s falls
less than 1.5, than the rating/s are submerged. On the opposite, if s fall greater than 5.0 than the rating should be split (Aziz, 2010). Hence in this study the separation of each category is as follows:
e.g s2-3 = -1.34-(-3.04) = 1.7; > 1.5, which is acceptable
s3-4 = 0.69 –(-1.34) = 2.03; > 1.5, which is acceptable
Figure 4. Category probabilities: modes - Structure measures at intersections
P - + - - - + - - - + - - - + - - - + - - - + - - - + - - - + - - - + - - - + - - - + - R 1 . 0 + + O | | B | | A | 1 1 1 | B . 8 + 1 1 5 + I | 1 5 | L | 1 4 4 4 4 5 5 | I | 1 1 4 4 4 4 4 5 | T . 6 + 1 4 4 4 5 + Y | 1 2 2 3 3 3 3 3 3 3 4 4 4 4 5 | . 5 + 1 2 2 2 2 2 2 3 3 3 4 * 5 + O | 2 * 2 * 3 * 3 5 4 | F . 4 + 2 1 3 2 4 3 5 4 4 + | 2 2 1 3 2 4 3 5 4 | R | 2 1 3 2 2 4 4 3 3 5 4 | E | 2 2 1 3 3 2 4 3 5 5 4 4 | S . 2 + 2 2 3 1 1 * 2 3 3 5 5 4 + P | 2 2 3 3 1 4 4 2 5 * 3 | O | 2 3 3 1 1 1 4 4 2 2 2 5 5 3 3 3 | N | 3 3 3 3 3 4 4 4 * 1 1 1 2 * * * 5 5 3 3 3 3 3 | S . 0 + * * * * * * * * * * * * * * * * * * * * 5 5 5 5 5 5 5 * * * * * * * * 1 1 1 * * * * * * * * * * * * * * * * * * * * * * * + E - + - - - + - - - + - - - + - - - + - - - + - - - + - - - + - - - + - - - + - - - + - - 5 - 4 - 3 - 2 - 1 0 1 2 3 4 5 Person [MINUS] Item MEASURE
Since the calculation of s-value is within the acceptable value therefore the rating scales of 1 to 5 is remined. The above Figure 4 shows the probability curves for rating scale. It looks like the responds are fairly distributed among the categories. After further analysis was conducted on the items which are misfit by removing and restructure the questions as a result 68 items were removed from the questionnaires. The 168 items will be used for empirical research.
5. Conclusion
The valid and reliable instrument is very crucial in ensuring the data collected can answer the research objective. In this research the Rasch Model was used to validate the instrument. Those items that are misfit according to three types of quality controls and also those items are highly correlated among them are reviewed accordingly. As a result the items in the new instrument stood at 168 items measuring five dimensions. The empirical research may require to further investigate the
study of level of ISO 9000 implementation among the automotive industries.
References
Anderson, J. C., Rungtusanatham, M., & Schroeder, R. G. (1993). A theory of quality management underlying the Deming management method. Academy of Management Review, Vol 19(No. 4), 472-509.
Andrich, D. (1988). Rasch Model for Measurement. Newbury Park: Sage.
Aziz, A. A. (2010). Rasch Model
Fundamentals: Scale Construct and Measurement Structure: Perpustakaan Negara
Malaysia.
Aziz, A. A., Mohamad, A., Arshad, N., Zakaria, S., Ghulman, H. A., & Masodi, M. (2008). Application of Rasch Model in validating the construct of measurement instrument.
Information Technologies, Vol 2(No 2),
105-112.
Aziz, A. A., Mohamad, A., Arshad, N., Zakaria, S., & Masodi, M. (2007). Appraisal of Course Learning Outcomes using Rasch Measurement: A Case Study In Information Technology Education. International Journal of Systems Applications, Engineering & Development, Vol: 4(1).
Bond, T. G., & Fox, C. M. (2007). Applying the Rasch Model: Fundamental Measurement in the Human Sciences (Second Edition ed.):
Lawrence Erlbaum Associates, Inc.
Chow-Chua, C., Goh, M., & Wan, T. B. (2003). Does ISO 9000 certification improves business performance? International Journal of Quality & Reliability Management, Vol 20(No. 8).
Feng, M., Terziovski, M., & Samson, D. (2008). Relationship of ISO 9001:2000 quality system certification with operational and business performance. A survey in Australia and New Zealand-based manufacturing and service companies. Journal of Manufacturing Technology Management, Vol 19(No. 1), 22-37.
Fisher, W. P. J. (2007). Rating Scale Instrument Quality Criteria. Rasch Measurement Transactions, Vol 21.1, 1095.
Fisher, W. P. J. (2008). The Cash Value of Reliability [Electronic Version]. Rasch Measurement Transactions from
http://www.rasch.org/rmt/rmt221i.htm.
Franceschini, Galetto, M., & Cecconi, P. (2006). A worldwide analysis of ISO 9000 standard diffusion. Consideration and future development. Benchmarking An International Journal, Vol 13(No.4), 523-541.
ISO. (2009b). Highlights of The ISO Survey-2009. Retrieved 03/08, 2011, from http://www.accredia.it/UploadDocs/1289_ISO _Survey_2009_HIGHLIGHTS.pdf
Kartha, C. P. (2004). A comparison of ISO 9000:2000 quality system standards, QS9000, ISO/TS 16949 and Baldrige criteria. The TQM Magazine, Vol 16(No. 5), 331-340.
Lee, To, W. M., & Yu, B. T. W. (2009). The implementation and performance outcomes of ISO 9000 in service organizations. An empirical taxanomy. International Journal of Quality & Reliability Management, Vol 26(No.7), 646-662.
Nunnally, J. C., & Bernstein, I. H. (1994).
Psychometric Theory (3rd ed.): McGraw-Hill,
Inc.
Padma, P., Ganesh, L. S., & Rajendran, C. (2006). A Study on the critical factors of ISO 9001:2000 and organizational performance of Indian manufacturing firms. International Journal of Production Research Vol 46(18).
Psomas, E. L., & Fotopoulos, C. V. (2009). A meta analysis of ISO 9001:2000 research - findings and future research proposals.
International Journal of Quality and Service Sciences, Vol 1(No 2), 128-144.
Saidfudin, M., Azrilah, A. A., Rodzo'an, N. A., Omar, M. Z., Zaharim, A., & Basri, H. (2010).
Use of Rasch Analysis to measure Students Performance in Engineering Education. Paper
presented at the EDUCATION'10 Proceedings of the 7th WSEAS international conference on Engineering education
Saraph, J. V., Benson, P. G., & Schroeder, R. G. (1989). An instrument for Measuring the Critical Factors of Quality Management.
Decision Sciences, Vol 20(4), 810-829.
Sekaran, U. (2003). Research Methods for Business: a Skill Building Approach. New
York: John Wiley.
Models and Applications: Minnesota: Jam
Press.
Wright, B. D. (1997b). Fundamental Measurement for Outcome Evaluation. IOM Research Memoranda.