Copyright © 2017 Vilnius Gediminas Technical University (VGTU) Press Technika http://www.bjrbe.vgtu.lt
doi:10.3846/bjrbe.2017.08 OF ROAD AND BRIDGE ENGINEERING
ISSN 1822-427X / eISSN 1822-4288 2017 Volume 12(1): 64–69
1. Introduction
Accidents are one of the leading cause of death all over the world. According to the World Health Organization (2016), more than 1.25 million people die each year as a result of accidents on the roads. The probability of acci-dents and their consequences are dependent on the three most important reason groups: human; roadway; vehicle. In some cases, the accident may be due to one of the rea-sons. However, the causes of accidents are usually complex and involve several factors. Treat et al. (1979) have deter-mined that interaction between road user, roadway, and vehicle make 93% of the total number of accidents.
Speeding is one of the most frequent violations of traffic rules by the road users. Speed is an aggravating fac-tor in all crashes. Speed has been identified as a facfac-tor in accidents, influencing both the risk of accidents and the severity of the accidents. Due to the high speed of a ve-hicle time is reduced during which a driver has: to take into account and identify possible obstacle; to estimate the distance to the obstacle and if an obstacle is moving to measure its speed and other potential factors; to make decision on personal actions; to execute actions aimed at avoiding the crash or reducing the negative consequences
as much as possible (Kallberg, Luoma 1996). The higher speed of collision is the more severe consequences of an accident are. This is because the energy dissipated in an accident increases with the square of collision speed. At a higher impact speed, more energy is released when colli-ding with another vehicle, road user or obstacle. The vul-nerable human body absorbs part of this energy.
Many factors determine speed selection of drivers. There has been a strong body of research conducted to describe the demographic population who participate in speeding behaviour. Studies have repeatedly found that males, who are between the ages of 18 to 24 years, are the group who are most likely to speed (Palamara, Stevenson 2003). Most drivers drive without experiencing accidents, which reinforces the attitude that speeding is not risky (Elliott 2001). This belief results in an underestimation of the association between speeding and the probability of serious injury or fatality in an accident. Alcohol usage and drugs can also lead speeding. Sometimes passengers of vehicles motivate the driver to exceed the speed. Often drivers go with other drivers exceeding speed (Connolly, Åberg 1993). Although often drivers fail to accurately as-sess the surrounding speed (Liu et al. 2012). The speed
AVERAGE SPEED ENFORCEMENT SYSTEM EFFICIENCY ASSESSMENT MODEL
Laura Jateikienė1, Audrius Vaitkus2
Road Research Institute, Vilnius Gediminas Technical University, Linkmenų str. 28, Vilnius LT–08217, Lithuania E-mails: 1[email protected]; 2[email protected]
Abstract. Accidents are one of the leading cause of death all over the world. Speed has been identified as a factor in road accidents, influencing both the risk of accidents and the severity of the accidents. However, speeding is one of the most frequent violations of traffic rules by the road users. Many results of studies showed that the implementation of speed cameras significantly reduced the vehicle speed and the number of accidents near camera sites. One issue re-garding speed enforcement by a speed camera is that a reduction in speed is obtained only on a short section of a road. The results of scientific research analysis suggest that this issue can be overcome by the employment of average speed enforcement system (hereafter system), which is a relatively new approach to traffic law enforcement. Until now, Lithu-ania had no methodology for selecting road sections to be installed with the system. The purpose of this paper is to develop a model for the assessment of safety impact of the system and to perform economic estimation of a system of Lithuanian main road sections selected under this model. The analysis of international practice helped to develop this model, which joins accident indicators, road and traffic parameters. A cost-benefit analysis of the system, implemented on main road sections and selected by suggested model, shows a high level of payback. The implementation of the sys-tem would pay back in one year of service.
limit is one of the most important factors that affect choi-ce of operating speed. However, drivers, who are willing to exceed the speed, often fail to see speed limit signs, and ra-rely noticed their respects (Warner 2006). Systems of intel-ligent speed adaptation have a positive impact on the speed control. These systems warn drivers or automatically limit the speed of vehicles when the speed limit is exceeded. Ho-wever, these systems often have an influence on the decre-ase of fixed speed at a given moment, but it does not affect the change attitude of drivers. Informative of road infras-tructure has a significant impact on the speed limit com-pliance (Liu et al. 2012). Road infrastructure could provide credibility for speed limits. In some cases, road infrastructu-re physically forces drivers not to exceed the speed limit. Also, speed enforcement has a particularly positive effect on driving behaviour. Enforcement needs to be widespread, highly visible and constant to consistently maintain appro-priate risk perceptions held by drivers (Liu et al. 2012).
Many scientists study the impact of speed cameras on accidents. Li et al. (2013) have summarized many studies, and the results showed that the implementation of speed cameras significantly reduced the vehicle speed and the number of accidents near camera sites. One issue regar-ding speed enforcement by a speed camera is that some drivers brake before passing a camera and then speed up again after they have passed it (De Pauw et al. 2014a). Thus, a reduction in speed is obtained only on a short section of a road. This issue can be overcome by the em-ployment of average speed enforcement system (hereafter system), which is a relatively new approach to traffic law enforcement. This system is based on the measurements of the average speed in a certain road section signed by information signs. At the beginning and the end of the road section, the video cameras detect data of the ente-ring and leaving vehicles – time, number plate. Registered time length of the vehicle in the measured section of a road is compared with a specified minimum, which is calcula-ted by assessing section distance and average speed limit. When a vehicle passes road section faster than the mini-mum length of time, the vehicle owner is identified by the number plates.
The purpose of this paper is to develop a model for the assessment of safety impact of the system and to per-form system’s economic estimation of Lithuanian main ro-ads sections selected under this model.
2. Scientific research analysis of installation locations of average speed enforcement system and efficiency Several countries already have systems for a longer period, such as the Netherlands, the United Kingdom, Austria, and Italy. However, in others countries, this enforcement coun-termeasure is still new. The results of scientific research analysis suggest that there is considerable evidence of a positive influence of average speed enforcement system on vehicle speed, including average speed, 85th percentile speed, the proportion of speeding vehicle in the traffic flow and speed variability (Soole et al. 2013). Scientific research
analysis reveals that accident reduction is associated with the implementation of the system, mostly influencing the reduction of fatalities (Vaitkus et al. 2016).
In the Netherlands, systems are installed on the road sections, where the speed limit, over the measured section, is the same (Rajamäki 2010). Informative road signs warn about the functioning of a system. Average speed enforce-ment systems are installed on the road sections, which lengths are from 0.5 km to 5 km. In most cases, the aver-age speed of vehicles is controlled approximately in 3.5 km section (Räsänen 2008). The first implementation of per-manent system was in the 3 km of A13 motorway in 2002. The speed limit has also been reduced from 100 km/h to 80 km/h. On the section, only 0.5% of vehicles were de-tected speeding after the system was installed (Wegman, Goldenbeld 2006). 47% reduced the accidents in this sec-tion (Stefan 2006).
In Austria, the first implementation of the system was in the 2.3 km of Kaisermuhleno tunnel near Vienna in 2003. The tunnel offers 3–4 lanes per direction. More than 90 000 vehicles pass this tunnel every day, about 10% con-sist of heavy vehicles. The speed limit through the tunnel for heavy vehicles is 60 km/h; other traffic speed is reduced to 80 km/h (Stefan 2006). After installation of the system, a reduction in average speed by more than 10 km/h was recorded. The accident data was estimated before (4 years) and after (1 year) installation of the system, taking into ac-count the change of traffic flow and overall accident varia-tion trend. It was determined that accidents decrease by 33.3%, fatalities and seriously injured road users by 48.8%.
In Italy, system was implemented on the motorway A1 Milan–Naples in 2007. The speed limit on the study site is 130 km/h. To evaluate the safety effectiveness of the system an empirical Bayes observational before-after study was performed (Montella et al. 2012). Regarding the re-search data, it has been determined that average speed en-forcement system has statistically significant impact on the reduction of accidents. The estimate of the total accident reduction is 31.2%. The most reductions of accidents were observed for severe accidents and accidents at curves. The reduction was 55.6% for severe (severe injury and fatal) accidents, 26.6% for non-severe (slight injury and prop-erty damage only) accidents, 43.3% at curves. However, it has been determined that the safety effectiveness decrease over time.
of drivers exceeding the speed limit and 86% in the odds of drivers exceeding the speed limit by more than 10%. It was also found that vehicles drive in more uniform speed after the implementation of the system.
In Australia, system was first implemented in Victo-ria in 2007 of urban motorway (Soole et al. 2013). Systems have also been installed in some other jurisdictions in-cluding Queensland, New South Wales, and the Australian Capital Territory. In Switzerland, a single permanent sys-tem has been fully operational since January 2011. 3. Assessment model of average speed enforcement system efficiency to road safety
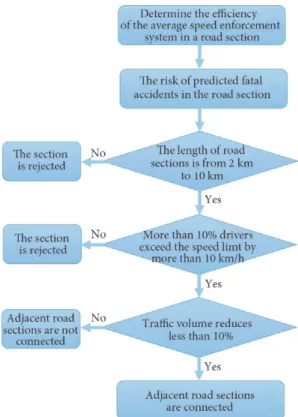
A model for the evaluation of safety impact of the system was developed by international experience in implement-ing the system (Fig. 1). The detail of currently stored data in Lithuania, road infrastructure and traffic volume were as-sessed while making this model.
Accident statistics of 2011–2015 shows that according to the rate of accidents, fatalities and injuries for one road kilometre, the dangerous roads were main roads. Therefore, a setting model of system efficiency to traffic safety on main road section was concluded. The model involves four stages.
In the first stage the risk of predicted fatal accidents is determined for the homogenous road sections:
, (1)
where – the risk of predicted fatal accidents on the road section i; – the number of predicted fatal
accidents on the road section i; Li – length of road section i, km; AADTi – annual average daily traffic on the road section i, veh/day.
Accidents on the roads of national significance in Lithuania are predicted using the Road Network Safety Assessment Program Tarva LT under empirical Bayes method (Jasiūnienė, Čygas 2013). Many scientists (Azizi, Sheikholeslami 2013; Elvik 2008; Harwood et al. 2003; Hauer 1997; Hauer et al. 2002; Montella 2010; Montella et al. 2015; Persaud et al. 2001; Persaud, Lyon 2007; Wu et al. 2015; Zhou et al. 2013) point out that this method is well-developed and widely used in the field of road safety. The empirical Bayes method is based on the assumption that in a similar envi-ronment with prevailing similar traffic conditions the risk of accidents is similar. Using the empirical Bayes method the expected number of accidents is determined by com-bining two information sources: number of historical ac-cidents on a specific road element and mathematical acci-dent prediction model describing acciacci-dent risk on the road elements similar in their environment.
In the second stage, the length of homogenous road sections is identified. Based on international practice, the system will be effective if the length of the road section ranges from 2 km to 10 km.
In the third stage, on the homogeneous road sections, the percentage of drivers exceeding the speed limit is deter-mined. The Code of Administrative Offences of Lithuania provides that the drivers having exceeded the speed limit by less than 10 km/h be given only a verbal warning. Seek-ing that the system was effective, the speedSeek-ing drivers must be penalized. Therefore, the research is focused on the per-centage of drivers exceeding the speed limit by more than 10 km/h and on the selection of road sections where the percentage of speeding drivers is more than 10%.
In the fourth stage, after the assessment of environ-mental conditions and uniformity of traffic volume on the road sections selected in the first–third stages, some of the adjacent road sections are joined. Seeking that the system was effective, it is important to record vehicles in both measuring points of the system. Therefore, the system evaluates the traffic flow turning off to the minor roads at the intersections located among the road sections. When it is less than 10% of common road traffic volume, adjacent sections are connected.
4. Experimental research of average speed enforcement system efficiency to road safety
From all main roads of Lithuania the largest number of se-vere accidents in the year 2014 was recorded on the road A5 Kaunas–Marijampolė–Suwalki – 9 road users were killed. In the period 2011–2014, on the road A5 110 accidents oc-curred where 34 road users were killed (Fig. 2). To reduce the number of accidents on this road on 19 July 2015 in the section from 29.131 km to 34.004 km (in the length of 4.873 km) the system was installed signed with informa-tion signs. Within the impact zone of the system the speed limit varies 90–70–90 km/h, therefore the calculated average speed on this road section is 88 km/h.
Violation data of 88 km/h average permissible speed, fixed on the operation section of the system, was received from Lithuanian Traffic Police Service. It was found that after installation of the system average speed violations apparent-ly declined (Fig. 3). Installation of the system had the most influence on the reduction of speed violations for more than 10 km/h of 88 km/h average speed.
None of the recorded accidents took place during the period in question after the installation of the system in the operation section. However, the examined period is too short to determine the efficiency of the installed sys-tem on Lithuanian main road regarding the impact factor. 5. Application of a system based on average speed enforcement model on Lithuanian roads
Based on the above described model for the evaluation of safety impact of the system (Fig. 1) the potential road sec-tions were selected for the installation of the system. On those sections, with the help of the Road Network Safety Assessment Program Tarva LT, the number of accidents and fatal accidents was predicted showing how many accidents/ fatal accidents will occur per year if no measures are imple-mented.
To determine the change in the predicted number of accidents/fatal accidents after installation of the system the program, Tarva LT was supplemented with the safety impact coefficients of the system developed by the Italian scientists Montella et al. (2012): 0.69 for accidents and 0.44 for fatal accidents.
Description of Procedures for the Determination of Road Safety Levels (2011) provides that the priority road sections of high accident concentration have to make no less than 10% road sections of the highest accident con-centration. This principle was used selecting sections suit-able for the installation of the average speed enforcement system.
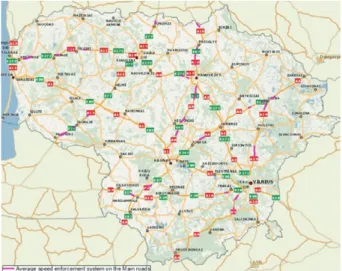
From 290 homogeneous sections of main roads 29 potential road sections were selected (Fig. 4) for the instal-lation of the average speed enforcement system.
Accidents cause economic losses. Road Investment Manual (2015) says that a material damage of one fatal ac-cident on Lithuanian roads amounts to 596 899 EUR. A material damage of one injury accident is 54 201 EUR.
The cost of the system equipment and its installation would amount to about 15 000 EUR. The cost of main-tenance would amount to about 200 EUR per month. A yearly maintenance would cost 2400 EUR.
Alternatives for the implementation of the system on main roads of Lithuania
Alternative I. The system is installed on nine sections of main roads:
−expected benefit, if the decrease in the predict-ed fatal accidents per year is 2.58, would make 1 539 999.42 EUR/year;
−expected benefit, if the decrease in the predict-ed injury accidents per year is 0.78, would make 42 276.78 EUR/year;
−the costs of installation of the average speed en-forcement systems would make 135 000 EUR; −the costs of maintenance of the systems would
make 21 600 EUR/year.
Alternative II. The average speed enforcement system is installed on 18 sections of main roads:
−expected benefit, if the decrease in the predict-ed fatal accidents per year is 3.97, would make 2 369 689.03 EUR/year;
−expected benefit, if the decrease in the predict-ed injury accidents per year is 1.15, would make 62 331.15 EUR/year;
Fig. 2. Variation of traffic volume and accident on A5 road in 2011–2015
Fig. 3. Violations number of permissible average 88 km/h speed before-after system installation
−the costs of installation of the systems would make 270 000 EUR;
−the costs of maintenance of the systems would make 43 200 EUR/year.
Alternative III. The system is installed on 29 sections of main roads:
−expected benefit, if the decrease in the predict-ed fatal accidents per year is 4.95, would make 2 954 650.05 EUR/year;
−expected benefit, if the decrease in the predict-ed injury accidents per year is 1.31, would make 71 003.31 EUR/year;
−the costs of installation of the systems would make 435 000 EUR;
−the costs of maintenance of the systems would make 69 600 EUR/year.
A cost-benefit analysis of the system has indicated a high level of payback of all alternatives. However, the best indices were represented by the first alternative of the system installation on main roads (Net Present Value – 10 436 EUR; Internal Rate of Return – 1156.1%; ratio of present benefit value and present cost value or cost-effec-tiveness – 38.98). The cost efficiency of other alternatives is very close to the first one. The implemented system would pay back in one year of service.
To check the sensitivity of cost-benefit analysis results to the possible changes in the implementation costs of the system, the testing of cost-benefit analysis results was car-ried out with 66.7% increase in price (i. e. if installation of the average speed enforcement system on one road sec-tion would cost 25 000 EUR) and 166.7% increase in price (i. e. if installation of the system on one road section would cost 40 000 EUR). The test showed a low sensitivity to the changes in the implementation costs of the system. Though in all cases economic indicators have decreased they re-mained positive. Hence, the implementation costs of the system due to a relatively low price of equipment practi-cally have no influence on economic indicators.
6. Conclusions
1. The model for the evaluation of safety impact of the sys-tem was developed having analysed international experi-ence in implementing the system. The average speed en-forcement system involves four stages. In the first stage, the risk of predicted fatal accidents is determined for the road sections. In the second stage, the length of homogenous road sections is identified. In the third stage on the homo-geneous road sections, the percentage of drivers exceed-ing the speed limit is determined. In the fourth stage, after the assessment of annual average daily traffic uniformity among adjacent road sections, the short sections are joined.
2. Experimental research on the system showed that after installation of the system in 4.873 km long section of the main road A5 Kaunas–Marijampolė–Suwalki average speed violations apparently declined. Installation of the system had the most influence on the reduction of speed violations for more than 10 km/h of 88 km/h average speed.
3. One of the principles of the model for the evalua-tion of safety impact of the system is the length of homoge-neous road sections. The principle is based on internation-al experience and indicates that the system can be effective in the distance from 2 km to 10 km. Results of experimen-tal research of the system prove the distance of impact.
4. A cost-benefit analysis of the system, installed on main sections selected by the developed model for the evaluation of safety impact of the system on the road sec-tions, shows a high level of payback. Installation of the system would pay back in one year of service. A low sen-sitivity was determined having tested sensen-sitivity of the cost-benefit analysis results to the possible changes in the installation costs of the system with 66.7% and 166.7% in-crease in price. In both cases, though economic indicators have decreased they remained positive.
References
Azizi, L.; Sheikholeslami, A. 2013. Safety Effect of U-Turn Con-versions in Tehran: Empirical Bayes Observational before-and-after Study and Crash Prediction Models, Journal of
Transportation Engineering 139(1): 101–108.
https://doi.org/10.1061/(ASCE)TE.1943-5436.0000469 Connolly, T.; Åberg, L. 1993. Some Contagion Models of
Speed-ing, Accident Analysis and Prevention 25(1): 57−66. https://doi.org/10.1016/0001-4575(93)90096-F
De Pauw, E.; Daniels, S.; Brijs, T.; Hermans, E.; Wets, G. 2014a. Behavioural Effects of Fixed Speed Cameras on Motorways: Overall Improved Speed Compliance or Kangaroo Jumps?
Accident Analysis and Prevention 73: 132–140.
https://doi.org/10.1016/j.aap.2014.08.019
De Pauw, E.; Daniels, S.; Brijs, T.; Hermans, E.; Wets, G. 2014b. Automated Section Speed Control on Motorways: an Evalu-ation of the Effect on Driving Speed, Accident Analysis and
Prevention 73: 313–322.
https://doi.org/10.1016/j.aap.2014.09.005
Elliott, B. 2001. What Do We Know about Influencing Speed Be-haviour?, in Proc. of the National Speed and Road Safety
Con-ference, 23−24 August, 2001, Adelaide.
Elvik, R. 2008. The Predictive Validity of Empirical Bayes Esti-mates of Road Safety, Accident Analysis and Prevention 40(6): 1964−1969. http://dx.doi.org/10.1016/j.aap.2008.0 7.007 Harwood, D. W.; Bauer, K. M.; Potts, I. B.; Torbic, D. J.;
Rich-ard, K. R.; Rabbani, E. R. K.; Hauer, E.; Elefteriadou, L.; Griffith, M. S. 2003. Safety Effectiveness of Intersection Left- and Right-Turn Lanes, Transportation Research Record 1840: 131–139. https://doi.org/10.3141/1840-15
Hauer, E.; Harwood, D. W.; Council, F. M.; Griffith, M. S. 2002. Estimating Safety by the Empirical Bayes Method. a Tutorial,
Transportation Research Record 1784: 126–131.
https://doi.org/10.3141/1784-16
Hauer, E. 1997. Observational before-after Studies in Road Safety: Estimating the Effect of Highway and Traffic Engineering
Mea-sures on Road Safety. Pergamon, Tarrytown, N. Y.
Jasiūnienė, V.; Čygas, D. 2013. Road Accident Prediction Model for the Roads of National Significance of Lithuania, The Baltic
Journal of Road and Bridge Engineering 8(1): 66−73.
Kallberg, V. P.; Luoma, J. 1996. Speed Kills – or Does It and Why?
in Proc. of the International Conference Road Safety in Europe.
VTI conference No. 7A, Part 2. September 9−11, 1996. Li, H.; Graham, D. J.; Majumdar, A. 2013. The Impacts of Speed
Cameras on Road Accidents: an Application of Propensity Score Matching Methods, Accident Analysis and Prevention
60: 148–157. https://doi.org/10.1016/j.aap.2013.08.003 Liu, S.; Oxley, J.; Corben, B.; Young, K. 2012. Velocity Series
Dis-cussion Paper 4: Factors Influencing Travel Speed. Monash
University Accident Research Centre. 37 p.
Montella, A.; Imbriani, L. L.; Marzano V.; Mauriello, F. 2015. Ef-fects on Speed and Safety of Point-to-Point Speed Enforce-ment Systems: Evaluation on the Urban Motorway A56 Tangenziale di Napoli, Accident Analysis and Prevention 75: 164−178. https://doi.org/10.1016/j.aap.2014.11.022
Montella, A.; Persaud, B.; D’Apuzzo, M.; Imbriani, L. L. 2012. Safety Evaluation of an Automated Section Speed Enforce-ment System, Transportation Research Record 2281: 16–25. https://doi.org/10.3141/2281-03
Montella, A. 2010. A Comparative Analysis of Hotspot Identifi-cation Methods, Accident Analysis and Prevention 42(2): 571– 581. https://doi.org/10.1016/j.aap.2009.09.025
Palamara, P. G.; Stevenson, M. R. 2003. ALongitudinal Investiga-tion of Psychosocial Risk Factors for Speeding Offences among
Young Motor Car Drivers. Injury Research Centre,
Depart-ment of Public Health, the University of Western Australia, Report 128.
Persaud, B.; Lyon, C. 2007. Empirical Bayes before-after Studies: Lessons Learned from Two Decades of Experience and Future Directions, Accident Analysis and Prevention 39(3): 546–555. https://doi.org/10.1016/j.aap.2006.09.009
Persaud, B. N.; Retting, R. A.; Garder, P. E.; Lord. D. 2001. Safety Effect of Roundabout Conversions in the United States: Em-pirical Bayes Observation before-after Study, Transportation
Research Record 1751: 1–8. https://doi.org/10.3141/1751-01
Rajamäki R. 2010. Matka-aikaan perustuvan automaattisen no-peusvalvonnan kokeilu. 52 p. ISBN 978-952-243-195-0 (in Finnish).
Räsänen, M.; Beilinson, L.; Kallberg, V.-P. 2004. Automaattisen
kameravalvonnan nopeusvaikutukset kantatiellä 51. 104 p. (in
Finnish).
Soole, D. W.; Watson, B. C.; Fleiter, J. J. 2013. Effects of Average Speed Enforcement on Speed Compliance and Crashes: a Re-view of the Literature, Accident Analysis and Prevention 54: 46−56. https://doi.org/10.1016/j.aap.2013.01.018
Stefan, C. 2006. Section Control – Automatic Speed Enforcement
in the Kaisermühlen Tunnel (Vienna, A22 Motorway).
Kurato-rium fur Verkehrssicherheit, Austria.
Treat, J. R.; Tumbas, N. S.; McDonald, S. T.; Shinar, D.; Hume, R. D.; Mayer, R. E.; Stansifer, R. L.; Castellan, N. J. 1979. Tri-Level Study of the Causes of Traffic Crashes: Final Report-Executive
Summary. Report No. DOT-HS-034-3-535-79-TAC(S).
Insti-tute for Research in Public Safety, Bloomington, IN.
Vaitkus, A.; Strumskys, M.; Jasiūnienė, V.; Jateikienė, L.; Andrie-jauskas, T.; Skrodenis, D. 2016. Effect of Intelligent Trans-port Systems on Traffic Safety, The Baltic Journal of Road and
Bridge Engineering 11(2): 136−143.
https://doi.org/10.3846/bjrbe.2016.16
Warner, H. W. 2006. Factors Influencing Drivers’ Speeding Behav-iour. Digital Comprehensive Summaries of Uppsala Disserta-tions from the Faculty of Social Sciences, 21.
Wegman, F.; Goldenbeld, C. 2006. Speed Management:
En-forcement and New Technologies. Report R2006-5, SWOV,
Leidschendam.
Wu, H.; Han, Z.; Murphy, M. R.; Zhang, Z. 2015. Empirical Bayes before-after Study on Safety Effect of Narrow Pavement Wid-ening Projects in Texas, Transportation Research Record 2515: 63−69. https://doi.org/10.3141/2515-09
Zhou, H.; Zhao, J.; Peter, H.; Jing, H. 2013. Safety Effects of Me-dian Treatments Using Longitudinal Channelizers: Empirical Bayesian Before-and-After Study, Journal of Transportation
Engineering 139(12): 1149–1155.
https://doi.org/10.1061/(ASCE)TE.1943-5436.0000585