T e c h n i c a l M e m o r a n d u m
Date May 2005
Project Kennesaw State University Master Plan
Subject Future Academic Programs 4A
From HGA / Paulien & Associates, Inc.
To President Betty L. Siegel
1. FUTURE ACADEMIC PROGRAMS
1.1 Changes at Kennesaw State University
Kennesaw State University (KSU) reached University status in 1996 and introduced its housing program in 2002. Its student population continues to grow at a faster rate than Georgia’s other state universities. This is partly due to the explosive growth in the Atlanta metropolitan area and the University’s geographic location in Cobb County. KSU is conducting classes seven days a week to accommodate the very large non-traditional student population, while at the same time needing to meet the needs of a rapidly growing number of residential and traditional students.
KSU is determined to serve the academic needs of the non-traditional student while fostering a traditional academic environment for the freshman entering the University. To achieve both goals, the University must have more space. Without additional classroom and office space, it will become difficult to maintain the high academic standards KSU has attained. Short-term concerns based on the above changes are:
1. Receiving funding for needed classroom, laboratory and faculty office buildings. 2. Starting and completing all proposed academic buildings within the next five years. The University and planning team believe that the new buildings coming on-line (Classroom and Convocation Center and PE addition) and the addition of the future Social Science and Classroom Building and KSU Small Auditorium are steps in the right direction. However, the space growth is not keeping up with the rate of student growth and the net result is the space per student full-time equivalent (fte) will continue to decline if the enrollment projections are met.
1.2 Description of Future Academic Programs Kennesaw State University has seven colleges:
• College of Humanities & Social Sciences • Wellstar College of Health & Human Services • College of Science & Mathematics
• University College
Having recently restructured the colleges, no reorganization in the near future is anticipated. Additional academic programs at the undergraduate, masters, and doctoral levels will follow KSU’s innovative and entrepreneurial tradition. The first doctoral programs will be in leadership, education, business, health care, and computer science. Each has a well-defined student population and a focus on empirical research linked to community engagement. Specific programs include:
• a Ph.D. in Leadership with an emphasis in ethics for non-profit corporations, health care, education, and community-based organizations;
• an Ed.D. as an education specialist with an emphasis in public education;
• a Ph.D. in Business Administration aimed at mid-level business executives and retired CEOs.
Ten graduates per year are expected in each of the above programs.
Table 1 New Academic Programs under Discussion
College of the Arts
Master’s degree in Art Education
Master’s degree in Music Education and Performance
Coles College of Business
Master of Science in Finance Doctor of Business Administration
Bagwell College of Education
Master of Arts in Teaching (with several tracks) Education Specialist (with several tracks) Doctor of Education (with several tracks)
Doctor of Philosophy in Ethical Leadership (joint doctoral program with Health & Human Services)
Master’s Program in English as a Second language Master’s degree in School Counseling
Master’s degree in Educational Technology
WellStar College of Health & Human Services
Master of Social Work being implemented Fall 2006
Master of Science in Human Services (maybe beyond the 5-year period due to implementing M.S.W.)
Two additional tracks in the current Nursing Master’s degree that focuses on Care Management and Leadership. The exact tracks are to be determined.
Master of Science in Applied Exercise and Health Science
Master of Science in Sport Management (potentially with an international track) Master of Science in Sports Medicine
Bachelor of Science/MBA- There is an agreement between Health & Human Services and Business to put this articulation together. All programs currently exist at KSU and will not require BOR approval (probably be handled like a new track)
Doctor of Philosophy in Ethical Leadership (joint program with Education) Doctorate in Nursing (clinical/education focus)
College of Humanities and Social Sciences
Bachelor’s Degrees- Anthropology Philosophy
Communication - split present degree into 2 degrees: 1) Communication Studies; and 2) Mass Communication and Journalism.
Master’s Degrees-
International Affairs (letter of intent waiting) Political Science
American Studies (letter of intent waiting) Spanish
Communication Criminal Justice Sociology
Master of Arts in Teaching (with Education – pending)
College of Science & Mathematics
Master of Science in Applied Statistics Master of Science in Systems Biology
Master of Science in Election Systems
Master of Arts in Teaching (with Education – pending) Doctor of Science in Applied Computer Science
University College
Interdisciplinary Media and Journalism.
Interdisciplinary Studies (undergraduate and master’s degrees) Leadership Studies (undergraduate degree)
Diversity Studies (undergraduate interdisciplinary degree focusing on ethnic, gender, religious diversity)
Academic Affairs and Student Success Leadership (master’s degree) International Studies
Institute for Global Initiatives
Bachelor of Arts in Chinese Studies
1.3 Future On- and Off-campus Students
Kennesaw State University anticipates an on-campus full-time equivalent (FTE) enrollment of 25,000 students. It is expected that the continued growth of University enrollment to 35,000 FTE will primarily occur at off-campus facilities.
Since opening its residence life program in 2002, there are approximately 1,870 students housed on campus. This residential population is expected to grow by approximately 36% to 2,925 beds.
1.4 Future Role of Continuing Education
Continuing Education is presently located at the KSU Center. It is considered one of the most successful CE programs in the State. The program continues to grow and is constantly being updated to fit community needs. Because CE is located off the main campus, the program has no immediate effect on academic programs. It is not possible for Continuing Education to move back to campus due to the critical shortage in classrooms, office space and parking. `
T e c h n i c a l M e m o r a n d u m
Date May 2005
Project Kennesaw State University Master Plan
Subject Space Needs Executive Summary and Introduction 4B
From HGA, Inc.
To President Betty L. Siegel
EXECUTIVE SUMMARY
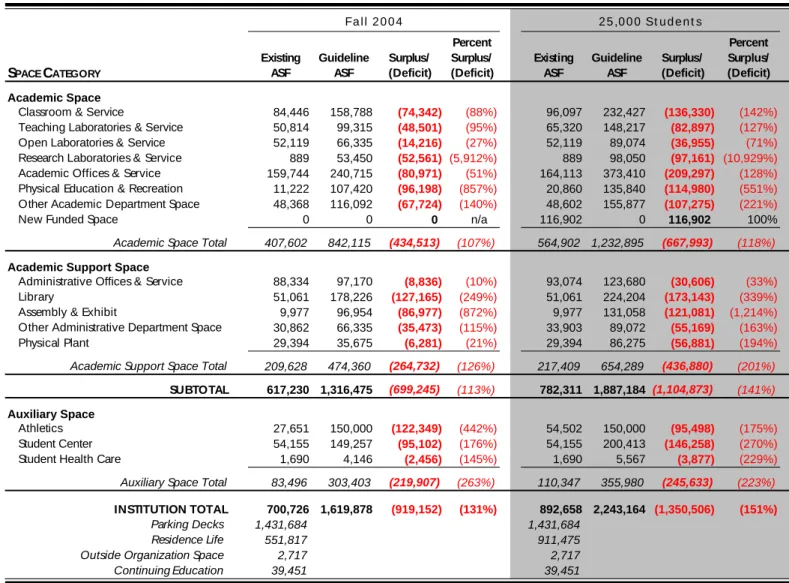
The space needs analysis found the University to have an existing space deficit of 919,000 assignable square feet (ASF) when comparing guidelines to actual space. When funded buildings in planning, design, or construction are added to the facilities inventory and the projected assignable square footage is compared to target guidelines, the deficit is projected to increase to 1,351,000 ASF.
KSU operates with less space in all space categories than normative space guidelines would recommend. The consultants lowered the guidelines in the research space category so as to not overburden the analysis with an enormous deficit in this category. Physical Plant guidelines were also lowered to reflect the actual need as communicated by campus officials. A comparative analysis was used to determine athletic space needs. Refer to Section 2C – Scenario Planning for University Enrollment & Campus Capacity for details. While the consultants did not specifically analyze housing needs, the fact that KSU now has a residential student population was considered in many of the other space categories.
KSU operates at a high level of efficiency on many fronts with space being at the top of the list. The consultants did not adjust the guidelines to reflect their current space efficiencies. As Kennesaw State University continues to evolve in its mission and program, the same economies of scale may not be achievable. Today’s college students look for certain amenities in the institutions they choose to attend. If KSU is to stay competitive in the marketplace, it will need to offer some of these amenities to its prospective student base. For example, as the University has evolved to include housing, the residential student population now requires additional spaces that KSU may have been able to live without in earlier years.
FALL 2004 BASE YEAR
§ At current enrollment and staffing levels KSU shows an overall need for an additional 919,000 ASF of space. This is a 29% deficit in square footage when comparing guideline assignable square feet to existing assignable square feet on campus. Assignable square footage is defined as the usable space inside classrooms, laboratories, offices, etc. It does not include circulation and building service space or
§ The Academic space categories show a deficit of 435,000 ASF over existing space. Academic support space categories show a deficit of 265,000 ASF. Auxiliary space excluding residential space, shows a deficit of 220,000 ASF.
§ Because the space needs reflect the maximum amount of athletic space required should football be added to KSU’s intercollegiate sports line-up, athletics is excluded from the list below. The space categories with the greatest space needs include:
Instructional space (classrooms and teaching and open labs) with a 137,000 ASF deficit Library space with a deficit of 127,000 ASF
Physical Education & Recreation space with a 96,000 ASF deficit Student Center space with a deficit of 95,000 ASF
Assembly & Exhibit space with an 87,000 ASF deficit
§ The colleges and administrative units with the greatest needs, excluding classroom space and residential space, include:
Table 1: Space Needs Analysis
Fall 2004 25,000 Students SPACE CATEGORY Existing ASF Guideline ASF Surplus/ (Deficit) Percent Surplus/ (Deficit) Existing ASF Guideline ASF Surplus/ (Deficit) Percent Surplus/ (Deficit) Academic Space
Classroom & Service 84,446 158,788 (74,342) (88%) 96,097 232,427 (136,330) (142%)
Teaching Laboratories & Service 50,814 99,315 (48,501) (95%) 65,320 148,217 (82,897) (127%)
Open Laboratories & Service 52,119 66,335 (14,216) (27%) 52,119 89,074 (36,955) (71%)
Research Laboratories & Service 889 53,450 (52,561) (5,912%) 889 98,050 (97,161) (10,929%)
Academic Offices & Service 159,744 240,715 (80,971) (51%) 164,113 373,410 (209,297) (128%)
Physical Education & Recreation 11,222 107,420 (96,198) (857%) 20,860 135,840 (114,980) (551%)
Other Academic Department Space 48,368 116,092 (67,724) (140%) 48,602 155,877 (107,275) (221%)
New Funded Space 0 0 0 n/a 116,902 0 116,902 100%
Academic Space Total 407,602 842,115 (434,513) (107%) 564,902 1,232,895 (667,993) (118%)
Academic Support Space
Administrative Offices & Service 88,334 97,170 (8,836) (10%) 93,074 123,680 (30,606) (33%)
Library 51,061 178,226 (127,165) (249%) 51,061 224,204 (173,143) (339%)
Assembly & Exhibit 9,977 96,954 (86,977) (872%) 9,977 131,058 (121,081) (1,214%)
Other Administrative Department Space 30,862 66,335 (35,473) (115%) 33,903 89,072 (55,169) (163%)
Physical Plant 29,394 35,675 (6,281) (21%) 29,394 86,275 (56,881) (194%)
Academic Support Space Total 209,628 474,360 (264,732) (126%) 217,409 654,289 (436,880) (201%)
SUBTOTAL 617,230 1,316,475 (699,245) (113%) 782,311 1,887,184 (1,104,873) (141%) Auxiliary Space
Athletics 27,651 150,000 (122,349) (442%) 54,502 150,000 (95,498) (175%)
Student Center 54,155 149,257 (95,102) (176%) 54,155 200,413 (146,258) (270%)
Student Health Care 1,690 4,146 (2,456) (145%) 1,690 5,567 (3,877) (229%)
Auxiliary Space Total 83,496 303,403 (219,907) (263%) 110,347 355,980 (245,633) (223%)
INSTITUTION TOTAL 700,726 1,619,878 (919,152) (131%) 892,658 2,243,164 (1,350,506) (151%)
Parking Decks 1,431,684 1,431,684
Residence Life 551,817 911,475
Outside Organization Space 2,717 2,717
Continuing Education 39,451 39,451
Chief Information Officer (includes the library) with a 141,000 ASF deficit Intercollegiate Athletics with a deficit of 124,000 ASF
Wellstar College of Health and Human Services with a 118,000 ASF deficit
College of the Arts (includes assembly & exhibit space) with a deficit of 114,000 ASF Vice President for Student Success & Enrollment Services with a 96,000 ASF deficit College of Science and Mathematics with a 77,000 ASF deficit
Table 2: Space Needs Analysis by College/Vice Presidential Unit
Fall 2004 25,000 Headcount Existing ASF Guideline ASF Surplus / (Deficit) Percent Surplus/
(Deficit) Existing ASF
Guideline ASF Surplus / (Deficit) Percent Surplus/ (Deficit) Academic
Bagwell College of Education 26,199 64,672 (38,473) (147%) 26,199 84,271 (58,072) (222%)
Coles College of Business 29,475 47,256 (17,781) (60%) 29,475 75,116 (45,641) (155%)
College of Humanities and Social
Sciences 59,894 100,247 (40,353) (67%) 59,894 143,037 (83,143) (139%)
College of Science and Mathematics 65,978 142,795 (76,817) (116%) 65,978 243,305 (177,327) (269%)
College of the Arts 39,039 153,425 (114,386) (293%) 39,039 215,632 (176,593) (452%)
Wellstar College of Health and Human
Services 52,917 170,728 (117,811) (223%) 72,026 236,363 (164,337) (228%)
University College 7,943 15,851 (7,908) (100%) 7,943 22,738 (14,795) (186%)
Graduate Studies 1,755 1,565 190 11% 1,755 2,355 (600) (34%)
Continuing Education 13,889 18,855 (4,966) (36%) 13,889 24,230 (10,341) (74%)
Vice President for Academic Affairs 10,353 9,991 362 3% 10,353 12,040 (1,687) (16%)
Chief Information Officer 79,360 220,257 (140,897) (178%) 79,360 281,224 (201,864) (254%)
Classroom & Service 84,446 158,788 (74,342) (88%) 96,097 232,427 (136,330) (142%)
New Funded Space 0 0 0 n/a 116,902 0 116,902 100%
Academic Total 471,248 1,104,430 (633,182) (134%) 618,910 1,572,738 (953,828) (154%)
Administrative and General
Office of the President 25,164 26,516 (1,352) (5%) 25,164 32,252 (7,088) (28%)
Intercollegiate Athletics 32,083 155,865 (123,782) (386%) 62,181 157,430 (95,249) (153%)
KSU Foundation 6,293 6,024 269 4% 6,293 6,406 (113) (2%)
Vice President for Business and
Finance 80,878 132,433 (51,555) (64%) 80,878 216,260 (135,382) (167%)
Vice President of Human Resources
and Diversity 3,696 7,271 (3,575) (97%) 8,230 8,906 (676) (8%)
Vice President for Student Success and
Enrollment Services 68,296 164,144 (95,848) (140%) 77,934 218,525 (140,591) (180%)
Vice President for University
Advancement 13,068 23,195 (10,127) (77%) 13,068 30,647 (17,579) (135%) Administrative and General Total 229,478 515,448 (285,970) (125%) 273,748 670,426 (396,678) (145%)
TOTAL 700,726 1,619,878 (919,152) (131%) 892,658 2,243,164 (1,350,506) (151%)
Parking Decks 1,431,684 1,431,684
Outside Organization Space 2,717 2,717
Residence Life 551,817 911,475
Continuing Education 39,451 39,451
PLANNING SCENARIO – 25,000 STUDENT HEADCOUNT (TARGET)
§ At the projected enrollment and staffing levels KSU shows an overall need for an additional 1,351,000 ASF of space. This is a 151% deficit in square footage when comparing guideline assignable square feet to projected existing assignable square feet on campus.
§ The Academic space categories show a deficit of 668,000 ASF over projected existing space. Academic support space categories show a deficit of 437,000 ASF. Auxiliary space excluding residential space, shows a deficit of 246,000 ASF.
§ The space categories with the greatest space needs include:
Instructional space (classrooms and teaching and open labs) with a 256,000 ASF deficit Academic Offices showing a 209,000 ASF deficit
Library space with a deficit of 173,000 ASF Student Center space with a deficit of 146,000 ASF Assembly & Exhibit space with a 121,000 ASF deficit
§ The colleges and administrative units with the greatest needs, excluding classroom space and residential space, include:
Chief Information Officer (includes the library) with a 201,000 ASF deficit College of Science and Mathematics with a 177,300 ASF deficit
College of the Arts (includes assembly & exhibit space) with a deficit of 176,600 ASF Wellstar College of Health and Human Services with a 164,000 ASF deficit
Vice President for Student Success & Enrollment Services with a 141,000 ASF deficit Vice President for Business & Finance (includes physical plant) with a 135,000 ASF deficit
INTRODUCTION
Paulien & Associates, Inc. was contracted to examine the space needs KSU’s main campus. The major responsibility of Paulien & Associates, Inc. is to:
§ apply appropriate space guidelines to determine current and future space needs; and
§ compare projected space needs to the existing and projected existing facilities.
The operating assumption is to provide KSU with a reasonable amount of space to conduct its current and projected activities. The study was conducted on a college-by-college and major administrative unit (President and Vice Presidents) basis. The base year is Fall 2004 and the planning scenario for which this analysis was conducted is 25,000 Student Headcount. Paulien & Associates was provided detailed data files containing facilities, course, and staffing data by KSU representatives. Meetings were held with the deans and vice presidents on the campus to become familiar with the unique needs of the colleges and administrative units. In addition, visits were made to various spaces throughout the campus to gain familiarity with campus facilities.
The facilities inventory provided by KSU did not have departmental coding or CIP (Classification of Instruction Program) codes. The consultants used additional data gathered through work sessions plus information gained through campus tours to assign departmental codes to as many spaces as possible. One example of the additional data gathered is a detailed phone list containing physical locations of the phones plus the individual or department assigned to the phone. The remaining data was given to representatives from the office of Facility Planning and Design Services. They supplied the remaining departmental coding. The facilities inventory provides building, square footage, room use, and departmental information on a room–by–room basis.
The course data contains the course number and description, enrollment, start and stop times, meeting location, and program on a section–by–section basis. The course data was used to study current classroom and teaching laboratory utilization. It was also used to project classroom and teaching laboratory space needs. The enrollment projections were applied on a course by course basis to the weekly student contact hours. Detailed information on these calculations can be found in Section 4B3.
The staffing data contains the headcount, employee title, and job category on a departmental basis. The detailed staffing file was used to project existing and future office needs. Growth percentages were applied by program to the subtotaled headcounts of each USG job category in order to project faculty and staff for the target planning scenario.
Throughout this study classroom space is considered a campus wide resource. Even though some classrooms may be departmentally assigned, in most cases classrooms are available to other departments for use. At a master planning level, a comparison of a program’s classroom needs to the number of classrooms to which they are assigned is not a true comparison. Therefore, when reviewing the analysis by college/unit, classrooms and classroom needs are a separate line and excluded from the individual college analysis.
Housing needs were not studied in the space needs analysis. The existing amount of space and the future existing amount of space are both noted. While the existing housing and future projected housing is on the KSU campus, the development is privatized. Therefore, the construction of new housing does not necessarily need to adhere to specific space guidelines. Outside of office needs, the space needs for Continuing Education are not included in this analysis. Therefore, the total space needs shown for Continuing Education in Table 2 above reflects only the office needs for this program. Continuing Education is a for-profit program and its needs are determined by the demand for its services. It currently is located at the KSU Center which is not on the main campus. The remainder of CE’s space is shown below the total line. Other spaces assigned in the KSU Center to programs other than CE are included in the analysis as existing space.
Space Categories Used in the Analysis
The space categories used in this analysis are not based solely on room use codes but on functional as well as departmental assignments. Furthermore, space guidelines are not applied purely by room use code but are sometimes based on multiple room use codes and by intended
§ Library Space – Library guidelines encompass the 400 series room use codes as well as office space (300’s), lounge space (650), and sometimes classrooms (110) and open computer laboratories (220). Most library guidelines do not apply to departmental libraries, unless the library is a professional library (i.e., like music, law, and medical libraries) that is staffed on a full-time basis. Library office space is included in the service space portion of the library guideline; and therefore, library staff headcounts or ftes are not used to generate library office space and are omitted in the office guideline analysis. Small departmental libraries are included in “Other Academic or Administrative Department Space” and not in the “Library” category and are not used to offset the library guideline space needs.
§ Lounge spaces (650) used for the student body at-large are typically included in the student center/union guideline along with food facilities (630’s), meeting room space (680’s), merchandising (660’s), recreational rooms (670’s), and student activity/ government offices (300’s). But not all facilities with the above room use codes should be used to offset the student center/union guideline. Lounge spaces used for faculty, administrative personnel, or specific student groups are counted in “Other Academic or Administrative Department Space”. Food facilities used for closed faculty dining should not be counted towards student center/union space.
§ Classrooms (100’s) and teaching laboratories (210’s) used for regular instruction but not for instruction that is traceable through the registrar’s course database or other specific records should not be counted with classroom and teaching laboratory space. The reason is that the justification for these rooms cannot be measured through weekly student contact hours or student credit hours. One could argue that these rooms should then be recoded as another room use.
To the degree possible, each space category definition is provided in Sections 4B3 and 4B4 along with a description of the guideline used. The primary source of the guidelines applied in this analysis is the Council of Educational Facility Planners, International, July 1985, Space Planning Guidelines (CEFPI). For some space categories, CEFPI did not have appropriate guidelines and the consultants used other methods for determining the space needs for that category.
Academic and Administrative and General Units Studied
Another manner in which the Space Needs Analysis is summarized is by college and vice president/major administrative unit. The analysis splits the units into two categories – “academic” and “administrative and general.” While the split of the units appears to be straightforward, there are two units that are included under the category “Academic” that are typically regarded as administrative units. The two units are the Vice President for Academic Affairs and the Chief Information Officer. The rationality for these units being included under the “Academic” category is that they both are assigned traditionally labeled “academic” spaces or have academic centers under their purview. In addition to its administrative role and the administrative support it provides, the Chief Information Officer is responsible for and is assigned many of the open computer laboratories on campus and provides technology support to both faculty and students.
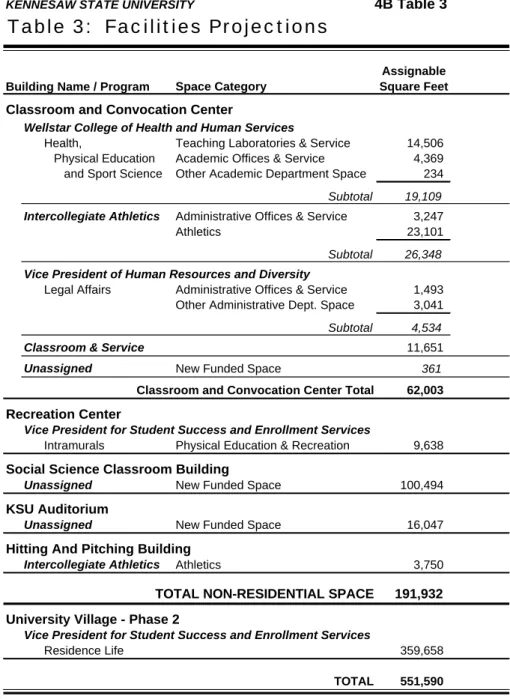
Facilities Projections
The 25,000 Student planning scenario includes an existing assignable square footage that is equal to the existing square feet plus the funded projects listed in Table 3 that are either under construction or in planning. In Fall 2004, both the new Classroom and Convocation Center and the Recreation Center were under construction. The other buildings listed were in varying planning stages.
No attempt was made to create a space reallocation scenario. Therefore, all the new spaces shown as being allocated to a particular program are in addition to its existing space. “Unassigned” as used in the following table, does not mean unassignable space with room use codes of less than 100. The “unassigned” spaces are spaces that could not be assigned to a particular department.
KENNESAW STATE UNIVERSITY 4B Table 3
Table 3: Facilities Projections
Building Name / Program Space Category
Assignable Square Feet
Classroom and Convocation Center
Wellstar College of Health and Human Services
Health, Teaching Laboratories & Service 14,506 Physical Education Academic Offices & Service 4,369 and Sport Science Other Academic Department Space 234
Subtotal 19,109
Intercollegiate Athletics Administrative Offices & Service 3,247
Athletics 23,101
Subtotal 26,348
Vice President of Human Resources and Diversity
Legal Affairs Administrative Offices & Service 1,493 Other Administrative Dept. Space 3,041
Subtotal 4,534
Classroom & Service 11,651
Unassigned New Funded Space 361
Classroom and Convocation Center Total 62,003
Recreation Center
Vice President for Student Success and Enrollment Services
Intramurals Physical Education & Recreation 9,638
Social Science Classroom Building
Unassigned New Funded Space 100,494
KSU Auditorium
Unassigned New Funded Space 16,047
Hitting And Pitching Building
Intercollegiate Athletics Athletics 3,750
TOTAL NON-RESIDENTIAL SPACE 191,932 University Village - Phase 2
Limitations of Analysis
The consultants analyzed campus data provided by Kennesaw State University for staffing, course, and facilities information. The data provides a “snapshot in time” of staff, course enrollments, and facilities at the University. As with other large institutions that the consultants have studied, many changes are occurring simultaneously on a continuous basis. Of necessity, all these analyses are “snapshots in time,” but nevertheless, are consistently used as valuable tools for institutional planning.
The Space Needs Analysis is a quantitative analysis only. All permanent existing space is counted regardless of its quality or suitability. Estimated square footages are used for buildings currently under construction or renovation. Because several rooms in the facilities inventory have multiple functions (i.e., one room containing a reception space, clerical workstation, storage, and filing), it is impossible to accurately distribute the existing space among the appropriate room use and functional categories. However, the proposed area calculations are distributed among the room use and functional categories. Therefore, the relationship between existing space and proposed guideline space for individual categories should be considered as rough comparisons. The only true comparison is between a unit's total existing space and proposed guideline space.
Space needs analysis for the purpose of master planning is a process that estimates space amounts likely to be needed by various units of an institution at current and projected enrollment, staffing, and activity levels. Reliability of the findings of any space needs study depends on several factors including the quality of the data, the appropriateness of the space standards used, and the validity of the projections. Data used in this study was updated and refined to a high level of accuracy and currency. Future projections of enrollment and research levels were carefully developed. The consultants, therefore, believe that the findings and recommendations of this study may be considered reliable and may be used with confidence by the University for its campus master planning effort. Throughout this study, space amounts are rounded for reading ease.
The study was conducted at the college level and was intended for use in initial planning of future facilities expansion. The scope of the study at the college level may not have identified every individual department requirement and did not include detail normally developed in room–by–room program planning of specific facilities. This study was not intended to replace program plan level analysis.
Unless otherwise noted, all findings are in assignable square feet (ASF). ASF is defined as the area measured within the interior walls of a room that can be assigned to a program. It does not include circulation, mechanical, or building service spaces. Converting assignable space to gross square feet usually adds about 35% to 40% to the assignable space.
T e c h n i c a l M e m o r a n d u m
Date May 2005
Project Kennesaw State University Master Plan
Subject Student Enrollment Assumptions, Section 4B1
From HGA, Inc.
To President Betty L. Siegel
1. STUDENT ENROLLMENT ASSUMPTIONS
Kennesaw State University has continued to grow at a rate that exceeds the student growth patterns of other Georgia state institutions. In the last ten years, KSU has experienced a 48% student increase.(from 12,100 students in 1995 to 17,961 students in 2004). This student growth is 45% of the entire USG university growth and 20% of the USG four-year institution growth in the last decade.
The population projections provided to the Board of Regents show that the Atlanta region will experience a tremendous amount of growth over the next fifteen years. In support of this analysis, KSU has targeted two enrollment scenarios – 25,000 students and 35,000 students. At a five percent (5%) growth rate, these projections will be achieved in seven (7) to fourteen (14) years respectively. If a slower growth rate is assumed, three percent (3%) per year, these enrollments will be achieved in eleven (11) to 23 years.
Table 1 contains the headcount enrollment projections provided by Kennesaw State University’s Provost’s office. The projections reflect the institution’s desire to further develop its graduate student population. For the 25,000 student scenario, there is a 25% increase in undergraduate students and a 165% increase in graduate students. At the 35,000 student scenario the undergraduate growth is 53% while the graduate growth rate is 453%. The 25,000 student scenario assumes a student FTE of 22,268 which is based on projected student credit hours divided by twelve for undergraduate credit hours and divided by nine for graduate credit hours.
Table 1: Enrollment Projections
25,000 Student Headcount 35,000 Student Headcount Under-graduate Graduate Total Head-count Under-graduate Graduate Total Head-count Percent Growth Under-graduate Graduate Total Head-count Percent Growth
College of the Arts 727 727 958 100 1,058 45.5% 1,170 350 1,520 109.1% College of Business 3,058 823 3,881 3,975 2,000 5,975 54.0% 4,850 4,160 9,010 132.2% College of Education 1,636 569 2,205 2,372 1,200 3,572 62.0% 2,894 2,085 4,979 125.8% College of Health & Human
Services 1,836 68 1,904 2,461 370 2,831 48.7% 3,000 730 3,730 95.9% College of Humanities & Social
Sciences 3,402 238 3,640 3,959 700 4,659 28.0% 4,830 1,500 6,330 73.9% College of Science &
Mathematics 2,287 127 2,414 3,694 410 4,104 70.0% 4,526 1,131 5,657 134.3% University College 0 350 25 375 n/a 300 75 375 n/a Other 3,133 57 3,190 2,242 184 2,426 (23.9%) 3,024 375 3,399 6.6%
TOTAL 16,079 1,882 17,961 20,011 4,989 25,000 39.2% 24,594 10,406 35,000 94.9% Fall 2004
Student Headcount
As mentioned earlier, Kennesaw anticipates that growth beyond 25,000 students will occur in off-site facilities. One of the tasks in the master planning process was to identify programs whose growth could occur off-site. The consultants were asked to assume that all graduate growth from the 25,000 planning target to the 35,000 planning target would occur off-campus.
Because Kennesaw administration is still developing its strategic plan, Table 2 identifies just under 5,100 students in specific programs that could be offered off-site, 49% short of the 10,000 student goal. The details of the off-campus programs are as follows:
College of the Arts:
All degree programs will be offered on campus; performances would go off campus on special occasions.
Table 2: Off Campus Enrollments Projections
Under-graduate Graduate Total Head-count Percent of Total
College of the Arts 0 0.0% College of Business 2,760 2,760 30.6% College of Education 1,043 1,043 20.9% College of Health & Human Services 300 200 500 13.4% College of Humanities & Social Sciences 0 0.0% College of Science & Mathematics 721 721 12.7% University College 50 50 13.3%
TOTAL 350 4,724 5,074 14.5%
35,000 Student Headcount Off Campus
College of Business:
Most of the additional graduate enrollment from 25,000 to 35,000 will be off campus.
College of Education:
About half of the graduate numbers (about 600) will be off campus and the other half on campus.
College of Health & Human Services:
The entire department of Human Services could be moved off campus if it is close by with good transportation back and forth. This includes at 35,000 student headcount 300 undergraduate majors and 200 graduate majors.
College of Science & Mathematics:
The graduate growth from 410 to 1131 will all be off campus. Other students remain on campus.
University College:
As enrollments move from 25,000 to 35,000, there are significant possibilities for off-campus activities in the Undergraduate College, such as degree completion students through the proposed undergraduate degree in interdisciplinary studies.
The enrollment projections are the foundation for all projected classroom and laboratory space needs and any other space needs based upon total number of headcount or FTE’s.
T e c h n i c a l M e m o r a n d u m
Date May 2005
Project Kennesaw State University Master Plan
Subject Faculty and Staff Projections Section 4 B2
From HGA, Inc.
To President Betty L. Siegel
1. FACULTY AND STAFF PROJECTIONS
1.1 Assessment of Current Faculty/Staff Adequacy
The following highlights and graphics are from the 2004-05 Kennesaw State University Fact Book:
• The full-time faculty grew substantially in all seven colleges over the past five years.
• KSU's FTE student to full-time faculty ratio is substantially above the average of the USG state universities at 28:1. • About one-fourth of all KSU
courses are taught by part-time faculty.
• Less than half (43%) of all KSU faculty were tenured in Fall 2004, due in part to the addition of 80 new faculty.
• Fifty percent (50%) of the faculty have been at the university for five years or less.
Even though KSU has increased its full-time instructional faculty by 43% over the last five years, the student FTE per FT faculty ratio has increased by almost 17%. It peaked in Fall 2003 with a 31:1 ratio.
2. FACULTY AND STAFF PROJECTIONS
In work sessions with KSU representatives, two objectives were mentioned for faculty growth:
§ Reduce the current student faculty ratio by 25%, and
§ Reduce the current full-time to part-time faculty ratio by 10%.
In order to accomplish both of these goals, faculty will need to grow at the same average rate as the college to which they belong plus 25%. While the additional growth factor may need to be targeted in specific disciplines, Kennesaw did not have available a detailed faculty growth plan. Therefore, the additional faculty growth rate of 25% is assumed across all the colleges. Table 1 from Section 4 B1 shows the percent increase in each of the colleges and for the entire University. Staff growth is factored at half the rate of the faculty growth rate.
T e c h n i c a l M e m o r a n d u m
Date May 2005
Project Kennesaw State University Master Plan
Subject Space Needs Analysis by Room Type Section 4 B3
From HGA, Inc.
To President Betty L. Siegel
SPACE NEEDS ANALYSIS BY ROOM TYPE 1.0 Classroom Analysis
Classrooms are defined as any room generally used for scheduled instruction requiring no special equipment and referred to as a "general purpose" classroom, seminar room, or lecture hall. Classroom service space directly supports one or more classrooms as an extension of the classroom activities by providing media space, preparation areas, or storage. The classroom station size includes the classroom service area space; however, additional service space can be justified on a program or classroom basis.
CLASSROOM UTILIZATION
Process
Utilization of classrooms was reviewed using Fall 2004 course and facility data. Understanding how classrooms scheduled and utilized provides the foundation for and assists in the formulation of the classroom guideline application.
The utilization analysis includes scheduled classroom use by day and time of day, as well as classroom utilization analyzing weekly room hours of use and student station occupancy percentage. The information is used to guide the space needs analysis component in the overall master planning process.
Utilization for a room is determined by calculating the average enrollment of the courses taught in the room along with the total weekly student contact hours, weekly room hours, and its student station occupancy percentage. Weekly student contact hours are calculated by multiplying the enrollment of a course by the weekly contact or room hours that the course is held. Weekly room/contact hours are determined by calculating the number of hours a course meets (start and end times) and multiplying the result by the number of days the course meets each week. Both of these factors are totaled on a room-by-room basis. If a course does not meet for a full term, the number of hours is prorated by the number of weeks in a semester. The student station occupancy for a room is determined by dividing the room's weekly student contact hours by the room's weekly student contact hour capacity (a course's weekly contact hours times the room's number of student stations). This study did not include analysis of quality of space, sight lines, acoustics, or equipment in rooms.
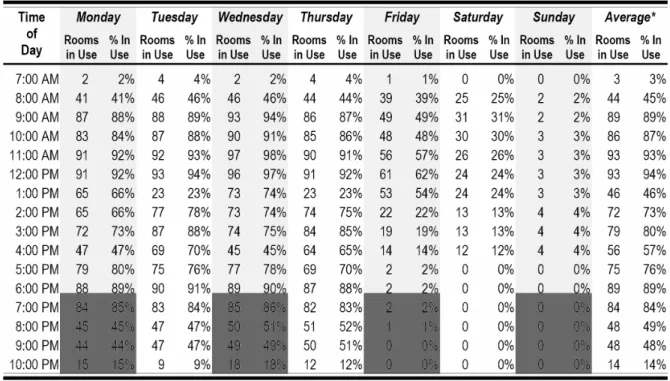
Scheduled Classroom Use by Day and Hour
The University has 99 classrooms that are very well used. The number of classrooms in use from Monday through Friday by hour shows that peak times are from 9:00 AM to 12:00 PM and 6:00 PM through 8:00 PM. During these times, 84% to 98% of the classrooms are scheduled. Wednesdays at 11:00 AM 97 of the 99 classrooms are in use. KSU shows relatively strong use of its classrooms in the evenings with up to 90 rooms in using during 6:00 PM to 8:00 PM. Typical of most campuses, Friday afternoons show a lower use of classrooms as illustrated in the following charts. However, KSU has good use mid-morning with no fewer than 49% of classrooms in use. Sixty-two percent (62%) of classrooms in use until 1:00 PM. On Saturday, KSU has approximately one-third of its rooms in use.
It is typical to see a significant decrease in scheduled use at noon through about 1:00 PM or 1:30 PM. While the number of classrooms in use does decrease during that time it is not as great as at other institutions.
It is worth noting that as institutions reach and exceed the 80% level of classrooms in use the more difficult it becomes to find available classrooms in the right geographical locations at the right classroom capacities. The following table and graphs illustrate the classroom use by hour for each day of the week. The average percent of classrooms in use is based on Monday through Thursday and excludes Friday. Including Friday in the average distorts how well the rooms are scheduled Monday through Thursday and does not reflect scheduling trends.
W
EEKLYR
OOM/C
ONTACTH
OURS(WRH
ORWCH)
=
No. of Days X ((End Time - Start Time)/60)
W
EEKLYS
TUDENTC
ONTACTH
OURS(WSCH)
=
Students X Weekly Room/Contact Hours
W
EEKLYS
TUDENTC
ONTACTH
OURC
APACITY=
Student Stations X Weekly Room/Contact Hours
S
TUDENTS
TATIONO
CCUPANCY%
=
WSCH / WSCH Capacity
A
VERAGE
P
ERCENT OF
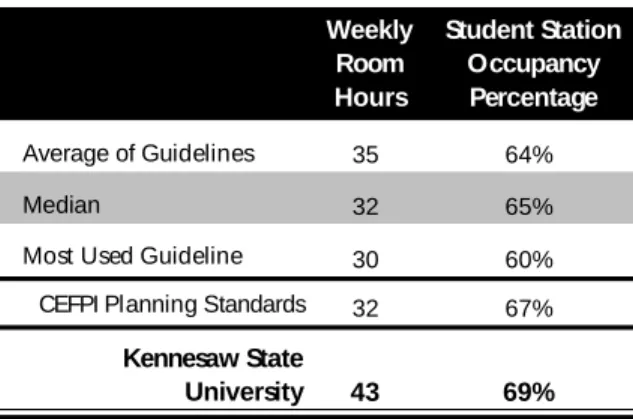
Weekly Room Hours Student Station Occupancy Percentage Average of Guidelines 35 64% Median 32 65%
Most Used Guideline 30 60%
CEFPI Planning Standards 32 67%
Kennesaw State
University 43 69%
National Classroom
Utilization Expectation
Survey vs. Actual Findings
Classroom Utilization Analysis by Room Capacity
The consultants maintain a database of the different utilization expectations various states and systems use. The CEFPI Planning Standards are comparable to these utilization expectations. KSU uses its 99 classrooms 34% more than CEFPI’s weekly room hour expectations at 32
hours week. When the classrooms are in use, the student station occupancy is slightly greater (69%) than the CEFPI standard expectation of 67%.
When reviewing the classroom utilization by room capacity, weekly room hours of use are high for almost all classroom capacities. The five (5) rooms with seating capacities of 76-100 are scheduled the most at an average of 59 hours per week. The 20 and Under sized rooms and the classrooms with capacities of between 26 and 30 have the highest student station occupancy at 79%. The capacity ranges with the lowest weekly room hour use average are 20 and Under (one room) and 26 to 30 (nine rooms). These rooms average 26 and 29 hours per week respectively.
The graphs on the following page illustrate a common trend. Smaller classrooms typically are not scheduled as much as the larger classrooms, so as the capacity of the classrooms increase so do the weekly room hours. Conversely, smaller classrooms tend to have a greater student station occupancy ratio while the larger rooms have a lower student station occupancy ratio.
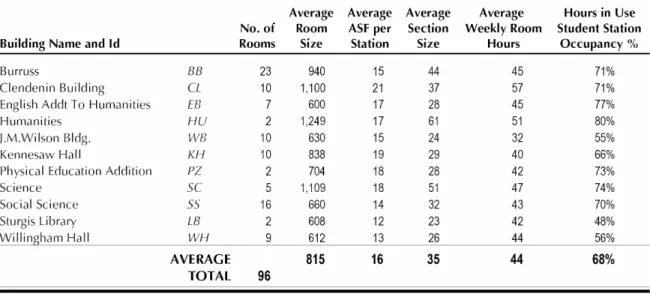
Classroom Utilization Analysis by Building Summary
The ten (10) classrooms in the Clendenin Building are utilized an average of 57 hours per week at a student station occupancy of 71%. The Humanities Building’s two (2) classrooms are scheduled an average of 51 hours a week also with the largest student station fill of 80%. The classrooms in the Science Building are also scheduled heavily at 47 hours per week.
The ten (10) classrooms in the Wilson building are scheduled the least at 32 hours per week with one of the lower student station occupancies at 55%. The lowest student station occupancy average was in the Sturgis Library.
The tables and charts on the following page show the utilization for buildings with more than one (1) classroom. The average weekly room hour increases by one whereas the student station occupancy decreases by one percent (1%). The three rooms not included in the tables and graphs are Music 107, Nursing 118, and KSU Center 104.
Classroom Space Needs Analysis
The CEFPI guideline specifies a classroom utilization goal of 32 hours of use per week at 67% student station occupancy. The guideline also calls for 15 ASF as the average classroom station size. This guideline was developed in 1985 when tablet armchair classrooms predominated and it is significantly lower than what many today’s active classrooms require. Classrooms that have good sight lines which are required by technology and flexible seating arrangements usually average between 20 and 25 ASF per student station. For this analysis, the consultants used 20 ASF per student station for classrooms.
Classroom space requirements were determined by a formula that takes the target utilization of hours per week, multiplies it by the average student occupancy target, and divides the result into the specified ASF per student station. This calculation produces a guideline of .93 ASF per weekly student contact hour for classrooms. Assignable square feet per weekly student contact hour (ASF/WSCH) is calculated as follows:
Lecture Guideline per Weekly Student Contact Hour (WSCH):
20ASF/STATION = .93ASF/WSCH
32WEEKLY ROOM HOURS X67%STUDENT STATION OCCUPANCY
Seminar Guideline per Weekly Student Contact Hour (WSCH):
25ASF/STATION = 2.0ASF/WSCH
For seminar rooms a similar calculation was made. CEFPI recommends 25 hours per week at 62.5% student station occupancy and 20 ASF per student station. For the reasons stated earlier, the consultants adjusted the square footage guideline to 25 ASF per student station. These factors produce a guideline that is equal to 2.0 ASF per weekly student contact hour. As further explanation, the total number of weekly student contact hours for a lecture course section is obtained by multiplying the enrollment of the course section by the number of meeting hours in one week. For example: a history course with 70 students enrolled which meets three (3) times a week for one hour produces 210 weekly student contact hours (WSCH). Multiplying the 210 weekly student contact hours by the classroom guideline of .93 ASF per WSCH generates 195.3 ASF of classroom space.
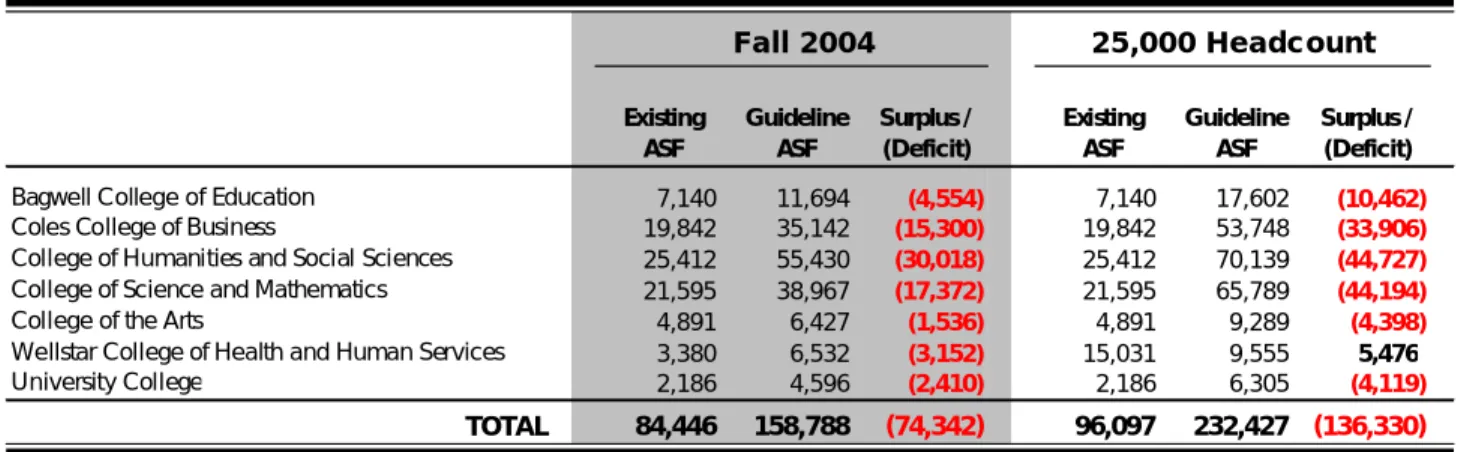
The classroom guideline application for the University generated an 88% deficit of approximately 74,300 ASF. The enrollment projection growth percentages were applied to the course data on a section–by–section basis by level to determine projected enrollment calculations, and adjustments were made by the applicable college enrollment change percentage. At the target plan, the space analysis indicates a deficit of over 136,300 ASF.
Table 4: Classroom Analysis
Fall 2004 25,000 Headcount Existing ASF Guideline ASF Surplus / (Deficit) Existing ASF Guideline ASF Surplus / (Deficit)
Bagwell College of Education 7,140 11,694 (4,554) 7,140 17,602 (10,462)
Coles College of Business 19,842 35,142 (15,300) 19,842 53,748 (33,906)
College of Humanities and Social Sciences 25,412 55,430 (30,018) 25,412 70,139 (44,727)
College of Science and Mathematics 21,595 38,967 (17,372) 21,595 65,789 (44,194)
College of the Arts 4,891 6,427 (1,536) 4,891 9,289 (4,398)
Wellstar College of Health and Human Services 3,380 6,532 (3,152) 15,031 9,555 5,476
University College 2,186 4,596 (2,410) 2,186 6,305 (4,119)
TOTAL 84,446 158,788 (74,342) 96,097 232,427 (136,330)
ASF = Assignable Square Feet
E
XAMPLE OFC
LASSROOMG
UIDELINEA
PPLICATION:
Step 1 • Calculate Weekly Student Contact Hours for Lecture Section Enrollment (70) XWeekly Room Hours (3) =Weekly Student Contact Hours (210)
Step 2 • Calculate Classroom Guideline
20 ASF/Station
= .93 ASF/WSCH
32 Weekly Room Hours X 67% Student Station Occupancy Step 3 • Calculate Guideline Square Footage
under the colleges that offer the courses but the rooms themselves are often viewed as a shared resource. Even on campuses with centralized scheduling, programs with heavy service loads need to geographically distribute their course offerings throughout the campus which requires the use of other departments’ classrooms. Other departments’ classrooms are also required to accommodate the various seating capacities and seating types.
2.0 Teaching Laboratory Analysis
Teaching Laboratories, are defined as rooms used primarily by regularly scheduled classes that require special purpose equipment to serve the needs of particular disciplines for group instruction, participation, observation, experimentation, or practice. Station sizes in teaching laboratories vary by discipline. Space requirements are calculated with a formula which is similar to that used to determine classroom space requirements, except that the ASF per student station varies by discipline.
TEACHING LABORATORY UTILIZATION
The process for quantifying teaching laboratory utilization is the same as for classrooms (page 1 of this memorandum). KSU has 45 rooms designated as teaching laboratories. The average use of the teaching laboratories is 30 hours per week at 95% student station occupancy for Fall 2004. The CEFPI standards expect between 11.25 and 22.5 hours per week with an 80% student station occupancy average for teaching laboratory utilization. The consultants often find campus wide teaching laboratory utilization of 12 to 15 hours per week.
The four departments with the highest weekly room hour (WRH) averages are: Nursing (58 WRH), Chemistry and Biochemistry (51 WRH), Mathematics (45 WRH), and English (39 WRH). The student station occupancies vary from a low of 56% (Music) to a high of 114% (Dean, College of Science and Mathematics). Sociology, Geography, Anthropology and Criminal Justice’s one teaching laboratory had the lowest scheduled weekly room hours at nine (9) hours.
The departments with student station occupancies over 100% – Science and Mathematics, English, Chemistry and Biochemistry, and Biological and Physical Sciences – are programs where the laboratory student station counts have between 20 and 22 stations yet the average enrollment in the courses is one or two greater than the number of stations.
Excluding the programs with over 100% student station occupancies, Mathematics has the highest average student station occupancy at 96% with its one (1) room being scheduled 45 weekly room hours. Sociology, Geography, Anthropology and Criminal Justice has the lowest occupancy average at 49%.
Visual Arts with ten (10) teaching laboratories has strong utilization at 20 weekly room hours at 89% student station occupancy. It is also worth noting the department with the largest number of teaching laboratories, English with 11 labs, averages 39 hours per week at 105% student station occupancy. The graphs illustrate KSU’s utilization for all departments with teaching laboratories.
Teaching Laboratory Space Needs Analysis
The CEFPI space per student station guideline has approximately 50 different subject areas for which it provides teaching laboratory modules. The guideline space per station in each discipline includes service space for laboratories and takes into account the need for enough space for new paradigms in teaching methodology requiring collaborative learning environments such as mediated laboratories. CEFPI Guidelines indicate a standard of 80% student station occupancy. The weekly room hour standard varies by discipline. Disciplines are categorized into three groups:
§ Group A • Social Sciences, Business and Education – 22.5 hours per week
§ Group B • Physical Sciences and Biological Sciences – 22.5 hours per week
§ Group C • Engineering, Architecture, Health Sciences, and Agriculture – 11.25 hours per week
In addition to these categories, the consultants used 32 hours per week for computer based laboratories used by many of the disciplines in the Humanities and University College. These laboratories tend to be used and scheduled more like classrooms where a higher weekly room hour use can be achieved. The Table 5 on the following page lists the guidelines used for each of the Colleges.
In the consultants' experience, reviewing guidelines on a national basis, teaching laboratory utilization standards for public universities average 23 hours per week at 78% of seats filled. The scheduling of teaching laboratories at KSU’s current rates has long-term implications for tighter scheduling, safety, and less available time for building maintenance. These factors, over time, will impact faculty efficiency, student safety, and overall availability of quality facilities. The teaching laboratory analysis shows that all of the colleges have a deficit in teaching laboratory space at the base year and at the target scenario.
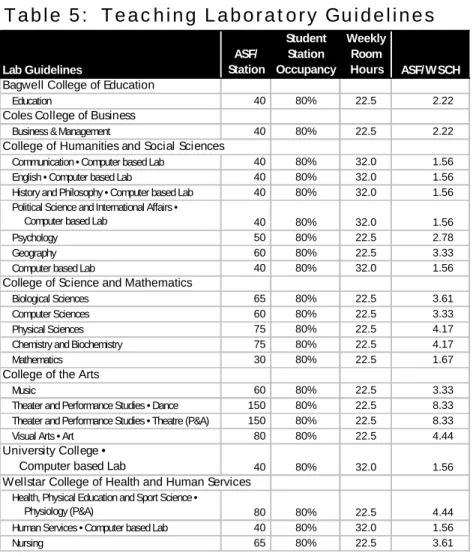
Table 5: Teaching Laboratory Guidelines
Lab Guidelines ASF/ Station Student Station Occupancy Weekly Room Hours ASF/WSCH Bagwell College of EducationEducation 40 80% 22.5 2.22
Coles College of Business
Business & Management 40 80% 22.5 2.22
College of Humanities and Social Sciences
Communication • Computer based Lab 40 80% 32.0 1.56
English • Computer based Lab 40 80% 32.0 1.56
History and Philosophy • Computer based Lab 40 80% 32.0 1.56
Political Science and International Affairs •
Computer based Lab 40 80% 32.0 1.56
Psychology 50 80% 22.5 2.78
Geography 60 80% 22.5 3.33
Computer based Lab 40 80% 32.0 1.56
College of Science and Mathematics
Biological Sciences 65 80% 22.5 3.61
Computer Sciences 60 80% 22.5 3.33
Physical Sciences 75 80% 22.5 4.17
Chemistry and Biochemistry 75 80% 22.5 4.17
Mathematics 30 80% 22.5 1.67
College of the Arts
Music 60 80% 22.5 3.33
Theater and Performance Studies • Dance 150 80% 22.5 8.33
Theater and Performance Studies • Theatre (P&A) 150 80% 22.5 8.33
Visual Arts • Art 80 80% 22.5 4.44
University College •
Computer based Lab 40 80% 32.0 1.56
Wellstar College of Health and Human Services Health, Physical Education and Sport Science •
Physiology (P&A) 80 80% 22.5 4.44
Human Services • Computer based Lab 40 80% 32.0 1.56
Nursing 65 80% 22.5 3.61
Table 6: Teaching Laboratory Analysis
Fall 2004 25,000 Headcount Existing ASF Guideline ASF Surplus / (Deficit) Existing ASF Guideline ASF Surplus / (Deficit)
Bagwell College of Education 0 950 (950) 0 1,442 (1,442)
Coles College of Business 0 607 (607) 0 932 (932)
College of Humanities and Social Sciences 11,419 18,426 (7,007) 11,419 23,242 (11,823) College of Science and Mathematics 18,861 36,156 (17,295) 18,861 60,680 (41,819)
College of the Arts 14,579 26,397 (11,818) 14,579 37,663 (23,084)
Wellstar College of Health and Human Services 5,518 15,696 (10,178) 20,024 22,772 (2,748)
University College 437 1,083 (646) 437 1,486 (1,049)
TOTAL 50,814 99,315 (48,501) 65,320 148,217 (82,897)
3.0 Open Laboratory Analysis
The category of open laboratory space (220’s) consists of rooms that are open for student use and are not used on a regularly scheduled basis. These rooms provide equipment to serve the needs of particular disciplines for group instruction in informally or irregularly scheduled classes. Alternatively, these rooms are used for individual student experimentation, observation, or practice in a particular field of study. The size of these laboratories is based on equipment size and/or on the station size and student count desired and should be determined on an individual basis. Types of rooms included in this category are computer laboratories, language laboratories, music practice rooms, and tutoring and testing facilities.
Open laboratories are not specifically addressed by the CEFPI guidelines. In recent benchmarking and consulting work with several statewide systems, the consultants found between five (5) and ten (10) ASF per Student FTE allocated for space in this category. The consultants note that the amount of space the University has classified in this category is approximately three (3) ASF per Student FTE, at the low end of what the consultants expect to find at institutions similar to Kennesaw State University.
The consultants believe that a reasonable guideline for the University in open laboratory space is four (4) ASF per Student FTE. This is a number lower than the benchmark range, but closer to the amount of space the University currently provides in this category. For Fall 2004, the analysis shows a deficit of 14,200 ASF. For the target scenario, the open laboratory deficit increases to 37,000 ASF.
4.0 Research Laboratory Analysis
Research laboratories (250’s) are rooms used for unscheduled laboratory experimentation or training in research methods and observation. The research may be conducted by either faculty or students for both funded and non-funded research. This room type does not have utilization expectations.
KSU has less than 900 ASF in research space. Determining research space needs is a complex issue which requires an examination of many different factors. KSU does not have a long history of research expenditures, research space, and internal policies affecting research. Direction is still under development with a preliminary goal to double research activities. The existing provision for research space is inadequate to support KSU’s current mission much less having the resources to provide for future programs or mission changes. In addition, the lack of research space is a deterrent for prospective faculty.
Without a lot of existing data, the consultants chose an approach based on the precept that KSU administration expects to increase their sponsored research activity. Therefore, the methodology used is built on future productivity of faculty, which was developed by the consultants based on a space per tenured/tenure-track faculty. The consultants have tested this model at many different universities with a great deal of confidence.
The guideline varies depending on the type of research lab space required by particular disciplines. The guidelines and disciplines are grouped as follows:
§ Intensive Laboratory Needs – 900 ASF per Faculty • Biology / Chemistry § Moderate – 600 ASF per Faculty • Psychology
§ Non-Intensive – 50 ASF per Faculty • Art / Business / Computer Science / Education / Humanities / Mathematics / Music / Social Sciences / Theatre
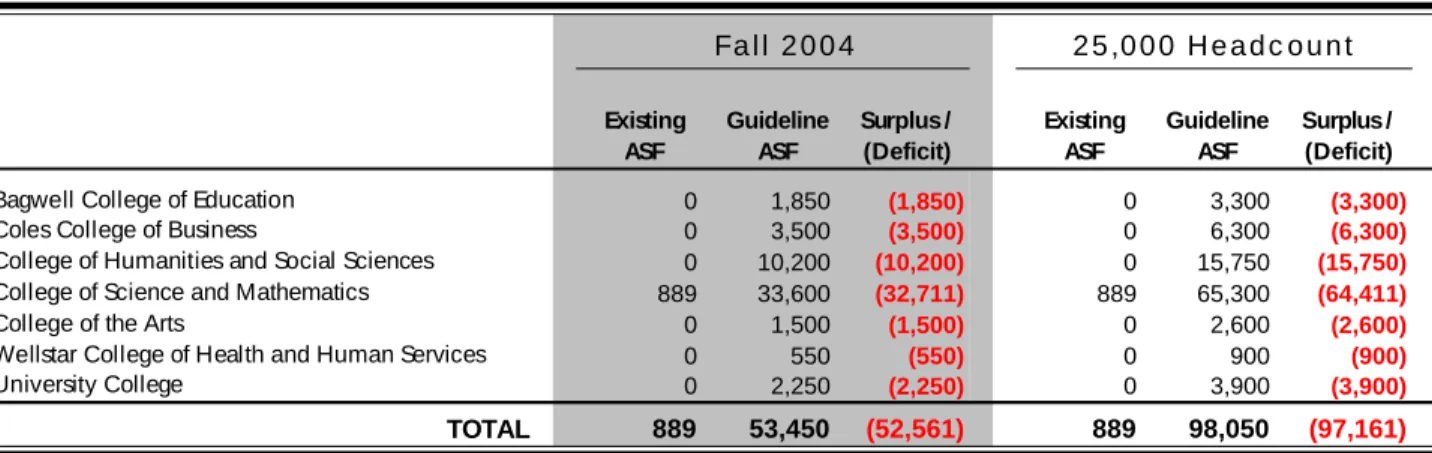
The consultant’s method based on square footage per tenured/tenure-track faculty generated a space need of just over 53,500 ASF for research space, showing a deficit of 52,600 ASF at the base year. At the future scenario, the guideline calculates a need for 98,100 ASF of space for research, producing a deficit of 97,200 ASF.
The needs shown are approximate. As a strategic plan for research evolves, the research space needs should be re-examined based on the types of research programs. The objective of the research analysis is to point to the magnitude of need and bring to light the severe deficit in this space category across the campus. Without additional research space, KSU will have a difficult time supporting its mission, faculty, and students.
5.0 Office Space Analysis (Academic and Administrative)
Process
The CEFPI guideline determines office space needs based on major categories of staff and application of space amounts for office service and conference space needs. Kennesaw State University provided staffing information by job category for each college and major administrative unit. The consultants then applied the CEFPI guidelines to each major category. The amount of office space allotted to each position is specified based on the status and duties of the employee.
CEFPI identifies certain units to receive an additional amount (mid-range 60 ASF) of office space per headcount for extra office space or studio space. These units are: Architecture, Art, Law, and Music. CEFPI also recommends that supplemental conference and reception space be allotted to departments on an as needed basis.
When viewing the guidelines for office space, it is important to note that many older buildings on campus have offices that are larger than the size specified by the CEFPI guidelines. The average office size on campus is 141 ASF. The most commonly used guideline is 130 ASF. When using the 130 ASF per office to calculate space needs and comparing the calculation to the average of 141 ASF per office of existing office space, the analysis may under-represent the
Table 7: Research Analysis
Fall 2004 25,000 Headcount Existing ASF Guideline ASF Surplus / (Deficit) Existing ASF Guideline ASF Surplus / (Deficit)
Bagwell College of Education 0 1,850 (1,850) 0 3,300 (3,300)
Coles College of Business 0 3,500 (3,500) 0 6,300 (6,300)
College of Humanities and Social Sciences 0 10,200 (10,200) 0 15,750 (15,750)
College of Science and Mathematics 889 33,600 (32,711) 889 65,300 (64,411)
College of the Arts 0 1,500 (1,500) 0 2,600 (2,600)
Wellstar College of Health and Human Services 0 550 (550) 0 900 (900)
University College 0 2,250 (2,250) 0 3,900 (3,900)
TOTAL 889 53,450 (52,561) 889 98,050 (97,161)
necessary to balance the guidelines against the reality of the average size of existing offices when interpreting the results of this analysis for use in detailed program planning in new construction or renovation.
Table 8: Office Guidelines
Employee Type: Applied per Headcount
Office ASF Conference ASF Service ASF Executive 250-300 60-100 40-80 Administrative 160 50 30 Professional 130 15 30 Faculty 130 15 30
Faculty req Studio Office 190 15 30
Temporary Faculty 65 10 15
CEd Instructor/Instructional Resource Specialist 20 0 0
Technical/Paraprofessional 120 15 30
Secretarial/Clerical 120 15 30
Graduate Assistant 55 0 0
Student Assistant/Worker 55 0 0
Police Officer / Security 30 0 0
Skilled Crafts 0 0 0
Service Maintenance 0 0 0
Academic Office Space
The base year guideline analysis shows a deficit of 81,000 ASF which increases to 209,300 ASF for the target plan.
Administrative Office Space
Offices used to conduct administrative activities in support of the academic functions of the institution are categorized as administrative office and support space. For the base year,
Table 9: Academic Office Analysis
Fall 2004 25,000 Headcount Existing ASF Guideline ASF Surplus / (Deficit) Existing ASF Guideline ASF Surplus / (Deficit)
Bagwell College of Education 20,286 22,980 (2,694) 20,286 37,050 (16,764)
Coles College of Business 21,185 29,410 (8,225) 21,185 48,105 (26,920)
College of Humanities and Social Sciences 37,583 55,280 (17,697) 37,583 81,120 (43,537)
College of Science and Mathematics 21,802 34,865 (13,063) 21,802 64,445 (42,643)
College of the Arts 7,414 20,560 (13,146) 7,414 33,165 (25,751)
Wellstar College of Health and Human Services 13,768 25,170 (11,402) 18,137 40,370 (22,233)
University College 3,559 9,195 (5,636) 3,559 13,605 (10,046)
Graduate Studies 1,755 1,565 190 1,755 2,355 (600)
Continuing Education 13,889 18,855 (4,966) 13,889 24,230 (10,341)
Chief Information Officer 12,036 16,730 (4,694) 12,036 21,125 (9,089)
Vice President for Academic Affairs 6,467 6,105 362 6,467 7,840 (1,373)
TOTAL 159,744 240,715 (80,971) 164,113 373,410 (209,297)
guideline analysis shows a 8,800 ASF office space deficit. The target guideline analysis shows the administrative office space deficit increases to 30,600 ASF.
The consultants are not convinced that the CEFPI Guidelines adequately address the need for administrative office space for high level executives. The consultants frequently use and have observed in other guideline systems an average between 250 and 300 ASF per office for these high level executives whereas the CEFPI Guidelines only use 180 ASF per office. The consultants used the larger square footages for the president and vice presidents in this analysis.
6.0 Library Analysis
Most of the guideline systems for library space utilize one set of factors for collections, another for readers, and a third for service space. This approach is used by the CEFPI guidelines. The library analysis is based on collections data reported in the KSU Factbook. Growth is assumed at 1.5% per year. The analysis includes all space assigned to and used by the library (room use codes 300’s, 400’s, 600’s, and 700’s). The space reflected in the Space Needs Analysis Tables 1 and 2 in memorandum 4B does not reflect all the space in the library building.
The CEFPI Guidelines for library collections assumes a sliding scale starting with .10 ASF per volume to .07 ASF per volume for collection space. Refer to the table below. Reader space calculations are based on a percentage of total population as follows: 15% factor for undergraduate students FTE, 20% factor for graduate students FTE, and 10% to the total full-time equivalent faculty. In determining the guidelines for reader station sizes, the consultants believe the 25 square feet per reader station recommended by CEFPI is not adequate because of the increased use of electronic study stations. The consultants applied 30 ASF per reader station for all reader stations understanding that some will require less and others will require more.
CEFPI suggests 25% of the total collection and reader station space for service and staff space. ACRL, in their most recent guidelines, changed this category to 12.5%. The consultants used the 12.5% figure because the 25% factor appears to overgenerate space needs at larger institutions. For similar reasons, lounge space is allotted at one (1) ASF per study station rather the three (3) recommended by CEFPI. It should be noted that the service space calculation is intended to include office space for the library staff.
Table 10: Administrative Office Analysis
Fall 2004 25,000 Headcount Existing ASF Guideline ASF Surplus / (Deficit) Existing ASF Guideline ASF Surplus / (Deficit)
Office of the President 13,844 11,750 2,094 13,844 15,230 (1,386)
Intercollegiate Athletics 4,432 5,865 (1,433) 7,679 7,430 249
KSU Foundation 2,653 2,135 518 2,653 2,355 298
Vice President for Business and Finance 27,482 26,855 627 27,482 32,940 (5,458)
Vice President for Student Success and Enrollment
Services 28,958 39,590 (10,632) 28,958 51,635 (22,677)
Vice President for University Advancement 7,316 7,045 271 7,316 8,725 (1,409)
Vice President of Human Resources and Diversity 3,649 3,930 (281) 5,142 5,365 (223)
TOTAL 88,334 97,170 (8,836) 93,074 123,680 (30,606)