Help in Defi ned
Contribution Plans:
2006 through 2012
Table of Contents
Introduction
Executive Summary 3
About This Report 8
Data Sample Information 10
Defining Help 11
Results
Participants Using Help Are Better Off 12
Non-Help Participants Have Wider Risk Ranges 14
Usage
Help Usage Is Growing 16
Help Usage by Participants and by Assets 16
Defaults and Plan Design Have the Biggest Impact on Help Usage 19
Profiles
Type of Help Used Varies by Participant Demographics 21
Type of Help Used Varies by Age 23
Type of Help Used Varies by Account Balance 24
Predicting the Type of Help Usage 25
Retention
Do Help Participants Stay with Help? 27
A Closer Look: Partial Target-Date Funds Usage
Partial Target-Date Fund Usage Is Widespread 30
Partial Target-Date Fund Usage Negatively Impacts Risk 36
Partial Target-Date Fund Usage Negatively Impacts Returns 37
ConclusionandImplications 39
Executive Summary
This report, Help in Defined Contribution Plans: 2006 through 2012, looks at the impact of target-date funds, managed accounts and online advice—collectively referred to as “Help” throughout this report—in employer-sponsored defined contri-bution plans. It includes an analysis of 14 defined contricontri-bution plans representing over 723,000 individual participants with over $55 billion in plan assets. By linking participant Help usage with actual investment performance results, we can observe how partici-pant behavior affected portfolio risk and returns over the seven-year period between January 1, 2006 and December 31, 2012, which includes one of the most volatile periods in stock market history.
This is the third edition of this report. It updates key analyses from prior reports while also incorporating some unique and highly informative extensions. Additionally, the data sample has been significantly expanded to include 14 plans over a seven-year period (2006–2012).1
The news is highly encouraging —participants using Help continue to earn consider-ably higher returns than those not using Help and more participants than ever are using Help. Gaps in participant behavior remain, however. This study shows that retention by type of Help differs greatly, and, despite a high default rate for new employees, many participants are not using certain Help vehicles as intended.
Key findings from our analysis include:
Participants using Help do significantly better than those who
go it alone.
• Across all age ranges and a wide range of market conditions, participants using Help (“Help Participants”) earned higher median annual returns than those not using Help (“Non-Help Participants”).
• The annual performance gap between Help Participants’ and Non-Help Participants’ median returns was 3.32%, net of fees over the period 2006–2012.2 This difference
can have a meaningful impact on wealth accumulation over time. For a 45-year old Help Participant it could translate to 79% more wealth at age 65.3
1 The first edition appeared in January 2010 and covered five plans over the three-year period of 2006–2008.
The second edition appeared in September 2011 and covered eight plans over the five-year period of 2006–2010.
2 All returns reported in this research are net of fees, including fund-specific management and expense fees, and
managed account fees where applicable.
3 If two participants—one using Help and one not using Help—both invest $10,000 at age 45, assuming both participants
receive the median returns identified in this report, the Help Participant could have 79% more wealth at age 65 ($58,700) than the Non-Help Participant ($32,800).
• For the first time, we conducted a comparative performance analysis between managed account portfolios and target-date fund portfolios. As expected, there was only a modest difference in median annual returns, with managed account portfolios outperforming target-date fund portfolios by 0.50% (50 basis points), net of fees.4
• 60.5% of Non-Help Participants had inappropriate risk levels. Of those, approxi-mately two-thirds were taking on too much risk, and about one-third were taking on too little risk, jeopardizing these participants’ ability to accumulate sufficient re-tirement wealth. Individuals who are at least 50 years old—a group we have labeled “near-retirees” in this report —had the widest variability in risk levels, with some in this age group having risk levels above that of the S&P 500 Index (a diversified 100% equity portfolio). This group’s failure to reduce risk makes them particularly vulner-able to sudden market declines and may threaten their ability to retire.
Help usage is growing with target-date fund defaults driving the
increase. Managed account participants are more likely to stay
with Help.
• Help usage by participants increased to 34.4%, an increase of nearly 5 percentage points over the 30% Help usage reported in the prior edition of this report.5
On an asset basis, Help users accounted for 30.3% of the account balances in the plan sample.
• The usage of Help by assets is similar to Help usage by participants (30.3% vs. 34.4%). Yet, there are dramatic differences in usage by type of Help. Measured on a participant basis, target-date funds accounted for nearly half (49.2%) of total Help usage. However, when measured by assets, target-date funds accounted for only 12.3% of Help usage with managed accounts and online advice accounting for 87.7% of Help usage. That is, about 9 out of 10 dollars impacted by professional Help were in managed accounts or held by users of online advice. To impact the outcomes of a significant portion of plan assets, Help options need to include more than just target-date funds.
4 A comparative performance analysis of individual Help vehicles (target-date funds, managed accounts and online
advice) was not performed in previous editions of this report because some forms of Help were not well represented in all companies and all years. For this report, we had sufficient data for the years 2010-2012 to perform a comparative median returns analysis for managed accounts and target-date funds. Data limitations precluded calculating separate returns for online advice users.
5 In the 2011 edition of this report, the data for Help usage was taken between July 2010 and January 2011. In this edition,
• Target-date fund usage led the Help category, with 16.9% of all participants investing at least 95% of their assets in a target-date fund. Target-date fund Help Participants accounted for only 3.7% of plan assets, as most had small balances. The growth in target-date fund usage is largely because target-date funds are the default investment option in 12 of the 14 plans with automatic enrollment in this study. Where the data was available, we found that 88.6% of target-date fund users were defaulted into the fund.6 Across plans, target-date fund usage among participants
ranged from a high of 35.8% to a low of 1.1%.
• Managed accounts were the second most prevalent form of Help, with 12.1% of all participants using managed accounts. On an asset-weighted basis, managed account users represented 15.2% of plan assets. Managed accounts usage also varied by plan, from a high of 49.0% to a low of 2.9% of participants. One plan’s re-enrollment of all existing participants into managed accounts was the driving factor behind the highest (49.0%) managed account usage, once again showing the significance of defaults in Help usage.7
• Online advice Help usage was 5.4% across all plans, ranging from a high of 13.7% to a low of 0.7% of participants. Online advice users accounted for 11.4% of plan assets, with most users having significantly higher than average balances than participants using any other form of Help.
• Help Participants in managed accounts were significantly more likely to stay with Help than target-date fund participants. Managed account Help Participants’ five-year retention rate was 87.0% compared to 56.8% for target-date fund
Help Participants.
Partial target-date fund usage
8is widespread.
This negatively impacts participant returns.
9• Many participants were not using target-date funds as designed. Only 37.8% of participants investing in target-date funds were using them as a “one-stop” invest-ment. The majority of target-date fund participants allocated only a fraction of their investments to the target-date funds. More than one in four participants (27.9%) in our study had partial allocations to target-date funds.10
6 Recordkeeping data indicating default versus active enrollment was available for plan years 2010 through 2012 for six
of the 14 plans. The 88.6% default rate covers only these plan years for the six plans.
7 A case study of this plan’s re-enrollment can be found in the prior report, Help in Defined Contribution Plans: 2006–2010, available at www.financialengines.com and www.Aon.com.
8 Partial target-date fund usage was calculated based on holdings as of the start of 2012.
9 For workers to qualify as receiving Help through target-date funds in this report, participant portfolios were required to
have at least 95% of their 401(k) account invested in one or two target-date funds. Partial target-date fund portfolios are those with greater than 0% and less than 95% in target-date funds and are categorized in the Non-Help group.
• Partial target-date fund usage had a negative impact on returns. Median annual returns for 2010 to 2012 were 2.44% (244 basis points) lower for partial target-date fund participants than for Help Participants in the same time period, net of fees.11
• Almost three out of four (74.3%) partial target-date fund participants held less than half of their portfolio in a target-date fund, with the average allocation being 35.0% of the account.
• The pattern of partial allocations to target-date funds suggests influences both from active elections and plan design features, such as a match in company stock. • Partial target-date fund participants tended to misallocate the remainder of their
portfolios. As a result, over six in 10 (61.8%) had inappropriate risk levels for their overall portfolios.
Type of Help used varies greatly by age and account balance.
Multiple Help options are required to meet participant needs.
• Plan sponsors that do not offer all three types of Help are likely to underserve significant population segments. Younger participants with smaller balances were most likely to use target-date funds, while younger participants with larger balances were most likely to use online advice. Older participants, including near-retirees, were most likely to use managed accounts.
• Automatic enrollment of new hires into target-date funds created high Help usage among the youngest groups of participants. Among Help Participants, 88.2% of those under age 25 and 68.5% of those between ages 25 and 35, used target-date funds. Target-date fund Help Participants averaged 38 years of age and had a median 401(k) account balance of $3,972.
• The majority (54.0%) of Help Participants age 55 and older used managed accounts. For Help Participants with account balances above $15,000, managed accounts were the most widely used form of Help, with the highest usage among participants with account balances between $50,000 and $250,000. Managed account users averaged 48 years of age and had a median 401(k) account balance of $44,216.
• Higher balances correlated with increased usage of online advice. Online advice was the most popular form of Help for individuals with balances above $250,000, and the second most widely used form of Help for participants with defined contribution account balances between $50,000 and $250,000. Online advice Help Participants averaged 45 years of age and had a median 401(k) account balance of $72,732.
• Target-date fund Help Participants had the lowest average deferral rates (4.4%) of any group, including the Non-Help Participants who had an average contribution rate of 6.6%. Help Participants using managed accounts contributed 7.5% on aver-age and those using online advice contributed 9.0% on averaver-age. All groups with the exception of the target-date fund Help Participants, saw their average contribution rate increase from the prior version of the report.12
12 Contribution rates for managed account Help Participants increased from 6.9% to 7.5%, and for online advice Help
Participants from 8.4% to 9.0% compared to our prior report. Non-Help Participant contribution rates increased from 6.3% to 6.6%.
Introduction: About This Report
This report analyzes the impact and use of employer-provided professional investment help in defined contribution plans. It builds upon two prior editions of this research published by Aon Hewitt and Financial Engines in early 2010 and late 2011.
Our last report included eight large plan sponsors and looked at the five-year period between 2006 and 2010; this report includes 14 large plan sponsors and examines the seven-year period from 2006 through 2012.
Employer-provided retirement systems play a critical role in helping participants meet their financial and retirement needs. For more than three-quarters of employers (77%), a defined contribution plan is the primary source of retirement income for their em-ployees, according to Aon Hewitt’s 2013 Trends & Experience in Defined Contribution Plans study of more than 400 employers.13
To help employees manage the risks and challenges of retirement planning, more and more plan sponsors are offering investment help and advisory services to their 401(k) participants. Aon Hewitt’s 2013 Trends & Experience in Defined Contribution Plans research also shows three-quarters of employers now offer some type of professional investment help to participants. Online advice and managed accounts are increasing in prevalence with 46% of plans now offering online advice, up from 37% in 2011. Managed accounts have had the largest increase in growth in the last few years with 52% of plans now offering this service, up from 29% in 2011. Also, 86% of employers currently offer target-date funds, up from 81% in 2011.
The central question in previous editions of this report was whether participants using target-date funds, managed accounts and online advice—collectively referred to as “Help” throughout this report—were better off than those who did not use Help. Now, over a longer period, we examine that question again, and we again look at Help usage to continue to deepen our understanding of participant behaviors and preferences. New to this report is a look at retention. That is, once participants start using Help, do they stay with it? And, does retention behavior vary by type of Help?
Previously we reported on a variety of actions and behaviors of participants not using Help, such as holding inappropriate risk levels, investing in inefficiently diversified portfolios, engaging in market timing, or holding concentrated positions in company stock. While such problems remain cause for concern, in this report we examine a different issue in greater detail—the portfolio outcomes of participants who are not using target-date funds as designed.
This report has been a collaborative effort between Aon Hewitt and Financial Engines. Each company contributed complementary participant data, financial technology and portfolio analytics that helped make this report possible. It is our hope that plan sponsors, providers and policy makers will find this data useful and use it to help more American workers achieve secure retirements.
Introduction: Data Sample Information
Usage and Profiles
The data included in this report was drawn from 14 defined contribution plans; the sponsors of which are joint clients of Aon Hewitt and Financial Engines. The plans vary in size from 4,000 to more than 150,000 participants. Collectively, the plans represent more than 723,000 participants with over $55 billion in assets.
All 14 plans met the study criteria of having all three forms of Help (target-date funds, managed accounts and online advice) available to their plan participants, although they may have introduced the various forms of Help at different times. Eight of the 14 plans in this report were also represented in the most recent edition of this report published in September 2011. The current data sample is a superset of the 2011 study.
In terms of plan design, 13 of the 14 plan sponsors automatically enroll new employees in the 401(k) plan. All but one of these plans has target-date funds as the default in-vestment option; the remaining one uses managed accounts as the default inin-vestment option.
The following table provides a general overview of the plans included in the study:
Plan Feature Auto-Enrollment
Target-Date Funds as Default Investment Option Managed Account as Default Investment Option
Plans with Feature 13
12 1 Company Stock as Investment Option 8
The Usage and Profiles sections of the report rely on 401(k) account and savings data collected between January 1 and June 30, 2013. Each individual participant’s Help classification was assessed and based on the form of Help, if any, the participant was using when the data snapshot of the participant’s 401(k) account was taken. Similarly, the above plan design information (such as company stock as an investment option) is based on the plan rules in place during the same 2013 time frame.
Results
The Results section focuses on participant portfolio returns and risk levels from Janu-ary 2006 through December 2012. For the Results section in this edition of the report, 14 plans met the criteria of having returns data for at least one form of Help available for the entire range of 2006–2012.
14 2013 Trends & Experience in Defined Contribution Plans, Aon Hewitt. This report shows 86% of plans offer target-date
funds. It also shows 52% of plans offer managed accounts and 46% offer online investment advice.
15 In many cases a participant’s retirement year will lie between two target-date fund years. In such cases it is
consid-ered appropriate usage for the participant to allocate their portfolio between the two adjacent target-date funds. To avoid excluding such use cases, we allow target-date fund users to invest in two separate target-date funds.
16The Usage and Profiles sections of the report rely on 401(k) account and savings data collected between January
and June 2013. To be considered an online advice Help user, the participant must have used online advice in the 12-month period prior to this date range.
Introduction: Defining Help
This report focuses on three prevalent types of professional investment help provided by employers in defined contribution plans today.14
• Target-date funds • Managed accounts • Online advice
Throughout this report, target-date funds, managed accounts and online advice are collectively referred to as “Help.” In addition, we applied the following requirements to each type of Help:
Target-date funds—Target-date funds are generally intended to be a “one-stop” investment product, with a participant’s entire portfolio invested in a single target-date fund. Therefore, participants were required to have at least 95% of their 401(k) account invested in one or two target-date funds to qualify as receiving Help for this report.15 Partial target-date fund portfolios, that had allocations of greater than 0%
and less than 95% in target-date funds, were categorized in the Non-Help group. Later in the report, we examine the characteristics of the partial target-date fund population in more detail.
Managed accounts—Participants who enroll in a managed account program have
their 401(k) accounts professionally managed by the managed account provider, relieving the participant from having to make ongoing investment decisions. To qualify as using Help through managed accounts, participants had to be currently enrolled in a managed account program. The managed account program does not allow for partial usage; the member’s entire account must be enrolled in the program.
Online advice—Online advice provides participants with specific savings and investment recommendations for their 401(k) accounts. It is up to the participant to implement the advice at a time of their choosing. To qualify as receiving Help through online advice, participants must have used online advice at least once within the last 12 months.16 Participants who last used online advice more than 12
months ago were categorized in the Non-Help group.
Non-Help Participants—Participants not using any of the three types of Help were placed in the Non-Help group.
17 Please see the Methodology Appendix for more details.
18 The first edition of this report, Help in Defined Contribution Plans: Is It Working and for Whom?, was published in
Janu-ary 2010. The second edition, Help in Defined Contribution Plans: 2006 Through 2010, was published in September 2011.
19 100 basis points = 1%.
20All returns reported in this research are net of fees, including fund-specific management and expense fees and
man-aged account fees where applicable.
Results: Participants Using Help
Are Better Off
The first dimension on which we compared Help Participants to Non-Help Participants was portfolio returns. In this report we analyzed 14 companies over the seven-year period from 2006 through 2012.17 The prior edition analyzed eight companies over five years
(2006 through 2010).
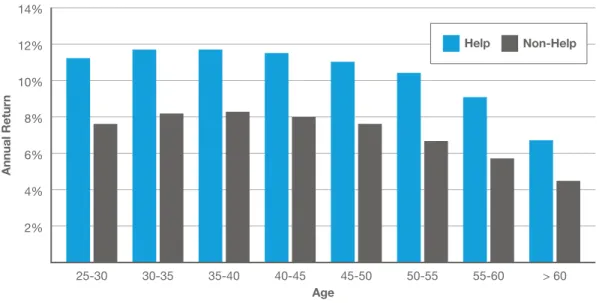
Consistent with prior findings18, we found that Help Participants earned significantly
higher returns than Non-Help Participants across all age groups. This is illustrated in Figure 1, which shows the median returns for Help and Non-Help Participants across a range of age groups.
Age
Annual Retur
n
14% 12% 10% 8% 6% 4% 2%
FIGURE 1: MEDIAN RETURNS
25-30 30-35 35-40 40-45 45-50 50-55 55-60 > 60
Help Non-Help
On average, across eight different age cohorts, the difference in annual returns for Help Participants was 3.32% (332 basis points19) higher than for Non-Help Participants, net
of fees.20 Additionally, the difference in annual returns for Help Participants was better
in each age group, with the median annual performance difference ranging from 2.13% to 3.70%.
Both the average difference in returns of Help Participants and the pattern across age categories are consistent with the prior editions of the report. In the first and second editions of this report, Help Participants’ returns were higher than Non-Help Partici-pants’ by 1.86% (186 basis points), net of fees, for the period 2006–2008 and 2.92% (292 basis points), net of fees, for the period 2006–2010.
It is important to note that the returns shown in Figure 1 are median annual returns. The number of observations a participant has in the overall data set will be determined by how many full calendar years they are participating in their company’s 401(k) plan. For example, a participant with seven full calendar years of participation will appear in the final data set seven times, while a participant with one full year of participation will appear only once in the data set. To mitigate the impact of variations in the number of participants across the years, we equal-weighted the years in our analysis.
An alternate methodology would be to calculate mean (or average) compound or cumulative returns. This methodology was not employed because it would require seven full years of data for every participant. Those with fewer than seven full years would be excluded entirely from the data set, and such exclusions can significantly distort the results and reduce their statistical significance.
The Value of Help
The higher returns earned by Help Participants can have a significant impact on their portfolio balances. As an example, consider a Help Participant and a Non-Help Par-ticipant. If both invest $10,000 starting at age 45 and receive the median returns for each age segment shown in the report, by age 65, the Help Participant’s portfolio could be 79% larger than the Non-Help Participant’s portfolio ($58,700 for the Help Partici-pant vs. $32,800 for the Non-Help ParticiPartici-pant)—a substantial difference in retirement wealth.21
22 All reported risk levels are forward-looking annual standard deviation values. Please see the Methodology Appendix
for additional details.
23 This is also known as the interquartile range. For each category, the bottom line shows the 25th percentile of risk levels
and the top line shows the 75th percentile of risk levels.
24 The Stock Index portfolio is based on the Standard and Poor’s S&P 500 Index and represents a diversified all-equity
portfolio. The Bond Index portfolio is based on the Barclays Capital U.S. Aggregate Bond Index and represents a diversified all-fixed income portfolio. Additional details can be found in the Methodology Appendix.
25 As proxied by the S&P 500 Index.
Results: Non-Help Participants
Have Wider Risk Ranges
20%
10%
5% 15%
FIGURE 2: PORTFOLIO RISK RANGES
> 60 Bond Index 55-60
50-55 45-50
40-45 35-40
30-35 25-30
Risk (Annual Standar
d Deviation)
Age
Stock Index
Help Non-Help
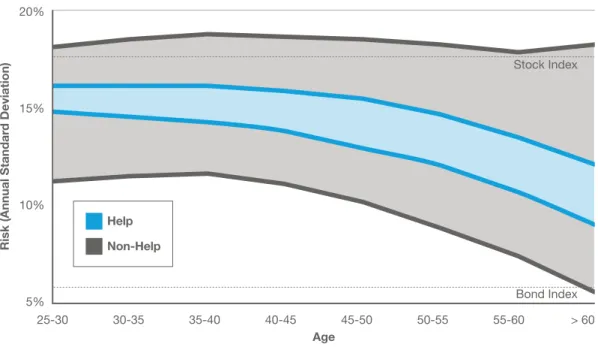
A second dimension on which we compared Help Participants to Non-Help Partici-pants was portfolio risk. For this, we used the standard deviation of returns, which mea-sures how variable the portfolio’s returns are likely to be over a given period of time.22
In Figure 2 we show the middle 50%23 of risk levels for both Help Participants and
Non-Help Participants, as well as the risk levels for a Stock Index and Bond Index portfolio for comparison purposes.24
Similar to the second edition of the report, Non-Help Participants had a much wider risk range than Help Participants. Although the upper end of the Non-Help Partici-pants’ risk range decreased from the second edition, this was offset by a decrease in the lower end of their risk range. The upper end of the risk range was still above that of a well-diversified all-equity portfolio.25 The risk range was the widest for near-retiree
Non-Help Participants, which is a concern given they have the least amount of time to recover from portfolio mistakes or a market downturn.
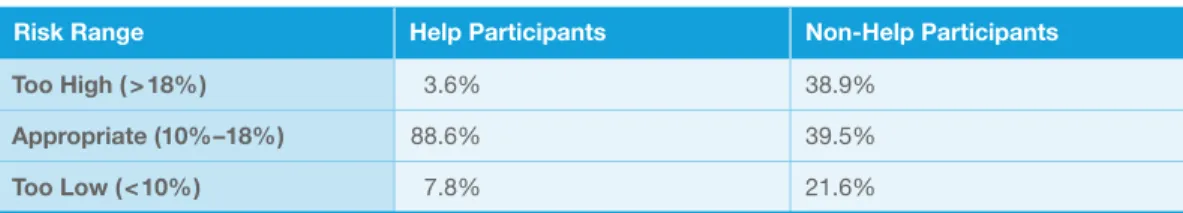
To provide additional insight into how many participants had portfolios with inappropri-ate risk levels, we calculinappropri-ated the percentage of participants who were outside the range of appropriate risk levels. In this report, the majority of Help Participants had risk levels in the 10% to 18% range, so we used this as our proxy for “appropriate” risk levels.26 This
range is comparable to a selection of well-diversified portfolios holding a combination of equity and fixed income investments. Results are shown in Figure 3 below.
FIGURE 3: PARTICIPANT RISK RANGE DISTRIBUTION
Risk Range Help Participants
Too High (> 18%) Appropriate (10%–18%) Too Low (< 10%)
3.6% 88.6% 7.8%
Non-Help Participants 38.9%
39.5% 21.6%
We found that approximately 60.5% of Non-Help Participants had inappropriate risk levels. Approximately two-thirds of those were taking on too much risk, which makes them especially vulnerable to market downturns. Approximately one-third were taking on too little risk, which can result in insufficient portfolio growth. Although opposing problems, both too high and too low risk can jeopardize a participant’s ability to retire at a time of their choosing.
Next we look at Help usage—are participants responding to Help services offered by their employer?
26This is a conservative approach that tends to underestimate the amount of Non-Help Participants at an inappropriate
Usage: Help Usage Is Growing
Based on the definition of Help in this report (see page 11), more defined contribution participants are using Help within their employer-sponsored defined contribution plans than in our previous reports. Over one-third of participants (34.4%) currently use some form of employer-provided Help to manage their defined contribution accounts, up nearly 5 percentage points from the 30% Help usage in our previous report.
While the average Help usage across the 14 plans in this report was 34.4%, total Help usage by plan ranged from a low of 17.7% to a high of 55.7%.
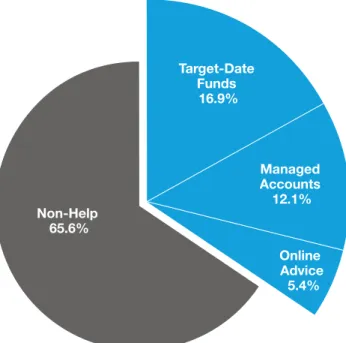
Of the participants in this report, 16.9% were target-date fund Help Participants,27 12.1%
were managed account Help Participants and 5.4% were online advice Help Partici-pants.28
Non-Help 65.6%
Online Advice 5.4% Managed Accounts 12.1% Target-Date
Funds 16.9% FIGURE 4: HELP USAGE BY PARTICIPANTS29
The target-date fund Help category grew to 16.9% of participants, up from 10.2% in our previous report. This growth has been primarily driven by the high incidence of new-hire automatic enrollment and the use of target-date funds as the dominant plan default investment option. We will look at the role of defaults and plan design in a subsequent section.
27 Total target-date fund usage (target-date fund Help Participants plus partial target-date fund participants) was 44.9%. 28 Total online advice usage (including less frequent users not included in online advice Help) was 15.0%.
Managed account usage was 12.1% in this report, compared to 13.8% in the previous report. The change was due to sample differences created by the addition of new plans to the data set for this report. Among the eight plans in our last study, managed ac-count usage increased to 14.0%.
Total online advice usage was 15.0%. However for purposes of this report we define on-line advice Help Participants as participants who used onon-line advice at least once in the prior 12 months. Using this Help definition, we found 5.4% of participants in the online advice Help category, compared to 5.7% in the previous report.
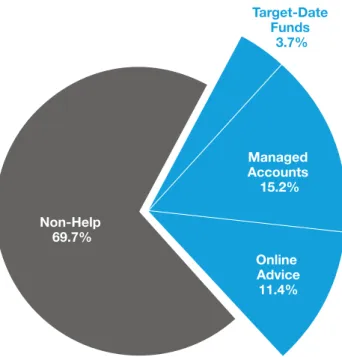
Help usage looks very different when compared by assets. Figure 5 below shows the usage of different forms of Help by assets.
Non-Help 69.7%
Online Advice 11.4% Managed Accounts 15.2% Target-Date
Funds 3.7% FIGURE 5: HELP USAGE BY ASSETS
Overall, total Help usage weighted by assets was relatively similar to the total Help usage weighted by participants (30.3% vs.34.4%), but there were big differences by type of Help. Managed accounts and online advice accounted for a much larger percentage of assets than target-date funds. This is due to the fact that target-date fund Help Participants had dramatically lower balances than managed account and online advice Help Participants. The combination of managed accounts and online advice represented 87.7% of Help usage by assets, or nearly 9 out of every 10 dollars impacted by Help. These results suggest that to meaningfully impact the outcomes of a significant portion of plan assets, it is necessary to augment Help options to include more than just target-date funds.
We next look at the range of Help usage across plans and explore some of the potential reasons for variability in Help usage. A later section will examine the participant reten-tion for Help, which can be just as important as the initial adopreten-tion of Help to the long-run retirement readiness of plan participants.
Usage: Defaults and Plan Design Have
the Biggest Impact on Help Usage
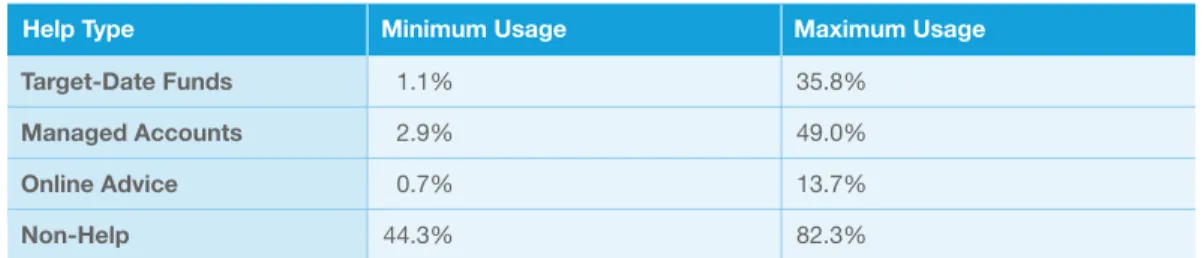
While all the employer-sponsored 401(k) plans included in this report offer target-date funds, managed accounts and online advice to participants, the overall usage and the types of Help most used by participants varied greatly, depending on the plan.
FIGURE 6: HELP USAGE, MINIMUM AND MAXIMUM BY HELP TYPE30
e g a s U m u m i x a M e g a s U m u m i n i M e p y T p l e H Target-Date Funds Managed Accounts Online Advice 35.8% 49.0% 13.7% Non-Help 82.3% 1.1% 2.9% 0.7% 44.3%
As shown in Figure 6, there was wide variability among plans in the type of Help used. Three factors appear to be driving Help usage among the 14 defined contribution plans in the study: plan design, time and participant demographics.
1. Plan design—Plan design is a significant factor when it comes to participant Help usage and appears to be the strongest driver of Help usage among the plans in this study.
The 2006 Pension Protection Act allowed organizations to automatically enroll new hires—or the entire employee population—into their 401(k) plans, and fol-lowing the subsequent Department of Labor rule on qualified default investment alternatives (QDIAs)31, the use of automatic enrollment in 401(k) plans has steadily
increased.32
Automatic enrollment or re-enrollment into a QDIA can dramatically improve participant Help usage. The last edition of this report profiled a plan that in 2010 re-enrolled plan participants into a managed account. As a result, managed account usage at the plan was high—50.2% immediately following the re-enrollment. That plan is again in this study and, at 49.0%, not only had the highest managed account usage, but also had the highest total Help usage (55.7%) across the 14 plans.
30Minimum and maximum usage values show the lowest/highest usage value among the 14 sponsors, where each
sponsor’s usage value is calculated by equal-weighting each participant observation within the given sponsor.
31A qualified default investment alternative (QDIA) is defined in the Department of Labor’s final rule: Default
Investment Alternatives Under Participant Directed Individual Account Plans, 72 Fed. Reg. 60452 (October 24, 2007). This regulation established target-date funds, managed accounts and balanced funds as QDIAs. Employers that automatically enroll new employees, convert participants in a non-QDIA investment default fund to a QDIA, or re-enroll existing participants into a QDIA are provided certain safe harbor protections.
32 2013 Trends & Experience in Defined Contribution Plans, Aon Hewitt. Automatic enrollment in 401(k) plans has grown
Automatic enrollment was a significant driver of Help usage among the plans in this report. Thirteen of the 14 plans in this study automatically enrolled new hires, and of those plans, 12 use target-date funds as the default investment option; the remaining plan uses managed accounts as the default.
Where the data was available, we found 88.6% of participants in the Help popula-tion using a target-date fund were defaulted into it, as opposed to making an active selection to invest in the fund.33 The one plan not using automatic-enrollment had
the lowest target-date fund Help utilization (1.1%) in the sample.
2. Time—Typically, Help usage goes up the longer Help is available at a plan. For example, in Figure 6, the plan with the lowest managed account usage (2.9%) had introduced managed accounts only in late 2011.
3. Participant demographics—The participant demographics at an employer can
also play a role in the types of Help most often used by participants. For example, how close participants are to retirement and how much money they have in their 401(k) accounts can strongly influence whether or not they seek Help and the type of Help most attractive to them.
In addition, an individual’s occupation can also influence who uses Help. For ex-ample, the plan with the lowest online advice Help usage (0.7%) has a large popula-tion in the retail sector that may not have frequent access to computers at work. By contrast, the plan with the highest online advice Help usage (13.7%) is an insurance company with a population more likely to be comfortable interacting with invest-ment services online.
We next examine how participant demographics affect Help usage.
33 Recordkeeping data that flags defaulted participants was available for plan years 2010, 2011 and 2012 at six of the 14
plans. The 88.6% default rate only covers only these plan years at the six plans. Automatic enrollment, new self-enroll-ment and quick enrollself-enroll-ment methods were all included in the 88.6% default rate computation.
Profiles: Type of Help Used Varies
by Participant Demographics
For this report, we have the following demographic information for each participant: • Date of birth
• Account balance
• Salary (if employed/active)
• Contribution rate (if employed/active)
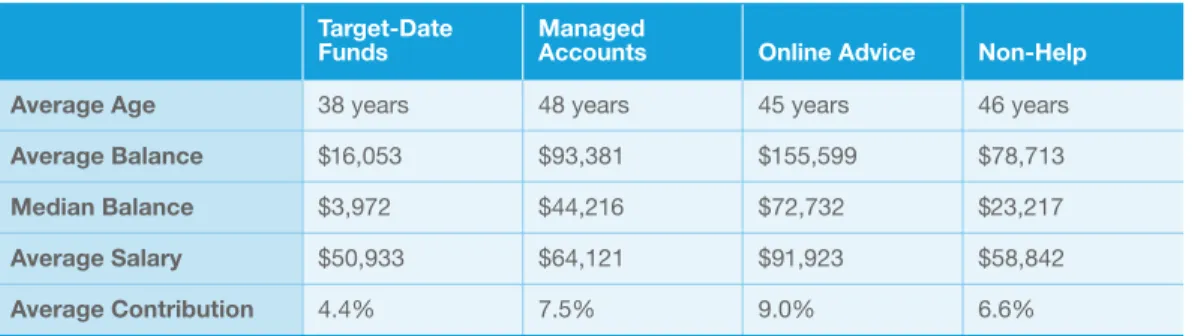
FIGURE 7: PROFILES BY TYPE OF HELP
Target-Date Managed
p l e H -n o N e c i v d A e n il n O s t n u o c c A s d n u F
Average Age 38 years 48 years 45 years 46 years
Average Balance $16,053 $93,381 $155,599 $78,713
Median Balance $3,972 $44,216 $72,732 $23,217
Average Salary $50,933 $64,121 $91,923 $58,842
Average Contribution 4.4% 7.5% 9.0% 6.6%
As we found in prior editions of this report, Help usage varied significantly across dif-ferent demographic groups. Examining the demographics of participants using Help highlights a number of trends.
Age—Across our sample, target-date fund users were the youngest segment of Help Participants. Since the last report, the average age of target-date fund users has edged down to 38 years from 39.3 years.
Managed account users, on the other hand, were the oldest segment compared to target-date fund and online advice Help Participants. The average age of managed account users—48 years old—was unchanged from our last study; online advice users’ average age increased from 41 years to 45 years.
We explore a deeper segmentation by age later in this report.
Balance, salary and contributions—Differences also emerge in participant account balance, annual salary and contribution levels. For example, online advice users had much higher 401(k) account balances and salaries. They also had the highest average contribution rates. In contrast, target-date fund Help Participants had substantially lower account balances, salaries and contribution rates. In fact, the median account balance for a target-date fund Help Participant was less than one-tenth that of a man-aged account Help Participant, and less than one-eighteenth that of an online advice Help Participant. These patterns were similar to the findings in prior reports.
A few other specific comparisons are worth noting:
• Target-date fund Help Participants had the lowest average contribution rates (4.4%), a level lower than the 6.6% average for Non-Help Participants.
• Unlike the trend for managed account and online advice Help Participants which saw their average contribution rates increase,34 the average contribution rate for
target-date fund Help Participants remained unchanged from the prior report. Perhaps this is no surprise, as target-date fund users receive no explicit guidance on how much to save, but managed account and online advice services provide contri-bution and savings recommendations to participants.
• Target-date fund Help Participants’ low average contribution rate could also be a reflection of the fact that automatic enrollment into target-date funds is often ac-companied by a modest default savings rate, such as 3%.
Balance and salary numbers were higher across all Help categories, particularly among managed account and online advice users. For example, the median balance for man-aged account users increased from $29,686 to $44,216 and for online advice users from $39,130 to $72,732. There are likely a number of different factors that contributed to higher salaries and balances across the population including wage increases, strong equity market returns and the demographics of the newest plans to the study.
Next, we will take a closer look at the demographic factors that seem to have the great-est impact on the type of Help participants are likely to use—age and account balance.
34 The average contribution rate for managed account users grew from 6.9% to 7.5% and the average contribution rate
Profiles: Type of Help Used
Varies by Age
Age Range
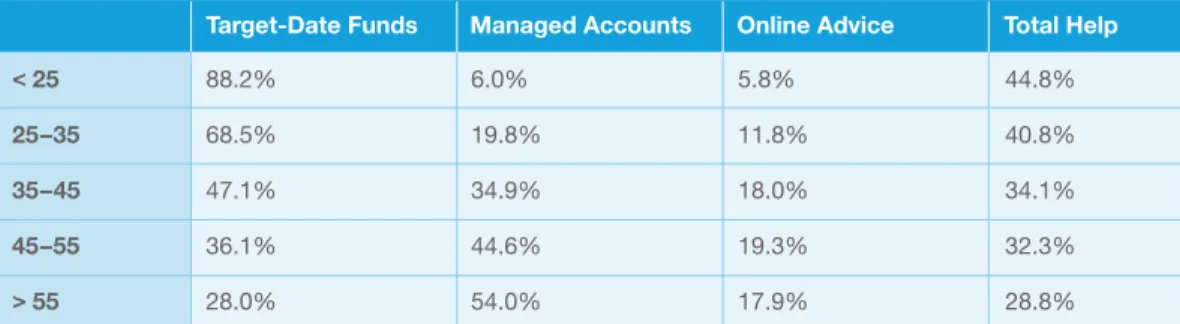
FIGURE 8: HELP BY AGE
Target-Date Funds Managed Accounts Online Advice Total Help
< 25 88.2% 6.0% 5.8% 44.8%
25–35 68.5% 19.8% 11.8% 40.8%
35–45 47.1% 34.9% 18.0% 34.1%
45–55 36.1% 44.6% 19.3% 32.3%
> 55 28.0% 54.0% 17.9% 28.8%
To determine how age affected Help usage, we divided participants into age categories and then looked at whether Help usage differed by age group.
Overall, total Help usage was highest among participants younger than 25. This is not surprising and was undoubtedly the result of automatic enrollment of new hires into target-date funds creating high target-date fund Help usage among the youngest groups of participants.
While target-date fund usage was very high among the youngest groups, its usage decreased among the older age ranges. In contrast, managed account usage grew as we progressed through the age ranges, and managed accounts became the dominant form of Help used by near-retirees.
Profiles: Type of Help Used
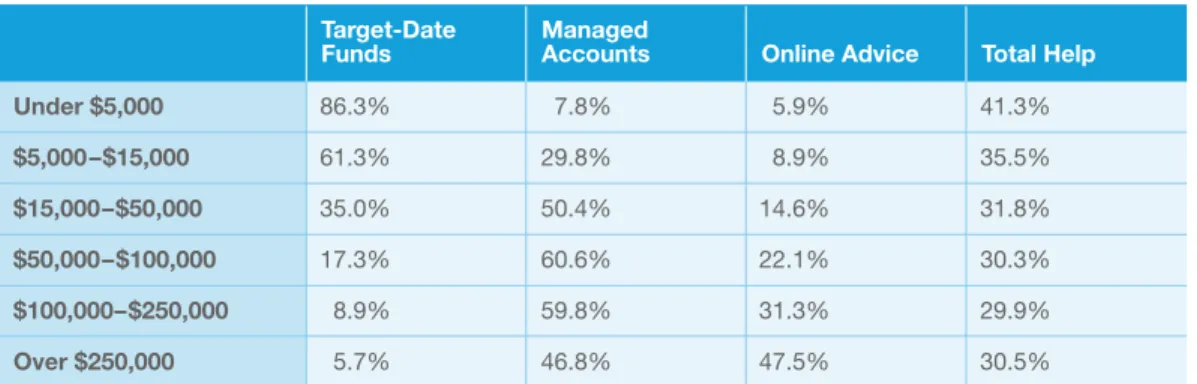
Varies by Account Balance
FIGURE 9: HELP BY ACCOUNT BALANCE
Target-Date Managed
p l e H l a t o T e c i v d A e n il n O s t n u o c c A s d n u F
Under $5,000 86.3% 7.8% 5.9% 41.3%
$5,000–$15,000 61.3% 29.8% 8.9% 35.5%
$15,000–$50,000 35.0% 50.4% 14.6% 31.8%
$50,000–$100,000 17.3% 60.6% 22.1% 30.3%
$100,000–$250,000 8.9% 59.8% 31.3% 29.9%
Over $250,000 5.7% 46.8% 47.5% 30.5%
Participants with 401(k) plan account balances under $5,000 used Help the most, followed by participants with account balances between $5,000 and $15,000. Usage by these groups was largely due to automatic enrollment into target-date funds. This finding reinforces the significance of inertia in plan design. While somewhat lower, Help usage remained fairly constant among participants with 401(k) plan account balances greater than $15,000.
In general, the lower the participant’s 401(k) account balance, the higher the likelihood of target-date fund usage. Again, defaulting new hires into target-date funds was likely a factor here. For account balances above $15,000, managed accounts were the most widely used form of Help, with the usage being highest for participants with 401(k) account balances between $50,000 and $250,000. Online advice usage was correlated with higher account balances. Online advice was the most widely used form of Help for participants with 401(k) plan account balances above $250,000 and was the second most popular form of Help for participants with 401(k) plan account balances between $50,000 and $250,000.
In the next section we explore in more detail likely Help usage segmented by age and balance.
Profiles: Predicting the Type
of Help Usage
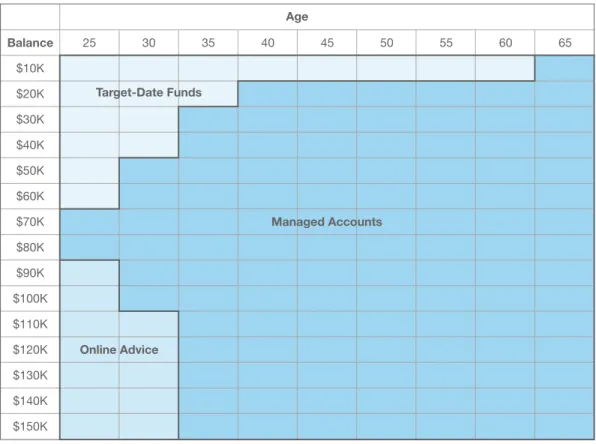
To better understand the drivers that caused participants to choose among the dif-ferent types of Help, we conducted a regression analysis similar to that in the previous editions of this report.35 The results were consistent with prior findings—age and
port-folio balances were the strongest predictors of the type of Help selected. To provide greater insight into how these two factors interact, we used the results of the regression analysis to predict the most likely type of Help selected by participants with various combinations of ages and balances. These predictions are shown in Figure 10 below. It is important to note that we are only showing the most likely Help type. The other types of Help will also be selected by some participants— just less often.36
Age
Balance 25 30 35 40 45 50 55 60 65
$150K $140K $130K $120K $110K $100K $90K $80K $70K $60K $50K $40K $30K $20K $10K
FIGURE 10: LIKELY HELP USAGE
Online Advice
Managed Accounts Target-Date Funds
35Please see Methodology Appendix for additional details.
36For example, for a participant aged 60 with a $10,000 balance, the predicted probabilities are 50.0% target-date funds,
The patterns in likely Help usage were consistent with our prior findings and indicate that life stage and portfolio size generally lead participants to choose and/or stay with a type of Help that is most suitable to their needs:
• Younger and/or lower-balance Help Participants are more likely to use target-date funds. These participants are likely to be new to the workforce and have much more homogeneous investing profiles. As such, the one-size-fits-all approach of target-date funds may be seen as a suitable, convenient investment.
• Help Participants who are younger but have higher balances are more likely to use online advice. These participants may be more engaged, have a stronger desire to be hands-on and be more comfortable using web-based advice services.
• As participants age and accumulate higher balances they are more likely to use managed accounts. Given the increasing complexity of participants’ financial situ-ations as they age, and their generally higher account balances, a more tailored and flexible solution along with access to an advisor may appeal to this population. The difference in Help preferences across participant ages and balances suggests that the retirement needs of a diverse workforce will be met only through a range of Help offerings. No one solution is likely to meet the needs of a diverse employee population. Usage of Help over a participant’s career is affected not only by decisions to start using Help (whether made by the participant or through defaulting), but also by decisions to stop or continue using Help. Once participants start using Help, do they stay with the Help strategy? The next section will examine this topic.
Retention: Do Help Participants
Stay with Help?
An important element of Help usage is not only how many participants are using Help at a particular point in time, but whether participants stay in Help over time. We call this dimension of Help usage “retention”, and with this report’s expanded set of data, we were able to analyze this dimension of Help usage for the first time.
To examine retention, we framed the relevant question thus: “For participants who started using Help in a given year, how likely were they to keep using that form of Help over the next several years?”
We defined five cohorts of Help users over time. The first cohort consisted of partici-pants who were new managed account Help users or target-date fund Help users in 2007. This required that they were not using their respective Help type (i.e., managed accounts or target-date funds) at the beginning of 2006 but were using it at the begin-ning of 2007. We then tracked those participants for the next five years (until 2012) to see how many of them continued to use their initial Help type.
The second cohort consisted of 2008 participants who were new to managed account or target-date fund Help at the beginning of 2008. We then followed these participants for four years (until 2012) to see how many of them continued to use their initial help type.
We continued in a similar manner for the remaining three cohorts which start in years 2009 through 2011. We then averaged the retention rates for these cohorts by holding period.37
100%
50% 70% 80% 90%
60%
FIGURE 11: MANAGED ACCOUNT AND TARGET-DATE FUND HELP RETENTION
5 4
3 2
1 0
Retention Rate
Holding Period (Years)
Managed Account Help Users Target-Date Fund Help Users
The results in Figure 11 show that Help Participants were much more likely to stay in a managed account than in a target-date fund. The managed account Help Participants’ five-year retention rate was 87.0% compared to 56.8% for target-date fund Help Par-ticipants.
Additionally, target-date fund Help retention rates were more volatile across various market environments, including the severe downturn of 2008. Participants had a maxi-mum attrition rate of 32.5% compared to a maximaxi-mum attrition rate of 6.7% for managed account Help Participants.38
In most of the years covered by this retention analysis, tracking of defaulted partici-pants was not available. We do know that 12 of the plans currently have target-date funds as their default investment option and one of the plans currently has managed accounts as its default investment option.39 Thus, it is highly likely that some of the
par-ticipants, especially target-date fund users, were defaulted. The impact of defaulting on retention warrants additional study.
Retention of online advice users was not tracked here due to data limitations, but this form of Help has its own challenges. As noted elsewhere in this report, 15.0% of par-ticipants had used online advice in the past, but only 5.4% of those parpar-ticipants had
38These are the maximum attrition rates across the two cohorts with data available for 2008. 39Please see Introduction: Data Sample Information, Usage and Profiles for additional information.
used it in the last 12 months (and thus qualified as online advice Help Participants). The remaining 9.6% of participants had used Help in the past but not within the last 12 months.
Regardless of the specific type of Help used, they can add value only if participants continue to use them. In future editions of this report we hope to examine this issue further to better understand the drivers of retention, and how to best ensure partici-pants continue to receive long-term Help.
In the next section, we take a closer look at a misuse of target-date funds—specifically misuse of target-date funds through partial investment—which may be contributing to the observed lower retention rates.
A Closer Look: Partial Target-Date
Funds Usage
In the previous sections, we noted that the majority of participants using target-date funds were not putting at least 95% of their assets in one or more target-date funds. For this report, we defined individuals who had some allocation, but less than 95% of their balance, in target-date funds as “partial target-date fund participants.”40 In contrast,
target-date fund Help Participants held at least 95% of their portfolios in one or two target-date funds.41 In this section we demonstrate the extent of partial target-date
fund usage, examine specific cases of partial usage and show the impact of partial tar-get-date fund allocations on participants’ portfolio risk levels and investment returns. Partial target-date fund participants represented 27.9% of the participants in the sample and 24.2% of the assets in the sample. Partial target-date fund usage is more prevalent than target-date fund Help usage, which accounted for 16.9% of the partici-pants and only 3.7% of the assets as shown in Figures 12 and 13 below.
Other Non-Help
37.6% Online
Advice 5.4% FIGURE 12: PARTIAL TARGET-DATE FUND USAGE BY PARTICIPANTS
Managed Accounts 12.1% Target-Date
Funds 16.9% Partial
Target-Date Funds
27.9%
40To be considered a partial target-date fund participant, a participant may not be using either online advice or
man-aged accounts.
41Target-date fund Help Participants are allowed to invest in up to two target-date funds to account for those situations
where the participant’s retirement year lies between two target-date fund target years. In such cases, participants may allocate their portfolio between two adjacent target-date funds.
Other Non-Help
45.5%
Online Advice 11.4%
FIGURE 13: PARTIAL TARGET-DATE FUND USAGE BY ASSETS
Managed Accounts 15.2%
Target-Date Funds
3.7% Partial
Target-Date Funds
24.2%
As a result, partial target-date fund participants represented 62.2% of all (Help and Non-Help) target-date fund users and 86.8% of all target-date fund users’ assets.42
Thus, partial usage was not only widespread, but it was also the typical way these funds were used. Given the wide prevalence of this usage behavior, it is helpful to analyze how partial target-date fund participants compared to Help Participants.
The classification criterion for partial target-date funds usage is admittedly wide — ranging from greater than 0% to less than 95%. To better understand this issue, we examined the breakdown of partial target-date funds usage.43 The results are shown in
Figure 14 below.
42These values are based on the 2013 data set used in the Usage and Profiles sections.
43Unless otherwise noted, the remainder of this section uses 2012 data. This data set contains additional information
that allows us to perform a more detailed analysis than possible using the 2013 data set. Please see the Methodology Appendix for additional details.
% of Portfolio Allocated to Target-Date Funds
% of Partial
Ta
rg
et-Date Fund Participants
3.0% 2.5% 2.0% 1.5% 1.0% 0.5% 0.0%
FIGURE 14: PARTIAL TARGET-DATE FUND USAGE, 201244
5% 10%15%20%25% 30%35%40%45%50%55%60%65%70%75%80%85%90%95%
There are several important findings in this chart. First, we see that the high partial target-date fund usage was not due to target-date fund Help Participants drifting slightly below the 95% threshold—in fact, only 3.2% of partial target-date fund partici-pants were in the 90% to 95% range. Overall, partial target-date fund participartici-pants held only an average of 35.0% of their portfolios in target-date funds.
44The first column, representing the >0% to 1% range, has been truncated at 3% for readability in all of the histograms.
FIGURE 15: PARTIAL TARGET-DATE FUND USAGE (> 0% AND < 50% USAGE), 2012
% of Portfolio Allocated to Target-Date Funds
% of Partial
Ta
rg
et-Date Fund Participants
3.0% 2.5% 2.0% 1.5% 1.0% 0.5% 0.0%
5% 10%15%20%25% 30%35%40%45%50%55%60%65%70%75%80%85%90%95%
Second, as highlighted in Figure 15, we found that the majority of partial target-date fund participants were actually allocating less than half of their portfolio to target-date funds. This represents 74.3% of partial target-date fund participants and 85.2% of partial target-date fund participants’ assets. Thus, the majority of partial target-date fund participants were using target-date funds in a manner very different from the funds’ intended design.
45One potential source of partial target-date fund allocations is a change in plan sponsors’ fund lineups. In such cases,
assets in existing funds that do not have a close matching in the new fund lineup are often placed in the default investment, which may be a target-date fund. While this may explain some partial target-date fund allocations, plan lineup changes are infrequent and do not explain the clustering at specific percentages.
FIGURE 16: PARTIAL TARGET-DATE FUND USAGE CLUSTERS, 2012
% of Portfolio Allocated to Target-Date Funds
% of Partial
Ta
rg
et-Date Fund Participants
3.0% 2.5% 2.0% 1.5% 1.0% 0.5% 0.0%
5% 10%15%20%25% 30%35%40%45%50%55%60%65%70%75%80%85%90%95%
Another key finding is a set of “clusters” of partial target-date fund usage around specific portfolio percentages. As shown in Figure 16, there were spikes in frequency around 10%, 15%, 20%, 25%, 30%, 35%, 40% and 50%. These clusters were observed across multiple years and suggest that participants were actively rebalancing to specific allocations (for example, regularly rebalancing to hold 25% of their portfolio in target-date funds). Additionally, the cluster around 50% was particularly pronounced, and may be a result of both active rebalancing by participants and plan design features such as a match in company stock.
In summary, there is evidence that partial target-date fund users may be actively re-balancing to maintain their improper allocations, rather than arriving at these improper allocations through inattention and portfolio drift.45
FIGURE 17: PARTIAL TARGET-DATE FUND USAGE (>– 50% AND < 95% USAGE), 2012
% of Portfolio Allocated to Target-Date Funds
% of Partial
Ta
rg
et-Date Fund Participants
3.0% 2.5% 2.0% 1.5% 1.0% 0.5% 0.0%
5% 10%15%20%25% 30%35%40%45%50%55%60%65%70%75%80%85%90%95%
Partial target-date fund participants who had a majority allocation to the target-date fund also made significant investing mistakes. Among partial users holding 50% to 95% of their portfolio in target-date funds (shown in Figure 17), 42.2% allocated over 90%
of the non-target-date fund portion of their portfolio to company stock.46 This usually
results in a partial target-date fund participant’s portfolio being significantly more risky than appropriate. Although company stock concentration varies by plan sponsor, this finding highlights that portfolios consisting of target-date funds and company stock can be an area of concern.
Partial Target-Date Fund Usage
Negatively Impacts Risk
Next, we analyzed the impact that partial target-date fund allocations had on participants’ risk levels. To provide a proxy for the correct risk level, we started with the equity allocation of the target-date fund portion of each partial target-date fund participant’s portfolio. We then evaluated the equity allocation of each user’s entire portfolio. If it was within +/- 5% (i.e., a 10% range) of the equity allocation of the target-date fund it was categorized as “appropriate.” If more than 5% above, it was categorized as too high, and, if more than 5%
below, it was categorized as too low. For example, if the user’s target-date fund had 75% in equities, then an overall equity allocation less than 70% was classified as “too low.” Similarly, an overall equity allocation above 80% was classified as “too high.”
70% 60% 50% 40% 30% 20% 10%
55–60 Age
% of Partial Target-Date Fund Participants
FIGURE 18: PARTIAL TARGET-DATE FUND PARTICIPANTS' RISK LEVELS
25–30 30–35 35–40 40–45 45–50 50–55 > 60
Risk Too High Risk Too Low
By this measure of appropriate risk, 32.3% of partial target-date fund participants had
too much risk in their portfolios and 29.5% had toolittle risk. Figure 18 (above) shows the results by age category, which reveals two disturbing trends:
• First, the overall percentage of partial target-date fund participants with inappropriate risk increased with age, meaning that near-retiree partial target-date fund participants were making more risk mistakes than younger partial target-date fund participants. • Second, the percentage of partial target-date fund users with too high risk also
increased with age—meaning that near-retiree partial target-date fund users were especially vulnerable to market downturns.
The majority of partial target-date fund users appear to be undermining the benefits provided by target-date funds by making inappropriate investment decisions with the remainder of their portfolios.
Partial Target-Date Fund Usage
Negatively Impacts Returns
We conclude the partial target-date fund analysis by looking at returns earned by par-tial target-date fund participants. These are shown in Figure 19, along with returns for Non-Help Participants and Help Participants, managed account Help Participants and target-date fund Help Participants.
14% 4% 7% 8% 9% 10% 11% 12% 13% 6% 5%
FIGURE 19: COMPARATIVE MEDIAN RETURNS, 2010–201247
> 60 55–60 50–55 45–50 40–45 35–40 30–35 25–30 Annual Retur n Age Managed Accounts Target-Date Funds Partial Target-Date Funds
Non-Help
Help
While there was a modest difference between the returns of managed account and target-date fund Help Participants—with managed account Help portfolios outper-forming target-date fund Help portfolios by 50 basis points (0.5%)—these two types of Help closely tracked overall Help Participant returns.48 In contrast, partial target-date
fund participants had significantly lower returns than Help Participants in all age ranges, exhibiting an average difference of 2.44% (244 basis points), net of fees.
47Please see the Methodology Appendix for additional details.
48The difference between managed account and target-date fund returns should not be interpreted as a significant
gap. In a data sample of 14 plans over three years, there are numerous factors that could have resulted in a different gap, perhaps even in the opposite direction: differences in equity allocations between glidepaths, personalizations in managed account portfolios, the timing of participant contributions relative to market returns and the performance of individual funds and company stock to name a few. These factors make it difficult to precisely distinguish between two forms of Help that have similar investment objectives, but they are not large enough to negate the large Help versus Non-Help returns gap.
In conclusion, we have seen that partial target-date funds usage is widespread, impact-ing more than one in four participants (27.9%). Almost three out of four (74.3%) partial target-date fund participants held less than half of their portfolios in target-date funds and over six in 10 partial target-date fund participants (61.8%) had inappropriate risk levels in their portfolios. Perhaps most disturbing, partial target-date fund participants’ portfolios had annual returns more than 2% lower (2.44%) than Help Participants’ port-folios.
While target-date funds are suitable investment options for many participants when properly used, they are susceptible to incorrect usage which may result in portfolios with inappropriate risk levels and much lower returns. These less desirable outcomes are connected to the lower retention of Help among target-date fund users: A significant fraction of newly-enrolled target-date fund Help Participants who start out with all of their account in a target-date fund are likely to drift into inappropriate portfolios within a few years and earn substantially lower investment returns as a result.
Conclusion and Implications
Our research reveals four major themes and next steps for plan sponsors, service providers and policy makers to bring the benefits of Help to more participants.
1. Help works for all age groups across a range of market conditions. While Help usage is growing, more needs to be done to increase usage.
Between 2006 and 2012, defined contribution participants using Help earned substantially higher returns than those not using Help. Help Participants of all age groups outperformed Non-Help Participants. On average, Help Participants had median annual returns, net of fees, that were 3.32% higher than Non-Help Partic-ipants—a sizable difference that could substantially impact wealth creation over the course of a career.
Help usage now stands at 34.4%, an increase of nearly five percentage points over the 30% figure reported in the prior edition of this report. Despite the gains, roughly two-thirds of participants were not using Help. Most non-users (60.5%) had inap-propriate risk levels, and two-thirds of these were taking too much risk.
Plan sponsors can help workers reap the benefits of Help in various ways. First, if all forms of Help are not offered in the plan, add them. Second, if the Help solutions are already present, consider leveraging automatic enrollment to increase Help utilization and expose the participants to the benefits from day one. Finally, plan sponsors should consider re-enrolling participants into Help to fully maximize the utilization.
This research highlights that reaching all participant groups requires offering multiple Help options. No one form of Help will meet the needs of all participants. In general, younger participants were most likely to use target-date funds and younger participants with high balances opted for online advice. Participants nearest retirement with more complex needs were more likely to use managed accounts. Plan sponsors that do not offer all three types of Help risk missing large segments of their participants.
2. Near-retirees are most in need of Help.
Forty percent of Non-Help Participants in this report were at least 50 years of age or older. In this report we again found that this group had the widest variability in risk levels, with some having risk levels above that of the S&P 500 Index. The failure to reduce risk makes the near-retiree population particularly vulnerable to market swings. Such volatility can cause significant losses shortly before retirement, resulting in reductions in the standard of living, early depletion of assets, or delayed retirement dates.
We encourage plan sponsors to consider re-enrolling near-retirees into a QDIA so they can receive the same advantage that many new employees receive as a result of automatic enrollment. Finally, plan sponsors are encouraged to provide older participants with guidance and help in managing other retirement investments and income, such as determining when to claim Social Security or assisting with a defined benefit plan lump-sum distribution.
3. Defaulting participants into target-date funds increases Help usage but leaves large gaps.
Target-date fund defaults drove the increase in Help usage seen in this report. Where the data was available, defaults accounted for 88.6% of target-date fund users. Defaults are designed to get participants started on the right track in an easy-to-use investing option. This research, however, shows many participants continue to see target-date funds as simply additional fund options in their plans and not as an all-in-one fund solution. As a result, most of those invested in target-date funds were not using them as intended.
Six in 10 partial target-date fund users (61.8%) had portfolios with inappropriate risk levels. As a result of this and other forms of poor diversification, the median annual returns for partial target-date fund portfolios were substantially lower than for the Help portfolios. Median annual returns from 2010 to 2012 were 2.44% lower, net of fees, for partial target-date fund participants than for Help Participants. Based on these findings, we recommend that plan sponsors and service providers increase participant education regarding the appropriate use of target-date funds and the impact of misusing them.
This report also suggests that plan rules and design may have contributed to par-tial target-date fund allocations. Sponsors that match in company stock need to consider how this may be impacting participant portfolio allocations. Concentrated holdings in a single security are not appropriate for the vast majority of investors, and this is particularly true when an individual’s salary and a large portion of their investment portfolio are both tied to the financial health of the company.
Finally, re-enrolling existing participants into a target-date fund might be an option for sponsors who have many participants with partial target-date fund allocations. However, the lower target-date fund retention seen in this report suggests the benefits of re-enrollment into target-date funds may have a limited shelf-life. Re-enrollment into a managed account may be a more effective long-term solution, as discretionary management can keep participants on track for the long run.
Target-date funds have many benefits and are suitable investments particularly for younger participants with lower balances. However lower retention among target-date fund Help Participants combined with substantially lower investment returns for partial target-date fund participants is worrisome. The ability of target-date fund investors to meet their retirement goals could be severely compromised if these problems are not solved.
4. Addressing retention issues can keep more participants in Help.
Historically, much of the attention on Help has been about increasing availability and participant usage. Little has been written on an equally important issue— retention. Our retention analysis found that managed accounts Help Participants were much more likely to stay with Help than target-date fund Help Participants. This suggests that managed accounts may be more effective in influencing the long-term behavior of participants over their working and savings careers. As participants age and grow their 401(k) accounts, they may need to consider
transitioning to a form of Help more suitable to their more complex financial circumstances. Plan sponsor and service provider communications should include messaging and reminders on why and when to consider a different type of Help. In future editions of this report we plan to dive deeper into the topic of retention
to better understand the behaviors of Help Participants—both those defaulted into Help and those choosing to use it on their own—to maximize their long-term returns.