ERIA-DP-2011-04
ERIA Discussion Paper Series
Why Does Population Aging Matter So Much for Asia? Population Aging, Economic Security and Economic Growth
in Asia Sang-Hyop LEE
East West Center and University of Hawaii at Manoa, USA Andrew MASON
East West Center and University of Hawaii at Manoa, USA Donghyun PARK
Economics and Research Department, Asian Development Bank, Philippines
August 2011
Abstract: Asia as a whole is experiencing a rapid demographic transition toward older
population structures. Within this broader region-wide trend, there is considerable heterogeneity, with different countries at different stages of the demographic transition. In this paper, we document Asia’s population aging, describe the region’s old-age support systems, and draw out the regional socioeconomic implications of population aging and old-age support systems. Population aging gives rise to two fundamental challenges for the region – (1) developing socioeconomic systems that can provide economic security to the growing number of elderly and (2) sustaining strong growth in the face of aging over the next few decades. Successfully addressing those two challenges will be vital for ensuring Asia’s continued economic success in the medium and long term.
Keywords: Aging, Demographic transition, Old age income support, Growth, Asia JEL Classification: J10, J14, H55
1
1.
Introduction
The speed and strength of developing Asia’s recovery from the global financial and economic crisis has surprised on the upside. The region was hardly immune from the effects of the crisis, and its export and growth performance plummeted during the 4th quarter of 2008 and 1st quarter of 2009 when the crisis climaxed. However, the sizable fiscal and monetary stimulus programs quickly unleashed by governments around the region initially helped to support aggregate demand and growth in the face of collapsing world trade and exports. The region’s resilient V-shaped recovery has gained depth and breadth as exports have recovered and private domestic demand has strengthened. What is all the more surprising about Asia’s turnaround is that it has taken place despite the continued fragility and uncertainty of the advanced economies. While it is far too early to tell whether Asia has de-coupled from the business cycle of the advanced economies, the region’s robust performance is making a substantial contribution to the global outlook.
While Asia has recovered remarkably well from the global crisis, the region now faces the difficult fundamental challenge of sustaining growth beyond the crisis into the medium and long term. For decades prior to the crisis, Asia has been the world’s fastest-growing region and this strong sustained performance has transformed the region from a group of typical developing countries into one of the three centers of gravity of the world economy, along with the US and EU. The burning question remains, will Asia be able to return to its high-growth trajectory once the global crisis recedes. Notwithstanding the region’s remarkable resilience during the crisis, its continued success in the post-crisis period is far from automatic. For one, the external environment is likely to be less benign in the post-crisis world. To a large extent, the weakness of the advanced economies reflects structural problems – e.g. market failures in the US housing and financial markets and fiscal concerns in some EU countries – which will take time to be sorted out. The medium term weakening of the advanced economies has negative repercussions for Asia’s medium growth since those economies have traditionally been and remain a key market for Asian exports.
2
In addition to a less benign external environment from weaker advanced-economy demand for its exports, Asia also faces a number of homegrown structural shifts which impinge upon the region’s long-run growth. Above all, the demographic dividend which has been a major contributor to its growth in the past is coming to an end. Demographic dividend refers to an acceleration of economic growth associated with a rise in the share of working-age population in total population. Other things equal, an economy’s output will be larger if a larger share of the population is working. The immediate catalyst of the demographic dividend is a decline in fertility rates which causes a corresponding decline in the youth dependency ratio, or the share of youth in total population. According to the life cycle theory of savings, individuals tend to save during their working years and draw down their savings after they retire. Therefore, Asia’s demographic dividend has also contributed to the region’s high savings and investment rates. The demographic dividend is not an automatic consequence of favorable demographic changes but depends on the ability of the economy to productively use the additional workers. East Asian countries’ success in taking full advantage of their potential demographic dividend by creating a conducive policy environment – e.g. flexible labor markets and promotion of labor-intensive manufacturing – played a major role in the East Asian Miracle.1
Unfortunately for Asia, the demographic dividend which lubricated the region’s rapid growth is now giving way to older populations in which economically inactive retirees account for a high and growing share of total population. As the large working age cohort which drove the demographic dividend grows older, population aging sets in. As in other parts of the world, Asia’s population aging reflects the combination of two factors – falling fertility and rising life expectancy. Higher livings standards and rapidly changing social conditions such as urbanization enable Asians to live longer and induce families to have fewer children. Other things equal, a fall in the share of the population that is working will lead to a lower output. To some extent, policies such as opening up to immigration, encouraging higher female participation in the workforce, and raising the retirement age can compensate for the prospective decline in the labor force, but population aging will nevertheless have an adverse impact on labor supply. Aging also
1 See, for example, Bloom
3
implies that each worker will have to support more and more retirees under public pension and health care systems. All in all, while demographic trends were conducive for economic growth in the past, they will be markedly less so in the future.
Within the broader region-wide trend of population aging, Asian countries are at very different stages of the demographic transition due to big differences in the timing and speed of fertility and mortality decline. For example, South Asian countries still have relatively young populations while East Asian countries have substantially older populations. Nonetheless, Asian countries are experiencing common important changes to their age structures. In all countries, the percentage of children in the population is declining or has already reached low levels. This is in large part due to a rapid decline in birth rates. The share of the working age population is increasing or has reached very high levels. Until recently, an increase in working age population has had a direct and favorable impact on growth in per capita income. However, this is a transitory phenomenon. The share of the working age population has already started to decline in some East Asian countries. Above all, the share of older population is increasing very rapidly in Asia. The increase has been particularly pronounced in high-income countries in large part because they have very low fertility rates. But lower-income countries in the region will also experience significant increase in the share of old population in the next few decades.
The primary objectives of this study are to document population aging in Asia, describe the region’s old age support systems, and draw out the regional socio-economic implication of population aging and old age support systems. Population aging will have important implications for the sustainability of publicly funded pension and healthcare systems, economic performance, labor supply, savings and capital formation, poverty, and intergenerational inequality. Such far-ranging implications have raised widespread concern in higher income Asian countries. In addition, lower income countries with relatively youthful populations will be confronting the same kinds of challenges now confronting higher income countries in the not-so-distant future. For Asian policymakers, population aging gives rise to two major strategic objectives, which these sometimes come into sharp conflict with each other. The first is to develop socioeconomic systems that will provide economic security to a growing number of elderly people. The second is to sustain strong economic growth in the face of aging
4
over the next few decades. Success in achieving these two objectives will require policies that promote savings, investment in human capital, well-functioning financial and labor markets, and macroeconomic stability. It will also require avoiding disproportionately large transfer programs for the elderly.
The rest of this study addresses these issues in more detail. We provide an overview of Asia’s demographic trends Section 2. In Section 3, we explore the economic implications of Asia’s demographic changes. We analyze Asia’s old age support system and their implications for economic growth in Section 4. Section 5 brings the paper to a close with some concluding observations.
2.
Population Aging in Asia – Key Stylized Facts
One notable feature of Asia’s population aging is its exceptional speed. While the basic picture is the same worldwide, Asia is aging more rapidly than elsewhere primarily because birth rates have declined more rapidly in Asia than elsewhere. In particular, fertility rates have reached extremely low levels in East Asian countries. Such low level of fertility rate can be found only in some Southern and Eastern European countries. Furthermore, fertility has recovered somewhat in Europe but not so in East Asia. Growth in the number of children has not only slowed substantially but has turned negative in many Asian countries. Such fertility decline has led to populations with many people still of working age but fewer and fewer children to succeed them. In the future when these smaller cohorts of children are entering the work force, larger cohorts of workers will be reaching retirement age. Population is aging very rapidly in Asia because of rapid improvements in life expectancy as well. Life expectancy in Japan is among the highest in the world, and other Asian countries have experienced significant improvements in recent decades. The end result will be populations with very few children, not many workers, and many older people.
Population age structure varies in a predictable way. Table 1 shows the percentage of people 65 and older for 16 Asian countries, based on UN’s most recent population projections. The proportion of 65 and older in total population in Japan is 17.2% in
5
2000, which is among the highest in the world. Except for Japan, none of the Asian countries has older population than the US in 2000. By 2025, however, East Asian countries will experience rapid aging. With the proportion 65 and older at 29.7%, Japan will remain the oldest country in the world. Other East Asian countries are also experiencing rapid aging. The percentage 65 and older will increase from 6.8% to 13.4% between 2000 and 2025 in the PRC, and from 8.1% to 17.2% in Taipei. Even more rapid aging will occur in the Republic of Korea and Singapore, where 19.3% and 22.9%, respectively, of their populations are projected to be 65 and older by 2025. The proportion 65 and older will increase very rapidly in Thailand, too, increasing from 12.9% to 20.2%. Elsewhere in Asia, the share of the population 65 and older will not reach 10% until after 2025. By 2050, however, almost all countries in the region, except Lao, PDR, will reach this level. At that time, about one-third of the populations of Hong Kong, Singapore, and South Korea will be 65 or older while Japan will have an even older population.
Table 1. Percentage of Population Age 65 and Older, 1950-2050, Asia and the US
1950 1975 2000 2025 2050
Brunei Darussalam 4.1 3.1 3.0 7.4 15.2
Cambodia 2.7 2.8 2.9 5.3 10.4
China, PRC 4.5 4.4 6.8 13.4 23.3
China, Hong Kong 2.6 5.4 11.0 22.1 32.6
India 3.1 3.4 4.3 7.3 13.7
Indonesia 4.0 3.3 4.9 9.0 18.6
Japan 4.9 7.9 17.2 29.7 37.8
Lao PDR 2.1 3.1 3.6 4.7 9.5
Malaysia 5.1 3.7 3.9 8.7 16.3
Myanmar 3.4 4.3 5.4 8.6 17.5
Philippines 3.6 3.1 3.5 6.6 12.7
Republic of Korea 2.9 3.5 7.3 19.3 34.2
Singapore 2.3 4.1 7.2 22.9 32.6
Taipei, China 2.4 3.4 8.1 17.2 25.9
Thailand 3.2 3.6 6.3 12.9 20.2
Viet Nam 4.2 4.9 5.6 9.8 20.0
USA 8.3 10.5 12.4 18.1 21.6
Sources: United Nations (2009) and projections by the Department of Manpower Planning, Taipei.
In fact, Asia’s population aging is a natural and final outcome of the demographic transition that has led to low birth and death rates, slower population growth, and
6
population decline in a growing number of countries. To many, these are welcome developments but worrisome because of their sheer speed, which is unprecedented in human history. Figure 1 illustrates how rapidly Asia is aging. By 2000, the share of population ages 65 and older had exceeded 15 % only in Japan. But by 2050 a majority of countries in the region will surpass this level, including a number of low income countries, such as Indonesia, Myanmar, and Vietnam. India’s old-age share is also expected to rise close to 14 % by 2050. That is, the proportions of the old-age population will more than triple between 2000 and 2050 throughout the region. In only two countries, Japan and Lao, DPR, the proportion will less than double during the period. Indeed the elderly proportion will more than double in Singapore, Malaysia, Brunei, and Korea, with the proportion quadrupling in the case of Singapore. This is in stark contrast with the United States which is experiencing relatively slow pace of aging due to a relatively high birth rate, somewhat lower life expectancy, and a high rate of immigration.
Figure 1. Population Shares of People Ages 65 and Older in Asia and the US in 2000 and 2050
Sources: Calculated from United Nations (2009) and projections by the Department of Manpower Planning, Taipei.
0 5 10 15 20 25 30 35 40 45
0 5 10 15 20
2000 (%)
2
050 (
%
)
India
Hong Kong S. Korea
Singapore
Taipei China
Thailand
300% 400%
200%
Philippines
Japan
US
Laos Brunei
7
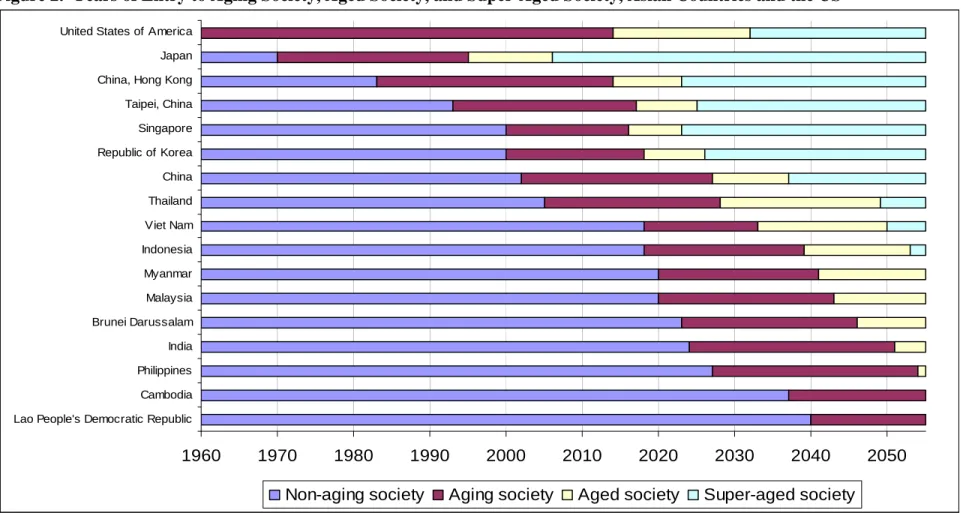
At first glance, demographic profiles of 2050 may appear too remote to matter for today’s economic concerns. However, the elderly population of 2050 is the working population of today. The prospect of old age and retirement will influence current behavior — for example, saving behavior. In this context, one major concern in Asia is that some low income countries may grow old before they grow rich. The concern is not wealth per se, but that the financial and political institutions important in aging societies may be relatively underdeveloped. This is not what the high income countries have experienced. A society is often defined to be an aging, aged, and super-aged society when the proportion of population 65 and older exceeds certain levels, such as 7%, 14%, 20%. Figure 2 shows the year at which countries enter this stage. In Asia, Japan became the first aging society in 1970, which is much later than other high income countries. For example, the US became an aging society way back in 1942. As of 2010, several Asian countries, including China, Hong Kong, Taipei, Singapore, Korea, and Thailand, belong to the category of aging society. In the next 10 years, countries like Viet Nam, Indonesia, Myanmar, and Malaysia will join the same group. India is expected to become an aging society in 2024. It is not certain if these countries will be sufficiently developed and thus have adequate institutions to prepare for an aging society by that time.
8
Figure 2. Years of Entry to Aging Society, Aged Society, and Super-Aged Society, Asian Countries and the US
Sources: Calculated from UN (2009) and projections by the Department of Manpower Planning, Taipei.
Note: Aging society, aged society, and super-aged society refers a country at which the proportion of elderly 65 and older exceeds 7%, 14%, and 20%,
respectively. The sources have information up to 2050. The numbers between 2050 - 2055 are projections by authors.
1960 1970 1980 1990 2000 2010 2020 2030 2040 2050
Lao People's Democratic Republic Cambodia Philippines India Brunei Darussalam Malaysia Myanmar Indonesia Viet Nam Thailand China Republic of Korea Singapore Taipei, China China, Hong Kong Japan United States of America
9
Japan became an aged society in 1995, which is defined as a country with the population share of 65 and older at 14%. The speed and level of aging in Japan is remarkable. It took Japan 25 years to transform itself from an aging society to an aged society, compared with 72 years for the US. However, some Asian countries will become an aged society at even faster speed than Japan. If the projections are correct, the transition from aging to aged society will take 27 years in the Philippines and India. Most other Asian countries, such as Indonesia, Malaysia, Brunei, Myanmar, Thailand, China, and Taipei will complete this transition in 20 to 25 years. Three countries - Korea, Singapore and Vietnam - will need less than 20 years to move from an aging society to an aged society.
Japan became a super-aged society in 2006. Two European countries, Italy and Germany, became super-aged societies in 2010. Korea, Singapore, Taipei and Hong Kong will join the group by the mid-2020s. While it took Japan 11 years to become a super-aged society, it will take these economies less than 10 years. Korea, which is aging most rapidly in the world due to its extremely low fertility, will need only 7 years to move from an aged society to a super-aged society. By 2050, China (2037), Thailand (2049), and Vietnam (2050) are expected to become super-aged societies. The population aging process will have progressed the furthest in Japan and Korea around 2050. If the aging process continues, the share of elderly in Japan and South Korea will reach 40% of their populations shortly after 2050, and they will become utmost-aged societies.
3.
Economic Lifecycle and the Economic Consequences of Aging
Why does population aging matter? Population aging matters due to a fundamental feature of human society, the economic life cycle. In all modern societies, there are extended periods of dependency at the beginning of life and at the end of life. Children and the elderly consume more resources than they produce through their own labor. The challenge of population aging comes into sharper focus because the elderly consume more than they produce, relying on reallocations from the working ages when
10
we consider the aggregate lifecycles. Extrapolating this simple idea about the resource needs for older population suggests a general deterioration of economic conditions. As the demographic transition continues and the population becomes increasingly concentrated at older ages where consumption exceeds production, average consumption must decline relative to labor income, holding other things equal. This phenomenon is already happening in Japan and is about to occur in other East Asian countries. And it not far off in countries like India and the Philippines.
Our understanding and ability to measure the economic lifecycle and resource reallocations across ages have been vastly improved due to the recent development of National Transfer Accounts (NTA). The purpose of NTA is to measure, at the aggregate level, how people at each age in the lifecycle acquire and use economic resources.2 NTA represents a significant advance because it provides a comprehensive set of measures of production, consumption, saving, and transfers by age at the aggregate level in a manner consistent with National Income and Product Accounts.3 The accounts also consider public and private sectors, both of which mediate economic flows across age. Thus, these new data can be used to study the implications of population aging at both public and private levels.
Using NTA data, the economic lifecycle is represented by labor income and consumption by age for the Philippines and Japan in Figure 3. At the individual level, the per capita economic lifecycle varies by age because of individual characteristics and behavior, institutions, and market forces. Productivity increases as children mature and benefit from human capital investment. Subsequently productivity declines as health deteriorates and disability increases. Labor force participation, hours worked, and unemployment all vary with age, thus influencing the labor income profile. Consumption is influenced by preferences, prices, interest rates, income, and public institutions. Both profiles depend on many other historical, cultural, political, social,
2 NTA has been developed as an international project led by Ronald Lee of the University of
California at Berkeley and Andrew Mason of the East-West Center (Lee, 1994; Mason et al., 2009).
3 NTA are estimated relying on a variety of data sources. In addition to National Income and
Product Accounts, Government Financial Statistics (GFS) and government administrative records are used to estimate economy-wide aggregates. Age profiles are estimated by making extensive use of administrative records and nationally representative income and expenditure surveys, labor force surveys, health expenditure surveys, and special purpose household surveys. Data sources for each country’s NTA are available upon request.
11 and economic factors.
Figure 3. Comparison of Labor Income and Consumption by Age in the Philippines (1999) and Japan (2004), at the Individual Level (per Capita) and for National Populations as a Whole (Aggregate).
Source: National Transfer Accounts database, available at www.ntaccounts.org.
Notes: Labor income is a broad measure consisting of earnings and benefits received by employees and the estimated value of the labor of the self-employed, including unpaid family workers. Consumption is also a broad measure that includes the value of all goods and services consumed by individuals and by governments on their behalf.
There are interesting and important differences between Japan, the Philippines, and 0 10,000 20,000 30,000 40,000 50,000 60,000
0 10 20 30 40 50 60 70 80 90+
1000 P
eso
Age
Labor Income
Consumption Philippines, per capita
0 1000 2000 3000 4000 5000 6000
0 10 20 30 40 50 60 70 80 90+
1000 Yen
Age Labor Income
Consumption Japan, per capita
0 0.5 1 1.5 2 2.5 3 3.5 4
0 10 20 30 40 50 60 70 80 90+
P ercen t of total l a b o r i n com e Age Consumption Labor Income Philippines, aggregate 0 0.5 1 1.5 2 2.5 3 3.5 4
0 10 20 30 40 50 60 70 80 90+
P ercen t of total l a b o r i n com e Age Consumption Labor Income Japan, aggregate
12
other countries in the region, but there are also very important commonalities. One of the most striking findings is that, at the individual level, the shapes of the labor income and consumption profiles are quite similar across all countries. Compared with prime working age adults, children and teens have very low labor income even in the poorest countries. Labor income declines quite rapidly in the fifties everywhere. Those who are 60 and older have much lower labor income than prime age adults. The shapes of the consumption profiles are similar as well. Young children have lower consumption than prime age adults. In almost all cases, consumption by the elderly is similar to or higher than consumption by prime age adults. Another commonality is that the deficit portions of the lifecycle, the ages at which consumption exceeds labor income, are quite long. In the average profiles shown, young people do not begin to produce as much as they consume until their mid-20s. By the late 50s, people are again in a deficit position. There are also important differences in consumption and labor income profiles across countries and over time that are of considerable interest. For example, the level of the consumption profile varies relative to the labor income profile. In China, for example, the consumption profile is very low relative to labor income while in the Philippines it tends to be very high. In terms of the composition of consumption, older countries appear to have a higher share of health care consumption for elderly (Figure 4). In China, Taipei, and Korea, labor income drops quite rapidly for individuals in their 40s and 50s. The fall in labor income for the middle-aged is a striking finding in these countries because these age groups need more labor income to educate their children and support their parents. In Taipei, time series estimates are also available, and these show a sharp upward shifting of the consumption profile relative to the labor income profile.
13
Figure 4. Population Aging and Per Capita Health Consumption for 65+
Source: National Transfer Accounts database, available at www.ntaccounts.org.
At the aggregate level the economic lifecycle in large part reflects the population age structure. The Philippines has a very young population and a very large deficit at young ages (Figure 3). In Japan, which has an older population, the lifecycle deficit is much larger compared with the child deficit. But population aging is in its early stages, and the old-age deficits will grow substantially unless consumption and labor income patterns change radically. Essentially, we are trading a youth deficit for a large old-age deficit of similar size over the course of the demographic transition.
However, there are several important opportunities for changing course. Between the two points of high dependency, Asia has experienced an age structure very favorable for economic growth. For at least three decades, the population has shifted from the young ages into the working ages, thereby producing what has been called the “first demographic dividend”. The shift in age structure leads to a smaller child deficit and a larger surplus in the working ages. This has had the general effect, particularly in East Asia, of contributing to rapid economic growth (see Bloom et al. (2002), Kelley and Schmidt (1995), Kelley and Schmidt (2001), and Mason (2001)).
There are four possible ways to use the surplus generated from the demographic dividend. The first is that some countries could reduce their reliance on foreign transfers. Thus, more nationals could choose to remain at home instead of working
y = 1.4917x + 4.1499 R² = 0.6037
0.0 5.0 10.0 15.0 20.0 25.0 30.0 35.0
0.00 5.00 10.00 15.00 20.00 25.00
Per capi
ta
heal
th 65+(%
of
consumption)
14
abroad and remitting part of their earnings to their families back home. The second possibility is that those in the working ages could opt for more leisure by reducing their work effort or retiring at an earlier age. The third possibility is that consumption could increase. Although all of these responses would enhance current welfare, none can raise productivity or contribute to a higher standard of living on a sustained basis.
The fourth response is to increase saving and investment. This response is distinctive in that it allows the first demographic dividend to be used to convert temporarily favorable conditions into sustainably higher standards of living or a second demographic dividend (Mason and Lee (2007)). The key question is whether there are approaches that can raise productivity while at the same time providing economic security to the elderly. There are two important and compatible ways that this can be accomplished. To fully understand these options, however, it is important to understand how the economic needs of the elderly are being met in the region’s countries, an issue explained in the next section.
4.
Population Aging and Old-Age Income Support System
Economic lifecycles are sustainable only because a complex system of institutions and economic mechanisms enable economic resources to flow from surplus ages to deficit ages. Essentially, there are two economic mechanisms used for age reallocations - transfers and asset-based reallocations. A defining feature of transfers is that they involve no explicit quid pro quo. Resources flow from one party to another either voluntarily, as in the case of most private transfers, or involuntarily, as in the case of public transfers. Of course, transfers may involve implicit contracts enforced by social convention. Asset-based reallocations rely on inter-temporal exchange. An asset acquired in one period can be used to support consumption in subsequent periods, either from asset income or by disposing of the asset. When individuals accumulate pension funds or personal savings during their working years and rely on asset income and/or dis-saving of those assets during their retirement, they are relying on asset-based reallocations. Or, when individuals borrow to finance their education or to buy a car or
15
a home, they are relying on asset-based reallocations to consume more than their current labor income. However, this means that they must forego consumption in later periods when they must repay those loans.
Both the public and private sectors mediate economic flows across age groups. The public sector reallocates resources relying on social mandates embodied in law and regulations and implemented by governments. Education, public pensions, and health care programs are important examples of public reallocation programs. Private sector reallocations are sometimes governed by law, but also by voluntary contracts, social conventions, and deeply ingrained behavioral patterns that are mediated by markets, households, families, charitable organizations, and other private institutions.
The important contribution of the NTA data set is to improve our understanding and our ability to measure how economic resources are reallocated to the deficit ages. In particular, NTA provides a comprehensive treatment of such reallocations because it includes both the private and public sectors. Private familial transfers are especially important for supporting elderly in Asia. In Japan and Korea, the extent of the extended family has declined very rapidly in the last few decades, but roughly half of the elderly still live with their children. In other Asian countries the great majority of elderly live with their children, and there is a surprising degree of stability in these arrangements.
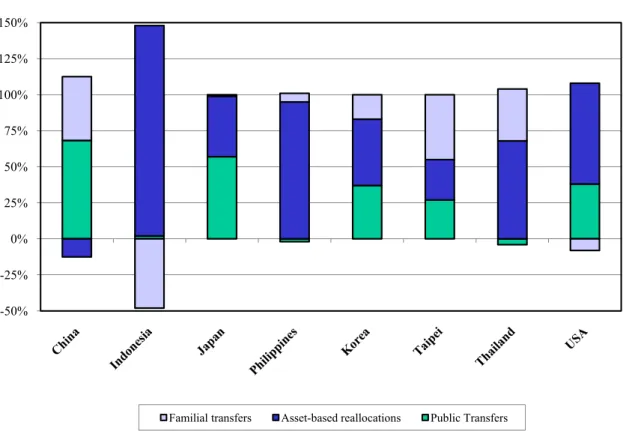
Figure 5 shows the relative importance of the three basic sources of old-age income support – assets, private transfers and public transfers – in Asian countries for which estimates are available and the US. Familial transfers fund about one-third of the lifecycle deficit for elderly in Taipei and Thailand, 44% in China, and 17% in Korea. In the Philippines and Japan, the elderly provide as much support to their families as they receive. But at older ages, net transfers to the elderly are important except for Japan. Familial transfers for old age are much more significant in Asia than in Latin American countries, where net familial transfers are quite small or negative. Japan is unique among Asian countries in that net family transfers to the elderly are essentially zero. According to recent data, the elderly in Japan receive more from their offspring than they give only after age 78. It is not clear, however, whether Japan is different from the rest of Asia or merely further along a path that others will follow. The time series figures for Japan show a steady decline in the importance of familial support for the elderly over the past two decades. Time series estimates for Taipei and Korea also
16
indicate a strong and steady decline in the importance of family transfers, and preliminary estimates based on more recent data suggest that they are now essentially zero in Korea as well.
Figure 5. Support Systems for Persons 65 and Older, Measured as Percentage of the Total Old-age Lifecycle Deficit, Eight Countries for the Most Recent Year (1997 to 2005) Available
Source: National Transfer Accounts database, available at www.ntaccounts.org
Note: Negative values represent net outflows, i.e., the elderly provide more support to their families than they receive. If values in one support system are negative, values in another support system can be greater than 100 %. The estimates for China are preliminary.
The data provide more information about familial transfers when we examine them in greater detail, for example, by the age of the elderly. The data show that familial transfers fill the gap between other support systems and lifecycle deficit for the very old in Asia, suggesting that familial transfers were critical in maintaining an adequate standard of living for the old in the region (Mason, Lee, and Lee (2010b)). The role of asset-based old-age income support is important for most Asian countries, except China. In Indonesia and the Philippines, the elderly rely almost entirely on assets. Thailand, Japan, and Korea are also closer to the US, relying more on assets and less on public
-50% -25% 0% 25% 50% 75% 100% 125% 150%
17
transfers, than Europe. China is an exception. In China, asset-based reallocations are negative for the elderly, because the elderly still save more than they earn through assets. This is consistent with China’s exceptionally low level of consumption across all age groups.
The role of the public sector is small in Asia, especially in comparison with European and Latin American countries. In Thailand and the Philippines, the elderly are paying as much in taxes as they are receiving in benefits — net public transfers are zero. In China, Korea, and Taipei, net public transfers are funding just about or under one-third of the lifecycle deficits of the elderly. Social programs for the elderly are also relatively small in comparison with Latin American and European countries. In Asia, the issue of fiscal sustainability matters less because there are few large public transfer programs. Among the Asian NTA countries public transfers account for a large share of old-age income support in only Japan and China. However, the finding for China should be interpreted with a great deal of caution because consumption is very low in China relative to labor income, and hence the life-cycle deficit is quite small.
Nevertheless, more recently, the role of public sector is growing quite rapidly in the region. At the societal level, many governments have been increasingly concerned about the adverse effects of rapid population aging on public expenditure. Figure 6 documents the case of Korea, which shows a sharp rise in social welfare benefits for the elderly during a very short time span (An et al. (forthcoming)). More specifically, there is a sharp increase in benefits for those over age 55, owing to increases in public pension and medical insurance benefits. The sharp rise in public pension benefits for those aged 60–64 reflects a rise in the number of newly entitled national pension benefit recipients. Higher benefits for those aged 65 and older were due mainly to an increase in benefits paid out by occupational pensions. Recent changes in medical insurance policies also substantially raised the medical insurance benefits for the older age groups.
18
Figure 6. Age Profiles of Per Capita Social Welfare Benefits: Republic of Korea, 2000 and 2004 (Thousand Won, 2000 Constant Prices)
2004 (thousand won, 2000 constant prices)
Source: Chong-Bum An et al. “Intergenerational Resource Allocation in the Republic of Korea” in
Ronald Lee and Andrew Mason (eds.). forthcoming. Population Aging and the
Generational Economy.
Low income countries are also experiencing a rapid increase in per capita public transfers to the elderly. That is, countries have been increasing public transfers to their old population before they are getting rich. For example, recognizing the importance of a guaranteed support system for the aging population, in 2006 the government of Indonesia issued Law No. 40/2004, expanding the social security system to include a national pension system for workers in both the formal and informal sectors (Maliki (forthcoming)). China is another example. In 2009 China committed itself to building a universal public pension system in rural areas, funded by individual premiums and government subsidies. Earlier, China had made public health insurance available to urban employees in 1998, to rural citizens in 2003, and to urban citizens in 2007 (See Li, Chen, and Jiang (forthcoming)).
Miller and Bravo (forthcoming) calculates a fiscal support ratio, defined as the ratio of aggregate taxes to aggregate benefits, to assess the pressures to fiscal sustainability arising from public transfers. Table 2 shows the evolution of the fiscal support ratio for some Asian countries and the US. This is calculated using the age profiles of public transfers in the NTA data sets. In the absence of asset-based fiscal reallocations such as government borrowing and debt repayment, this ratio would be 1 with aggregate taxes
0 500 1,000 1,500 2,000 2,500 3,000
0 10 20 30 40 50 60 70 80 90
Age
1,
0
00 w
o
n
2004
19
equal to aggregate benefit payments. As the population ages, the fiscal support ratio would decline as the number of taxpayers declines relative to the number of public transfer beneficiaries. The change in the fiscal support ratio indicates the relative size of tax hike or benefit cut needed to return to the initial fiscal position.
Table 2. Fiscal Support Ratios: 1950-2050
1950 2010 2020 2030 2050
Japan 1.02 1.00 0.89 0.81 0.69
Korea 0.77 1.00 0.95 0.87 0.76
US 1.04 1.00 0.96 0.90 0.85
China 0.89 1.00 0.98 0.94 0.89
Thailand 0.66 1.00 1.03 1.04 1.03
Indonesia 0.75 1.00 1.06 1.10 1.05
Philippines 0.87 1.00 1.06 1.10 1.15 Source: Tim Miller and Jorge Bravo, “The rise of the intergenerational state: aging and development”
in Ronald Lee and Andrew Mason (eds.). forthcoming. Population Aging and the
Generational Economy (UK: Edward Elgar). Original source is SNA, various years.
The estimates are based on the age profiles of public transfer inflows and outflows observed in each country around 2005 with estimates and projections of the population by age from 1950 through 2050. It is not surprising that the fiscal impact of population aging is projected to be bigger in Japan than in other Asian countries. Population aging combined with the current tax and benefit policies would lead to a 31% decline in the fiscal support ratio by 2050 in Japan. Thus, either taxes would need to increase, transfer benefits cut, or some combination of the two. Korea and China as well as the US show moderate fiscal impacts – ranging from a 24% reduction in the fiscal support ratio by 2050 to an 11% reduction. In several countries, the rapid deterioration of the fiscal support ratio projected in the future represents a distinct break from the past decades in which the ratio was stable or improving. A final group of countries – Indonesia, Philippines and Thailand – are projected to experience an increase in their fiscal support ratios – a reflection of the fact that under current tax and spending programs, the elderly are net taxpayers or only have very moderate net fiscal costs.
20
Underlying these calculations are the assumptions that the age profiles of benefits and taxes remain fixed over time, with their absolute levels increasing at the same rate as economic growth. This allows us to derive the required fiscal adjustment in benefits or taxes directly from the changes in the fiscal support ratio. More realistically, we expect the age profile of public benefits to shift up over time for most Asian countries, as evident in Korea’s case. It is possible that the age profile of benefits may shift down as well. Recent reforms of public pensions programs towards funded programs, such as those undertaken in Chile and other Latin American countries, can lead to a significant shift in the burden of population aging away from public transfers towards private transfers and asset-based reallocations. The extent to which the elderly rely on assets accumulated earlier in their lives varies widely. The elderly derive considerable support from asset accumulation in the Philippines and Thailand. The US, Japan, and Korea also rely heavily on asset-based reallocation. This pattern is in stark contrast with Europe and many other Latin American countries where the elderly hardly rely on assets at all.
There are important changes in the support system in Asia. The elderly are relying less on support from their families than they did in the past. The question is, what should compensate for the decline in this traditional source of old-age income support? By developing extensive social welfare systems as in Europe and parts of Latin America? Or by relying more on the accumulation of personal assets, as in the Philippines, Thailand, and the United States? Whatever strategy is chosen, it must simultaneously meet both of the key strategic challenges posed by population aging - supporting the elderly and sustaining economic growth, an issue discussed in greater detail in the next section.
5.
Options for Sustaining Growth in the Face of Population Aging
One strategy for responding to population aging emphasizes capital accumulation. Many of the fundamental insights were established by Modigliani and Brumberg (1954) and Tobin (1967), who explored the implications of the economic lifecycle for saving
21
and investment. The economic lifecycle has implications for saving and investment because the old age deficit is funded in part by asset-based income. Population aging will lead to an increase in the demand for assets for three reasons. First, to the extent that increases in life expectancy lead to a longer duration of retirement, the incentives to accumulate more during the working years will increase. Second, because fertility is lower fewer resources may be devoted to childrearing and more to saving for retirement. The third reason is simply due to age composition. Older individuals are wealthier because they have had longer to accumulate wealth. Hence, a population composed of more old people will have greater wealth per capita.
The strength of the relationship between age structure and capital depends, however, on the nature of the old-age income support system. This idea has been explored in many industrialized countries and to a more limited extent in developing countries. The primary focus of such explorations has been the possibility that public transfers will crowd out saving (see Feldstein (1974, 1998), Gale (1998) and Munnell (1974)). These and other similar studies inform efforts to evaluate existing transfer systems, to guide the development of new systems, and to anticipate the implications of alternative reform proposals. Social security reform, in particular, has been the subject of an enormous amount of research (Feldstein and Samwick (2001), Feldstein (1998) and Krueger and Kubler (2002)).
Whether countries rely on transfers or assets to fund the needs of a growing elderly population will depend on policies, culture, and institutions. Compared with European and Latin American countries, Asia has relied less on public pay-as-you-go pension programs. But health care for the elderly is a large and increasing cost that is often heavily subsidized by the public sector. Moreover, familial transfers to the elderly may be very important in Asia. Thus, aging in Asia may lead to large implicit debts that are shared by taxpayers and the adult children of the elderly. If the needs of a growing elderly population are met through greater reliance on lifecycle saving, population aging will lead to an increase in assets, with favorable implications for economic growth. Previous studies and the analysis presented below show that, through this mechanism, changes in age structure can lead to a “second demographic dividend” (Mason and Lee (2007)) - higher standards of living that persist long after the favorable effect of the first dividend has ended.
22
The evidence suggests that East Asian countries have actively pursued the high saving, high investment paradigm. Singapore is an interesting example because it has institutionalized this approach to aging through its Central Provident Fund (CPF). Singaporeans are required to save a high fraction of their earnings through mandatory contributions to the CPF. The fund provides pension benefits and has led to high rates of saving, investment, and economic growth. This is quite different from the pension systems in Japan, the United States, Europe, and Latin America which provide for retirees out of current taxes and therefore have no positive growth effects.
The experience of other East Asian countries indicates that mandatory savings may not be required. In many East Asian countries very high rates of saving have accompanied the age transition even in the absence of CPF-like mandatory savings schemes. This is certainly true of China today. East Asian countries share two important features - rapid population aging and low reliance on public transfer systems. The incentives to save more, generated by population aging, are not undermined by large public transfers to the elderly (see Feldstein (1974), Gale (1998), Lee et al. (2003), and Lee and Mason 2010)).
Another possible response to population aging is to scale up investment in human capital. Children rely almost exclusively on transfers to fund their lifecycle deficit but countries vary in the extent to which those resources are provided through the public sector rather than the private sector. They also vary a great deal in the extent to which transfers are devoted to human capital investment – i.e. education and health care. Asia’s population aging is primarily a consequence of low fertility. Societies will have relatively few workers because society fails to replace those workers due to low fertility. The total productivity of the working age population is not determined exclusively by the number of workers. Total labor income can be raised by increasing the quality of the labor force through investment in human capital or by increasing the amount of complementary productive factors such as physical capital. One possibility, then, is that low fertility is accompanied by an increase in per child transfers devoted to human capital (Becker and Barro (1988)). Eventually this would lead to fewer but higher quality workers. Thus, in addition to physical investment, another source of the second demographic dividend is investment in human capital.
23
education on human capital is strong enough to offset the adverse effects of population aging, but this conclusion depends on the effectiveness of the human capital investment. Figure 7 compares human capital spending per child and the total fertility rate for Asian countries for which estimates are available (Mason, Lee and Lee (2010a)). Total fertility rate is the average number of births per woman over the reproductive span given current age-specific birth rates. Human capital spending is measured in a similar way, as the average expenditure on health and education during childhood given current age-specific spending. To facilitate comparison across countries at very different levels of development, human spending is expressed as a fraction of the average labor income of a prime working-age adult aged 30 to 49. Therefore, the highest level of human capital investment in the figure - 6.2 for Taipei - means that human capital spending during childhood is equal to about six years’ worth of the pre-tax labor income of a prime working-age adult. Note that this value includes both public and private spending on education.
Figure 7. Human Capital Spending Per Child, Measured in Terms of Years of Average Labor Income for a Worker Age 30-49, in Relation to Total Fertility Rates, 8 Countries for the Most Recent Year Available.
Source: Recalculated from Lee and Mason (2010) using Asian countries and the US.
Note: Human capital spending is cumulated per capita values (public and private combined) for ages 0-26 for education and 0-18 for health care for the most recent year (1997 to 2005) available.
An important issues which remain to be addressed is the productivity of the high
y = -1.6817x + 7.1278 R2 = 0.7317
0 1 2 3 4 5 6 7
0 1 2 3 4
Total Fertility Rate
H u m a n cap it al p e r ch il d / av er a g e l a b o r i n co m e 30 -4 9 Taipei Japan S. Korea US Thailand Indonesia India Philippines
24
spending on education observed in Taipei, Japan, and Korea. In addition, human capital spending lags in many Asian countries. China is not included in the figure, because it is an outlier. The case of China is particularly striking, where very low levels of fertility have not been accompanied by high rates of investment in human capital. Further
analysis of the time series estimates available for Japan, Korea, and Taipei by Ogawa, et al. (2009) show that in those three countries fertility decline was accompanied by substantial increases in human capital spending. Time series estimates for China are not yet available.
The investment response to population aging naturally integrates sustaining economic growth and providing economic security to the elderly. This is because the high rate of investment is a consequence of workers saving more for their own retirement. The situation is very different with human capital. Retirees do not own the human capital in which they have invested. Instead it is owned by the children who received it through investments made by parents or taxpayers or both. The only way for recouping the investment in human capital is through expanded public transfers. Given current trends in private transfers, it seems unlikely that parents who invest more in their children are likely to be compensated in the form of old-age support directly from their children. The compensation is more likely to take the form of public transfers intermediated by the government. Smaller cohorts of workers would thus pay higher taxes to support the elderly, as compensation for the high levels of human capital investment they received.
It should be emphasized that the two paths to successfully cope with population aging – physical capital and human capital – are not mutually exclusive. A sound approach to sustaining economic growth and providing economic security for the elderly would strike the right balance between assets and public transfers while promoting high rates of human capital investment. Finally, although the discussion here has centered on economic growth and average standards of living, issues of poverty and inequality are also inextricably linked to population aging. Unfortunately, little is known about this issue for Asia although a number of studies have examined the link between population aging and poverty/inequality in the Latin American context. One school of thought views inter-generational conflict through the prism of intra-generational inequality. For example, Turra and Holz (2009), using NTA data for
25
Brazil, stress a view of government controlled by class interests – in which most public pension benefits are directed to the wealthy elderly and most public tertiary education benefits are directed toward wealthy university students. Although studies for Asia are limited, we hope that enriched microeconomic data set can shed a light on this issue for Asia soon.
6.
Concluding Observations
Having recovered from the global financial and economic crisis with remarkable speed and vigor, Asia now faces the fundamental challenge of sustaining economic growth into the medium and long term. The external environment is likely to be less favorable for Asia’s spectacularly successful export-led growth strategy in the post-global crisis period in light of the prospective weakness of the advanced economies and their demand for imports. In addition to a less favorable global environment, Asia will face a number of structural shifts will impinge upon its ability to revert to the high-growth trajectory which characterized the region prior to the global crisis. For example, the large and growing environmental costs of Asia’s rapid growth in the past makes it imperative for the region to strive for an environmentally more sustainable growth pattern in the future. All the more so since Asia’s growing relative weight in the world economy means that it will be expected to contribute more to global public goods such as fighting climate change.
Perhaps the single most significant structural change confronting Asia in the post-global crisis period is population aging. For the region as a whole, youthful populations which contributed substantially to growth in the past are giving way to older populations. To be sure, there is considerable heterogeneity across the region in terms of the demographic transition, with some countries such as Japan and Korea at much more advanced stages of the transition than others. Even countries which currently have relatively youthful populations, such as India and Philippines, will experience substantial graying in the years to come. Therefore, population aging is a region-wide phenomenon with economic ramifications for the entire region. At a broader level,
26
Asia’s demographic transition poses two huge challenges to the region – (1) developing socioeconomic systems that can provide economic security to the growing number of elderly and (2) sustaining strong growth in the face of aging over the next few decades.
How well Asia tackles the two objectives will have a major say in whether the region will be able to revert to its pre-global crisis high-growth trajectory in the medium and long term. The two objectives sometimes come into sharp conflict with each other. For example, at least some public transfers are required to provide economic security for the region’s growing number of elderly but over-generous public transfers imply high tax burdens which have adverse impact on long-run growth. One strategy for securing old-age income support for the elderly and achieving strong growth on a sustained basis is to promote investment in physical capital. This strategy is very much in line with Asia’s traditionally high saving and investment rates. It is also consistent with Asia’s traditional aversion to excessive public transfers to the elderly. The other strategy is to promote investment in human capital so as to make workers more productive. Parents’ recovery of human capital investment in their children will require taxes and public transfers.
Asian policymakers face a number of difficult obstacles in their quest to meet the two fundamental challenges arising from population aging. For example, while extensive restructuring and reform since the Asian financial crisis of 1997-1998 has made Asia’s financial systems sounder and more efficient, they still lag substantially behind the region’s dynamic real economy. Yet resilient and well-functioning banks and capital markets are essential for encouraging savings and capital accumulation. To cite another example, many Asian countries are saddled with rigid inflexible labor markets which discourage employers from hiring workers, let alone older workers. In order for Asian countries to meet the two strategic challenges arising from population aging, regional governments need to put in place policies conducive for work effort, high rates of savings and investment, and greater investment in human capital. Closer regional cooperation and integration is an integral component of such policies.
The sheer speed and scale of Asia’s population aging, which is unprecedented in human history, adds a sense of urgency to the task of preparing for an older demographic structure. While it is true that the more immediate priority for younger countries is to fully take advantage of a still-wide window of demographic opportunity,
27
they too should start planning for a greyer future. Even though the age structure of 2050 may seem too distant to be relevant today, the policies implemented by today’s governments will influence the ability of today’s workers to adequately prepare for their retirement in the future. In fact, regardless of their current demographic profile, countries across the region should prepare as early as possible to cope with the socio-economic impact of population aging. They would also do well to learn from the policy mistakes of the advanced economies which had aged earlier – e.g. fiscally unsustainable public transfers and premature retirement ages. Once inappropriate old-age support policies become entrenched, they are politically almost impossible to reverse, as evident in the vocal opposition to even relatively limited pension reforms in the advanced economies. On the other hand, failure to spread the fruits of growth to the elderly – a large and growing share of Asia’s population - will not only be socially costly but may adversely affect economic growth via political instability.
28
References
An, C-B., Y-J Chun, E-S Gim, N. Hwang, and S-H Lee. (Forthcoming), ‘Intergenerational Resource Allocation in the Republic of Korea’, Population Aging and the Generational Economy. R. Lee and A. Mason (eds.), UK: Edward Elgar.
Becker, G. S. and R. J. Barro (1988), ‘A Reformulation of the Economic Theory of Fertility’, The Quarterly Journal of Economics, 103(1): 1-25.
Bloom, D. E. and J. G. Williamson (1998), ‘Demographic Transitions and Economic Miracles in Emerging Asia’, World Bank Economic Review, 12: 419-455.
Bloom, D. E., D. Canning and P. Malaney (2000), ‘Demographic Change and Economic Growth in Asia’, Population and Development Review 26, supplement: 257-290. Bloom, D. E., D. Canning, and J. Sevilla (2002), The Demographic Dividend: A New
Perspective on the Economic Consequences of Population Change. Santa Monica, CA, RAND.
Feldstein, M. (1974), ‘Social Security, Induced Retirement, and Aggregate Capital Accumulation’, Journal of Political Economy, 82(5): 905-926.
Feldstein, M., ed. (1998), Privatizing Social Security. Chicago and London, University of Chicago Press.
Feldstein, M. and A. Samwick (2001), ‘Potential Paths of Social Security Reform.” NBER Working Papers, No. 8592.
Gale, W. G. (1998), ‘The Effects of Pensions on Household Wealth: A Re-evaluation of Theory and Evidence’, Journal of Political Economy, 106(4): 706-723.
Kelley, A. C. and R. M. Schmidt (1995), ‘Aggregate Population and Economic Growth Correlations: The Role of the Components of Demographic Change’, Demography, 32(4): 543-555.
Kelley, A. C. and R. M. Schmidt (2001), ‘Economic and Demographic Change: A Synthesis of Models, Findings, and Perspectives’, Population Matters: Demographic Change, Economic Growth, and Poverty in the Developing World. N. Birdsall, A. C. Kelley, and S. Sinding (eds.). New York, Oxford University Press: 67-105.
Krueger, D. and Kubler, F. (2002), ‘Intergenerational Risk-sharing via Social Security when Financial Markets are Incomplete’, American Economic Review, 92(2): 407-410.
Lee, R. and A. Mason (2010), ‘Fertility, Human Capital, and Economic Growth over the Demographic Transition’, European Journal on Population, 26(2): 159-182. Lee, R., A. Mason, and T. Miller (2003), ‘From Transfers to Individual Responsibility:
Implications for Savings and Capital Accumulation in Taiwan and the United States’, Scandinavian Journal of Economics, 105(3): 339-357.
29
Lee, R.D. (1994), ‘The Formal Demography of Population Aging, Transfers, and the Economic Life Cycle’, in L.G. Martin and S. H. Preston, Demography of Aging. Washington, D.C., National Academy Press: 8-49.
Li, L., Q. Chen, and Y. Jiang. (forthcoming), ‘The Changing Pattern of China’s Public Services’, Population Aging and the Generational Economy. R. Lee and A. Mason (eds.). UK: Edward Elgar.
Maliki (forthcoming), ‘The Support System for Indonesian Elders: Moving Toward a Sustainable National Pension System,” Population Aging and the Generational Economy. R. Lee and A. Mason (eds.). UK: Edward Elgar.
Mason, A., ed. (2001), Population Change and Economic Development in East Asia: Challenges Met, Opportunities Seized. Stanford, Stanford University Press. Mason, A. and R. Lee (2007), ‘Transfers, Capital, and Consumption over the
Demographic Transition’, Population Aging, Intergenerational Transfers and the Macroeconomy. R. Clark, N. Ogawa, and A. Mason (eds.). Cheltenham, UK and Northampton, MA, USA, Edward Elgar: 128-162.
Mason, A., R. Lee, A.-C. Tung, M. S. Lai, and T. Miller (2009), ‘Population Aging and Intergenerational Transfers: Introducing Age into National Income Accounts’, Developments in the Economics of Aging. D. Wise (ed.). Chicago and London, National Bureau of Economic Research: University of Chicago Press: 89-124. Mason, A., R. Lee, and S-H Lee (2010a), ‘Population Dynamics: Social Security,
Markets, and Families’, International Social Security Review, 63 (3): 145-75. Mason, A, R. Lee, and S.-H. Lee (2010b), ‘The Demographic Transition and Economic
Growth in the Pacific Rim’, The Economic Consequences of Demographic Change in East Asia, NBER-EASE Volume 19. T. Ito and A. Rose (eds.). Chicago: University of Chicago Press.
Miller, T. and J. Bravo. (forthcoming), ‘The Rise of the Intergenerational State: Aging and Development’, Population Aging and the Generational Economy. R. Lee and A. Mason (eds.). UK: Edward Elgar.
Modigliani, F. and R. Brumberg (1954), ‘Utility Analysis and the Consumption Function: An Interpretation of Cross-section Data’, Post-Keynesian Economics. K.K. Kurihara (ed.). New Brunswick, N.J., Rutgers University Press: 388-436. Munnell, A. H. (1974), The Effect of Social Security on Personal Savings. Cambridge,
MA, Ballinger.
Ogawa, N., A. Mason, A. Chawla, R. Matsukura, and A.-C. Tung (2009), ‘Declining Fertility and the Rising Cost of Children: What can NTA say about Low Fertility in Japan and other Asian Countries?’ Asian Population Studies 5(3), Special Issue: Low Fertility in East and Southeast Asia: Economic, Social and Policy Influences: 289-307.
Tobin, J. (1967), ‘Life Cycle Saving and Balanced Economic Growth’, Ten Economic Studies in the Tradition of Irving Fisher. W. Fellner (ed.). New York, Wiley: 231-256.
30
Turra, C., and M. Holz (2009), ‘Who Benefits from Public Transfers? Incidence across Income Groups and across Generations’, Paper presented at author’s workshop for Demographic Change and Social Policy: A LAC Regional Study, held at the World Bank, Washington, D.C., July 14–15.
31
ERIA Discussion Paper Series
No. Author(s) Title Year
2011-04 Sang-Hyop LEE, Andrew MASON, and Donghyun PARK
Why Does Population Aging Matter So Much for Asia?
Population Aging, Economic Security and Economic Growth in Asia
Aug 2011
2011-03 Xunpeng SHI, Shinichi GOTO
Harmonizing Biodiesel Fuel Standards in East Asia: Current Status, Challenges and the Way Forward
May 2011 2011-02 Hikari ISHIDO Liberalization of Trade in Services under ASEAN+n : A Mapping Exercise May 2011 2011-01
Kuo-I CHANG,
Kazunobu HAYAKAWA Toshiyuki MATSUURA
Location Choice of Multinational Enterprises in China: Comparison between Japan and Taiwan
Mar 2011 2010-11 Charles HARVIE, Dionisius NARJOKO, Sothea OUM
Firm Characteristic Determinants of SME Participation in Production Networks
Oct 2010
2010-10 Mitsuyo ANDO Machinary Trade in East Asia, and the Global
Financial Crisis
Oct 2010
2010-09 Fukunari KIMURA
Ayako OBASHI
International Production Networks in Machinery Industries: Structure and Its Evolution
Sep 2010
2010-08
Tomohiro MACHIKITA, Shoichi MIYAHARA, Masatsugu TSUJI, and Yasushi UEKI
Detecting Effective Knowledge Sources in Product Innovation: Evidence from Local Firms and MNCs/JVs in Southeast Asia
Aug 2010
2010-07
Tomohiro MACHIKITA, Masatsugu TSUJI, and Yasushi UEKI
How ICTs Raise Manufacturing Performance: Firm-level Evidence in Southeast Asia
Aug 2010
2010-06 Xunpeng SHI
Carbon Footprint Labeling Activities in the East Asia Summit Region: Spillover Effects to Less Developed Countries
July 2010
2010-05
Kazunobu HAYAKAWA, Fukunari KIMURA, and Tomohiro MACHIKITA
Firm-level Analysis of Globalization: A Survey of the Eight Literatures
Mar 2010
2010-04 Tomohiro MACHIKITA
and Yasushi UEKI
The Impacts of Face-to-face and Frequent Interactions on Innovation:
Upstream-Downstream Relations
Feb 2010
32
2010-03 Tomohiro MACHIKITA
and Yasushi UEKI
Innovation in Linked and Non-linked Firms: Effects of Variety of Linkages in East Asia
Feb 2010
2010-02 Tomohiro MACHIKITA
and Yasushi UEKI
Search-theoretic Approach to Securing New Suppliers: Impacts of Geographic Proximity for Importer and Non-importer
Feb 2010
2010-01 Tomohiro MACHIKITA
and Yasushi UEKI
Spatial Architecture of the Production Networks in Southeast Asia:
Empirical Evidence from Firm-level Data
Feb 2010
2009-23 Dionisius NARJOKO
Foreign Presence Spillovers and Firms’ Export Response:
Evidence from the Indonesian Manufacturing
Nov 2009
2009-22
Kazunobu HAYAKAWA, Daisuke HIRATSUKA, Kohei SHIINO, and Seiya SUKEGAWA
Who Uses Free Trade Agreements? Nov
2009
2009-21 Ayako OBASHI Resiliency of Production Networks in Asia:
Evidence from the Asian Crisis
Oct 2009
2009-20 Mitsuyo ANDO and
Fukunari KIMURA Fragmentation in East Asia: Further Evidence
Oct 2009
2009-19 Xunpeng SHI
The Prospects for Coal:
Global Experience and Implications for Energy Policy
Sept 2009
2009-18 Sothea OUM Income Distribution and Poverty in a CGE
Framework: A Proposed Methodology
Jun 2009
2009-17 Erlinda M. MEDALLA
and Jenny BALBOA
ASEAN Rules of Origin:
Lessons and Recommendations for the Best Practice
Jun 2009
2009-16 Masami ISHIDA Special Economic Zones and Economic Corridors Jun
2009
2009-15 Toshihiro KUDO Border Area Development in the GMS:
Turning the Periphery into the Center of Growth
May 2009
2009-14 Claire HOLLWEG and
Marn-Heong WONG
Measuring Regulatory Restrictions in Logistics Services
Apr 2009
2009-13 Loreli C. De DIOS Business View on Trade Facilitation Apr
2009 2009-12 Patricia SOURDIN and
Richard POMFRET Monitoring Trade Costs in Southeast Asia
Apr 2009 2009-11 Philippa DEE and
Huong DINH
Barriers to Trade in Health and Financial Services in ASEAN
Apr 2009
33
2009-10 Sayuri SHIRAI
The Impact of the US Subprime Mortgage Crisis on the World and East Asia: Through Analyses of Cross-border Capital Movements
Apr 2009
2009-09 Mitsuyo ANDO and Akie IRIYAMA
International Production Networks and Export/Import Responsiveness to Exchange Rates:
The Case of Japanese Manufacturing Firms
Mar 2009
2009-08 Archanun
KOHPAIBOON
Vertical and Horizontal FDI Technology Spillovers: Evidence from Thai Manufacturing
Mar 2009 2009-07
Kazunobu HAYAKAWA, Fukunari KIMURA, and Toshiyuki MATSUURA
Gains from Fragmentation at the Firm Level: Evidence from Japanese Multinationals in East Asia
Mar 2009
2009-06 Dionisius A. NARJOKO
Plant Entry in a More Liberalised Industrialisation Process: An Experience of Indonesian
Manufacturing during the 1990s
Mar 2009
2009-05
Kazunobu HAYAKAWA, Fukunari KIMURA, and Tomohiro MACHIKITA
Firm-level Analysis of Globalization: A Survey Mar
2009
2009-04 Chin Hee HAHN and
Chang-Gyun PARK
Learning-by-exporting in Korean Manufacturing: A Plant-level Analysis
Mar 2009
2009-03 Ayako OBASHI Stability of Production Networks in East Asia:
Duration and Survival of Trade
Mar 2009
2009-02 Fukunari KIMURA
The Spatial Structure of Production/Distribution Networks and Its Implication for Technology Transfers and Spillovers
Mar 2009
2009-01 Fukunari KIMURA and
Ayako OBASHI
International Production Networks: Comparison between China and ASEAN
Jan 2009
2008-03 Kazunobu HAYAKAWA
and Fukunari KIMURA
The Effect of Exchange Rate Volatility on International Trade in East Asia
Dec 2008
2008-02
Satoru KUMAGAI, Toshitaka GOKAN, Ikumo ISONO, and Souknilanh KEOLA
Predicting Long-Term Effects of Infrastructure Development Projects in Continental South East Asia: IDE Geographical Simulation Model
Dec 2008
2008-01
Kazunobu HAYAKAWA, Fukunari KIMURA, and Tomohiro MACHIKITA
Firm-level Analysis of Globalization: A Survey Dec 2008