R
EVIEW
INTRODUCTION
The advent of real-time PCR and real-time reverse transcription PCR (real-time RT-PCR) has dramatically changed the field of measuring gene expression. Real-time PCR is the technique of collecting data throughout the PCR process as it occurs, thus combining amplification and detection into a single step. This is achieved using a variety of different fluorescent chemistries that correlate PCR product concentration to fluorescence intensity (1). Reactions are characterized by the point in time (or PCR cycle) where the target amplification is first detected. This value is usually referred to as cycle threshold (Ct), the time at which fluorescence intensity is greater than background fluorescence. Conse-quently, the greater the quantity of target DNA in the starting material, the faster a significant increase in fluorescent signal will appear, yielding a lower Ct (2).
There are many benefits of using real-time PCR over other methods to quantify gene expression. It can produce quantitative data with an accurate dynamic range of 7 to 8 log orders of magnitude (3) and does not require post-amplification manipu-lation. Real-time PCR assays are 10,000- to 100,000-fold more sensitive
than RNase protection assays (4), 1000-fold more sensitive than dot blot hybridization (5), and can even detect a single copy of a specific transcript (6). In addition, real-time PCR assays can reliably detect gene expression differ-ences as small as 23% between samples (7) and have lower coefficients of variation (cv; SYBR® Green at 14.2%;
TaqMan® at 24%) than end point assays
such as band densitometry (44.9%) and probe hybridization (45.1%) (8). Real-time PCR can also discriminate between messenger RNAs (mRNAs) with almost identical sequences, requires much less RNA template than other methods of gene expression analysis, and can be relatively high-throughput given the proper equipment. The major disadvantage to real-time PCR is that it requires expensive equipment and reagents. In addition, due to its extremely high sensitivity, sound experimental design and an in-depth understanding of normalization techniques are imperative for accurate conclusions.
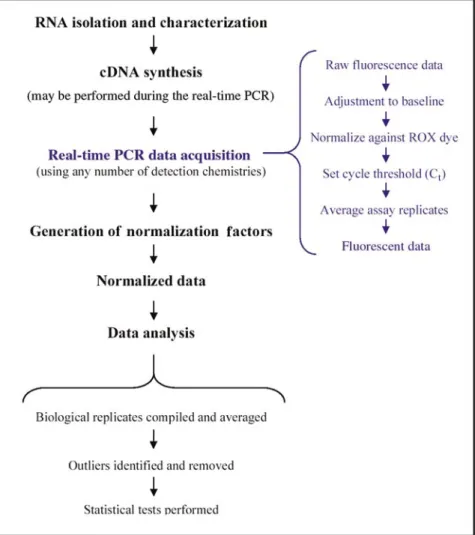
The general steps performed during a real-time PCR experiment, from RNA isolation to data analysis, are outlined in Figure 1. This review is intended to provide an overview of the many facets of real-time PCR, highlighting PCR theory, quantification methods and models, data normalization, types
of detection chemistry, and causes of variation.
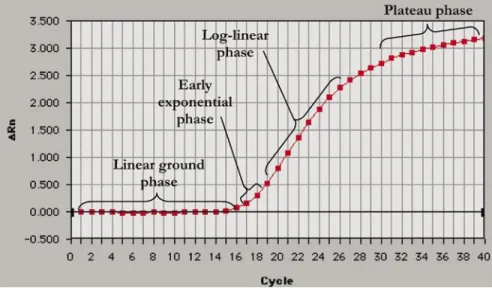
THEORY OF REAL-TIME PCR PCR can be broken into four major phases (Figure 2): the linear ground phase, early exponential phase, log-linear (also known as exponential) phase, and plateau phase (9). During the linear ground phase (usually the first 10–15 cycles), PCR is just beginning, and fluorescence emission at each cycle has not yet risen above background. Baseline fluorescence is calculated at this time. At the early exponential phase, the amount of fluorescence has reached a threshold where it is significantly higher (usually 10 times the standard deviation of the baseline) than background levels. The cycle at which this occurs is known as Ct in ABI Prism® literature (Applied
Biosystems, Foster City, CA, USA) or crossing point (CP) in LightCycler®
literature (Roche Applied Science, Indianapolis, IN, USA) (2,10). This value is representative of the starting copy number in the original template and is used to calculate experimental results (2). During the log-linear phase, PCR reaches its optimal amplification period with the PCR product doubling after every cycle in ideal reaction
Real-time PCR for mRNA quantitation
Marisa L. Wong and Juan F. Medrano
Real-time PCR has become one of the most widely used methods of gene quantitation because it has a large dynamic range, boasts tremendous sensitivity, can be highly sequence-specific, has little to no post-amplification processing, and is amenable to increasing sample throughput. However, optimal benefit from these advantages requires a clear understanding of the many options available for running a real-time PCR experiment. Starting with the theory behind real-time PCR, this review discusses the key components of a real-time PCR experiment, including one-step or two-step PCR, absolute versus relative quantitation, mathematical mod-els available for relative quantitation and amplification efficiency calculations, types of normalization or data correction, and detection chemistries. In addition, the many causes of variation as well as methods to calculate intra- and inter-assay variation are addressed.
University of California, Davis, CA, USA
conditions. Finally, the plateau stage is reached when reaction components become limited and the fluorescence intensity is no longer useful for data calculation (11).
One-Step Versus Two-Step Real-Time PCR
When quantifying mRNA, real-time PCR can be performed as either a one-step reaction, where the entire reaction from cDNA synthesis to PCR amplification is performed in a single tube, or as a two-step reaction, where reverse transcription and PCR ampli-fication occur in separate tubes. There
are several pros and cons associated with each method. One-step real-time PCR is thought to minimize experimental variation because both enzymatic reactions occur in a single tube. However, this method uses an RNA starting template, which is prone to rapid degradation if not handled properly. Therefore, a one-step reaction may not be suitable in situations where the same sample is assayed on several occasions over a period of time. One-step protocols are also reportedly less sensitive than two-step protocols (12).
Two-step real-time PCR separates the reverse transcription reaction from the real-time PCR assay, allowing
several different real-time PCR assays on dilutions of a single cDNA. Because the process of reverse transcription is notorious for its highly variable reaction efficiency (13), using dilutions from the same cDNA template ensures that reactions from subsequent assays have the same amount of template as those assayed earlier. Data from two-step real-time PCR is quite repro-ducible with Pearson correlation coefficients ranging from 0.974 to 0.988 (14). A two-step protocol may be preferred when using a DNA binding dye (such as SYBR Green I) because it is easier to eliminate primer-dimers through the manipulation of melting temperatures (Tms) (14). However, two-step protocols allow for increased opportunities of DNA contamination in real-time PCR.
TYPES OF REAL-TIME QUANTIFICATION Absolute Quantitation
Absolute quantitation uses serially diluted standards of known concen-trations to generate a standard curve. The standard curve produces a linear relationship between Ct and initial amounts of total RNA or cDNA, allowing the determination of the concentration of unknowns based on their Ct values (2). This method assumes all standards and samples have approximately equal amplifi-cation efficiencies (15). In addition, the concentration of serial dilutions should encompass the levels in the experimental samples and stay within the range of accurately quantifiable and detectable levels specific for both the real-time PCR machine and assay.
The PCR standard is a fragment of double-stranded DNA (dsDNA), single-stranded DNA (ssDNA), or cRNA bearing the target sequence. A simple protocol for constructing a cRNA standard for one-step PCR can be found in Fronhoffs et al. (16), while a DNA standard for two-step real-time PCR can be synthesized by cloning the target sequence into a plasmid (17), purifying a conventional PCR product (18), or directly synthesizing the target nucleic acid. The standard used must be a pure species. DNA standards have Figure 1. Steps performed when measuring gene expression using real-time PCR. RNA is
first isolated and characterized for quantity and integrity. If performing a one-step reaction, RNA is used as a template for the real-time PCR assay, and reverse transcription occurs during the as-say. During a two-step reaction, cDNA is first synthesized and then used as a PCR template. The steps performed on the real-time PCR machine are shown in blue, the time during which raw fluorescence data are collected, adjusted, and manipulated to generate the output data used for analysis. For normalizing results with multiple housekeeping genes, a normalization factor must be calculated for each individual sample. Dividing the fluorescent data by its normalization factor produces the normalized data, which is followed by statistical analysis.
been shown to have a larger quantifi-cation range and greater sensitivity, reproducibility, and stability than RNA standards (19). However, a DNA standard cannot be used for a one-step real-time RT-PCR due to the absence of a control for the reverse transcription efficiency (20).
Relative Quantitation
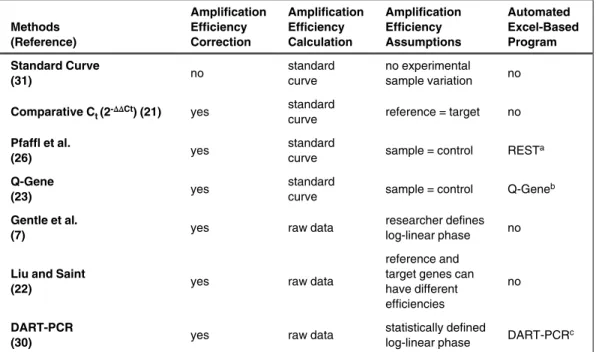
During relative quantitation, changes in sample gene expression are measured based on either an external standard or a reference sample, also known as a calibrator (21). When using a calibrator, the results are expressed as a target/ reference ratio. There are numerous mathematical models available to calculate the mean normalized gene expression from relative quantitation assays. Depending on the method employed, these can yield different results and thus discrepant measures of standard error (22,23). Table 1 shows a comparison of the different methods, with an explanation of each method to follow.
Amplification efficiency. Ampli-fication efficiency of the reaction is an important consideration when performing relative quantitation. Past
Table 1. Characteristics of Relative Quantitation Methods Methods
(Reference)
Amplification Efficiency Correction
Amplification Efficiency Calculation
Amplification Efficiency Assumptions
Automated Excel-Based Program Standard Curve
(31) no
standard curve
no experimental sample variation no
Comparative Ct (2-∆∆Ct) (21) yes standard
curve reference = target no
Pfaffl et al.
(26) yes standard curve sample = control RESTa
Q-Gene
(23) yes
standard
curve sample = control Q-Geneb
Gentle et al.
(7) yes raw data
researcher defines log-linear phase no
Liu and Saint
(22) yes raw data
reference and target genes can have different efficiencies
no
DART-PCR
(30) yes raw data
statistically defined
log-linear phase DART-PCRc
Ct, cycle threshold, DART-PCR, data analysis for real-time PCR; REST, relative expression software tool. awww.gene-quantification.info
bwww.BioTechniques.com
cnar.oupjournals.org/cgi/content/full/31/14/e73/DC1
methods of calculating gene expression have assumed the amplification efficiency of the reaction is ideal, or 1, meaning the PCR product concentration doubles during every cycle within the exponential phase of the reaction (24). However, many PCRs do not have ideal amplification efficiencies, and calcula-tions without an appropriate correction factor may overestimate starting concentration (22). Current mathe-matical models make assumptions of reaction kinetics and usually require its accurate measurement (7,21,22,25,26).
Traditionally, amplification efficiency of a reaction is calculated using data collected from a standard curve with the following formula (27): [Eq. 1] Exponential amplification = 10(-1/slope)
Efficiency = [10(-1/slope)]-1
The amplification efficiency of the reaction varies from being relatively stable in the early exponential phase and gradually declining to zero (22). This decay is due to the depletion of PCR components, the decline of polymerase activity, and competition with PCR products. Calculation of amplification
efficiency using a standard curve is not reflective of this changing efficiency (28) and may overes-timate efficiencies (9). Because PCR results are based on Ct, which are deter-mined very early in the exponential phase of the reaction, these differences in ampli-fication efficiency usually generate only minor differences in Ct value (20). Nonetheless, after 26 cycles, a 5% difference in amplification efficiency can result in a 2-fold difference of PCR product concentration (29).
There are several alternate methods of calculating ampli-fication efficiency based on raw data collected during PCR (7,9,22,25,30). During the exponential phase, the absolute fluores-cence increase at each PCR cycle for each individual sample reflects the true reaction kinetics of that sample. Consequently, data collected during the exponential phase can be log-trans-formed and plotted with the slope of the regression line representing the sample’s amplification efficiency. In the Liu and Saint (22) method, the individual researcher designates which cycles have exponential characteristics, while the method proposed by Tichopad et al. (9) uses a statistical calculation to define the period of exponential growth. Amplification efficiency calculated from raw data analysis is reportedly more accurate than when derived from a standard curve (9,25).
Standard curve method for relative quantification. The quantity of each experimental sample is first deter-mined using a standard curve and then expressed relative to a single calibrator sample (31). The calibrator is desig-nated as 1-fold, with all experimentally derived quantities reported as an n-fold difference relative to the calibrator. Because sample quantity is divided
by calibrator quantity, standard curve units are eliminated, requiring only the relative dilution factors of the standards for quantification. This method is often applied when the amplification efficiencies of the reference and target genes are unequal (22). It is also the simplest method of quantification because it requires no preparation of exogenous standards, no quantification of calibrator samples, and is not based on complex mathematics. However, because this method does not incor-porate an endogenous control (usually a housekeeping gene), results must still be normalized.
Comparative Ct (2-∆∆Ct) method.
The comparative Ct method is a mathematical model that calculates changes in gene expression as a relative fold difference between an experi-mental and calibrator sample. While this method includes a correction for nonideal amplification efficiencies (i.e., not 1; Reference 21), the ampli-fication kinetics of the target gene and reference gene assays must be approxi-mately equal (32) because different efficiencies will generate errors when using this method (22). Consequently, a validation assay must be performed where serial dilutions are assayed for the target and reference gene and the results plotted with the log input concentration for each dilution on the x-axis, and the difference in Ct (target-reference) for each dilution on the y-axis. If the absolute value of the slope of the line is less than 0.1, the comparative Ct method may be used (21). The PCR product size should be kept small (less than 150 bp) and the reaction rigorously optimized (25). Because the comparative Ct method does not require a standard curve, it is useful when assaying a large number of samples since all reaction wells are filled with sample reactions rather than standards.
Pfaffl model. The Pfaffl model (26) combines gene quantification and normalization into a single calcu-lation. This model incorporates the amplification efficiencies of the target and reference (normalization) genes to correct for differences between the two assays. The relative expression software tool (REST©), which runs
in Microsoft® Excel, automates data
analysis using this model (33). REST
uses the Pairwise Fixed Reallocation Randomization Test© to calculate
result significance and will indicate if the reference gene used is suitable for normalization.
Q-Gene. Q-Gene is a fully compre-hensive Microsoft Excel-based software application that aids in the entire process of a real-time PCR experiment, from experimental planning and setup through data analysis and graphical presentation (23). Q-Gene calculates the mean normalized gene expression with standard errors using two different mathematical models, both correcting for amplification efficiencies. The calculated expression values are then compared between two matched groups to determine the expression of a sample relative to a calibrator. The program also includes several statistical tests such as the paired or unpaired Student’s t-test, a Mann-Whitney U-test, Wilcoxon signed-rank test, together with Pearson’s correlation analysis to fully assess the significance of experimental results. When running large or complex real-time PCR experiments, having an organized and automated method such as Q-Gene can significantly expedite data processing and management.
Gentle et al. Gentle et al. (7) designed one of the first models in which both fold changes between
samples and amplification efficiencies of experimental versus control samples are calculated without the use of standard curves. Linear regression analyses of the mean of the raw log fluorescence data collected during the exponential phase of the PCR are used to calculate the amplification efficiency of each sample. By graphing the control and experimental samples together, they show that the vertical distance between the control and experimental lines is the log of the fold difference between the two, with the slopes of the lines representing the log of their amplification efficiencies (7).
Liu and Saint. Liu and Saint (22) developed a sigmoidal mathematical model to quantitate and normalize gene expression. Similar to Gentle et al. (7), this method calculates amplification efficiencies from the actual slope of the amplification plot rather than a standard curve. The authors found this method was more accurate than the comparative Ct method with regard to the varying amplification efficiency throughout the PCR because the user defines which PCR cycles experience exponential growth and are used for the calculation (22).
Amplification plot method. The amplification plot method uses a simple algorithm to calculate the amplification
Figure 2. Phases of the PCR amplification curve. The PCR amplification curve charts the accumula-tion of fluorescent emission at each reacaccumula-tion cycle. The curve can be broken into four different phases: the linear ground, early exponential, log-linear, and plateau phases. Data gathered from these phases are important for calculating background signal, cycle threshold (Ct), and amplification efficiency. Rn is the intensity of fluorescent emission of the reporter dye divided by the intensity of fluorescent emission of the passive dye (a reference dye incorporated into the PCR master mix to control for differences in master mix volume). ∆Rn is calculated as the difference in Rn values of a sample and either no template control or background, and thus represents the magnitude of signal generated during PCR. This graph was generated with ABI Prism SDS version 1.9 software (Applied Biosystems).
efficiency of every sample individually within the real-time PCR assay. These data are then used in the calculation for expression quantitation (30). To ease data handling, Peirson et al. (30) have developed a Microsoft Excel workbook entitled Data Analysis for Real-Time PCR (DART-PCR) that quickly calcu-lates all results from raw data.
Absolute or Relative Quantitation: Pros and Cons
Absolute quantitation is considered to be more labor-intensive than relative quantitation because of the necessity to create reliable standards for quanti-tation and include these standards in every PCR (19). However, when
performing relative quantitation, the data (Ct) used for comparison are arbitrary values and only applicable to the samples run within the same PCR. To compare samples between two different PCRs, it is necessary to include a reference control in every plate or run. In cases where data compared are assayed on different days or in different laboratories, absolute quantitation may be preferred because results are based on a constant. In terms of fold-change data, absolute and relative quantitation methods produce comparable results (30).
Controls
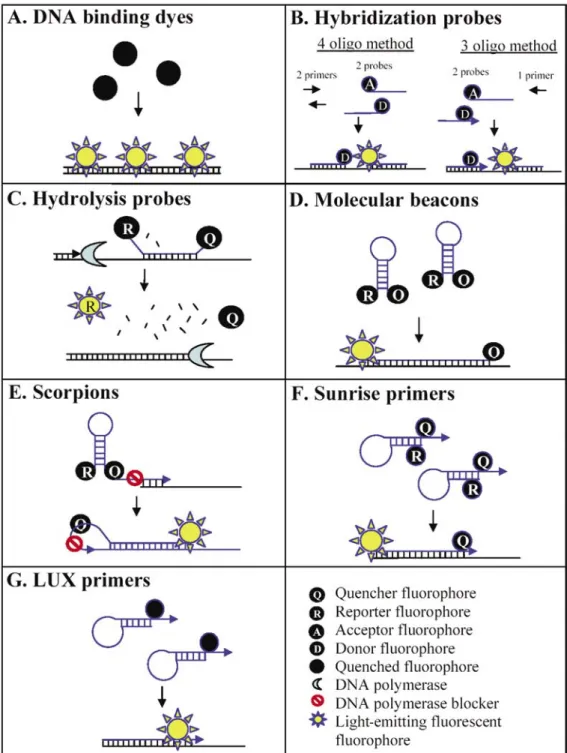
There are several types of controls that ensure the integrity of every step of the real-time PCR process. DNA contamination in the sample may be accounted for with a minus reverse transcription control. However, when one has numerous samples, an alternate method to prevent the detection of genomic DNA is to design the target PCR product to span an exon/exon boundary. Variation in the efficiency of the reverse transcriptase as well as the amount of RNA added into the reaction can be accounted for using an endogenous control, which is a nucleic acid already present in an individual sample. The use of endogenous controls is discussed in detail in the section entitled Normal-ization. PCR master mix volume has been shown to be a factor in PCR amplification efficiency such that differ-ences in master mix volume in reactions using the same amount of starting template have different amplification efficiencies (22). A passive reference dye (such as ROX) is often included in the master mix to account for subtle differences in PCR master mix volumes as well as non-PCR-related fluctuations in Figure 3. Real-time PCR detection chemistries. Probe sequences are shown in blue while target DNA sequences
are shown in black. Primers are indicated by horizontal arrowheads. Not all unlabeled PCR primers are shown. Oligo, oligonucleotide.
fluorescence signal. Problems with the PCR master mix itself can be accounted for using an exogenous control, which is a synthesized construct of charac-terized RNA or DNA spiked into each reaction (34).
Normalization
Normalization of gene expression data is used to correct sample-to-sample variation. Starting material obtained from different individuals usually varies in tissue mass or cell number, RNA integrity or quantity, or experimental treatment. Under ideal conditions, mRNA levels can be standardized to cell number, but when using whole tissue samples, this type of normalization is impossible (35). Therefore, real-time PCR results are usually normalized against a control gene that may also serve as a positive control for the reaction. The ideal control gene should be expressed in an unchanging fashion regardless of experimental conditions, including different tissue or cell types, devel-opmental stage, or sample treatment. Because there is no one gene that meets this criterion for every experimental condition, it is necessary to validate
the expression stability of a control gene for the specific requirements of an experiment prior to its use for normal-ization (36).
Housekeeping genes (mRNA). Traditionally, genes thought to have stable expression have been employed as controls in gene expression assays. Due to the increased sensitivity and dynamic range of real-time PCR over traditional quantitation techniques, many of the well-known housekeeping genes such as GAPDH andβ-actin have been shown to be affected by different treatments, biological processes, and even different tissues or cell types (reviewed in depth in Reference 11). Consequently, normalization with a single housekeeping gene can falsely bias results. When using a house-keeping gene for normalization, it is absolutely imperative to validate its stability with one’s own samples rather than relying on previously published materials.
Ribosomal RNA (rRNA). rRNA is another possible reference gene for normalization. Of the two main rRNAs, 28S and 18S, 28S is considered more representative of mRNA integrity because 18S may remain intact in samples with degraded mRNA (37).
There are several problems with using 28S rRNA to normalize mRNA gene measurements. rRNAs are transcribed with a different polymerase than mRNAs, so changes in polymerase activity may not affect both types of RNA expression equally (38). This is likely reflected in the fact that rRNA expression tends to be less affected by treatments that significantly alter mRNA expression (39). Varying ratios of rRNA to mRNA have been reported (40) and, given the extreme abundance of 28S rRNA in a total RNA sample [in a 10-µg total RNA sample, on average 2 µg are 18S rRNA and 5.5 µg are 28S rRNA (Technical Bulletin #151, www. ambion.com/techlib/tb/tb_151.html; Reference 40a)], it may be impossible to accurately measure both 28S and a rare transcript in the same RNA or cDNA dilution. Lastly, rRNA, which lacks a poly(A) tail, cannot be measured if an oligo(dT) or gene-specific primer has been used for reverse transcription.
Total RNA. Gene expression measurements may be normalized against total RNA concentration (11). RNA quantitation can be performed via RiboGreen® RNA (Molecular
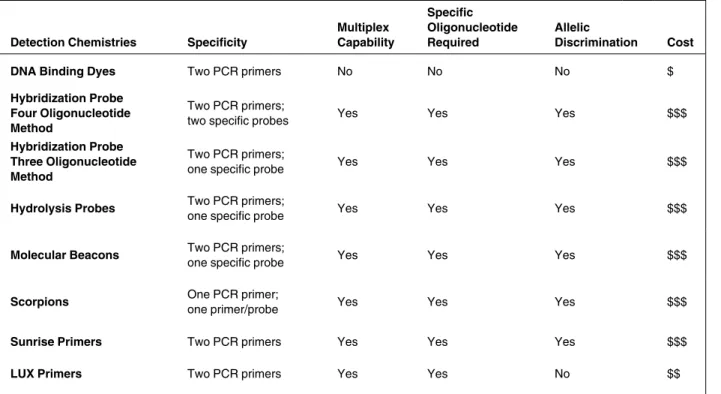
Probes, Eugene, OR, USA) quantifi-cation or the Agilent 2100 BioAnalyzer Table 2. Characteristics of Detection Chemistries
Detection Chemistries Specificity
Multiplex Capability
Specific Oligonucleotide Required
Allelic
Discrimination Cost
DNA Binding Dyes Two PCR primers No No No $
Hybridization Probe Four Oligonucleotide Method
Two PCR primers;
two specific probes Yes Yes Yes $$$
Hybridization Probe Three Oligonucleotide Method
Two PCR primers;
one specific probe Yes Yes Yes $$$
Hydrolysis Probes Two PCR primers;
one specific probe Yes Yes Yes $$$
Molecular Beacons Two PCR primers;
one specific probe Yes Yes Yes $$$
Scorpions One PCR primer;
one primer/probe Yes Yes Yes $$$
Sunrise Primers Two PCR primers Yes Yes Yes $$$
LUX Primers Two PCR primers Yes Yes No $$
(Agilent Technologies, Palo Alto, CA, USA); spectrophotometry may not have the sensitivity and accuracy required for this measurement. There are several inherent problems with this approach: total RNA levels are affected by cellular processes, RNA quality and reverse transcription efficiency are not considered, normalization is only as accurate as the RNA quantifi-cation, and, in situations where RNA is extracted from a microdissected tissue, all recovered RNA may be needed for the real-time PCR assay itself (35).
Multiple mRNAs. Given the many disadvantages of using cell number, mRNA, rRNA, or total RNA for normalization purposes, a new method of employing multiple housekeeping genes has emerged to minimize these problems (19,35,41). Multiple housekeeping genes are assayed and a normalization factor is calculated from the geometric mean of their expression levels (19,35). In this method, the expression stability of several (10–13) different housekeeping genes in the samples of interest are measured to identify the genes most suitable for an individual experiment. Microarray results may be exploited to identify potential normalization candidates (42). A list of housekeeping genes can be found in Vandesompele et al.(35). The expression stability of candidate control genes is determined with either geNorm (35) or BestKeeper (19), which are both Microsoft Excel applets that estimate gene stability through numerous pair-wise compar-isons. geNorm can be downloaded at medgen.ugent.be/~jvdesomp/genorm, and BestKeeper can be downloaded at www.gene-quantification.info. While the use of multiple housekeeping genes may be the most labor-intensive method, it is also the most conservative method of data normalization.
DETECTION CHEMISTRIES A diagram of all real-time PCR detection chemistries discussed in this review can be seen in Figure 3, with a comparison of their characteristics in Table 2.
DNA Binding Dyes
DNA binding dyes emit fluores-cence when bound to dsDNA (Figure 3A). As the double-stranded PCR product accumulates during cycling, more dye can bind and emit fluores-cence. Thus, the fluorescence intensity increases proportionally to dsDNA concentration (43). This technique is very flexible because one dye can be used for different gene assays. Conse-quently, multiplexing reactions is not possible. Because DNA binding dyes do not bind in a sequence-specific manner, these assays are prone to false positives (44). Accurate results demand a specific PCR, which can be confirmed via dissociation curve analysis, where the presence of different PCR products is reflected in the number of first-derivative melting peaks (45) or gel analysis (46). A protocol for SYBR Green I PCR master mix can be found in Ramos-Payen et al. (47).
Hybridization Probes
Hybridization probes can be utilized in either a four or three oligonucle-otide manner (for a short review, see Reference 48) (Figure 3B). The four oligonucleotide method consists of two PCR primers and two sequence-specific probes that bind adjacent to each other in a head-to-tail arrangement. The upstream probe is labeled with an acceptor dye on the 3′ end, and the downstream probe with a donor dye on the 5′ end (49), allowing the donor and acceptor fluorophores to experience an increase in fluorescence resonance energy transfer (FRET) when bound (48). The three oligonucleotide method is similar to the four oligonucleotide method, except that the upstream PCR primer is labeled with an acceptor dye on the 3′ end, and thus replaces the function of one of the probes from the four oligonucleotide method.
In both cases, the downstream probe can be designed to cover a mutation site and discriminate between known alleles and detect new alleles simultaneously (50). Alleles are identified and differ-entiated via dissociation curve (48). A single melting curve can distinguish up to four different Tms, and six differ-ently labeled probes may be multi-plexed, theoretically allowing a run of 24 assays in a single tube (48). While multiplex reactions are theoretically a
simple way to increase the efficiency of data collection, in reality it is a very technically challenging process that requires extensive optimization to ensure that reactions do not compete with each other (34).
Hydrolysis Probes
Hydrolysis probes, exemplified by the TaqMan chemistry, also known as 5′ nuclease assay, fluoresce upon probe hydrolysis to detect PCR product accumulation (Figure 3C). The sequence-specific probe is labeled with a reporter dye on the 5′ end and a quencher dye on the 3′ end (24), which allows the quencher to reduce the reporter fluorescence intensity by FRET when the probe is intact (51). While both hydrolysis and hybrid-ization probes rely on FRET to alter the intensity of fluorescence emission, the energy transfer works in opposite manners in these two chemistries. FRET reduces fluorescence intensity in hydrolysis probes and increases intensity in hybridization probes. When annealed to the target sequence, the bound and quenched probe will be degraded by the DNA polymerase’s 5′
nuclease ability during the extension step of the PCR. Probe degradation allows for separation of the reporter from the quencher dye, resulting in increased fluorescence emission (2,24).
Minor groove binders (MGBs), such as dihydrocyclopyrroloindole tripeptide (DPI3), may be added to these probes to increase their Tm and allow the use of a shorter probe (52). These probes are not only less expensive to produce but have reduced background fluorescence and a larger dynamic range due to increased efficiency of reporter quenching (52). Hairpin Probes
Molecular beacons. Consisting of a sequence-specific region (loop region) flanked by two inverted repeats, molecular beacons are the simplest hairpin probe (Figure 3D) (53). Reporter and quencher dyes are attached to each end of the molecule, causing a reduction in fluorescence emission via contact quenching (FRET) when the beacon is in hairpin formation (free in solution). When bound to
the target, the quencher and reporter are separated, allowing reporter emission. Hairpin probes tend to have greater specificity than linear probes because the probe-target complex must be thermodynamically more stable than the hairpin structure itself (54), a property often exploited for allele discrimination (55). To increase fluorescence emission, “wavelength-shifting molecular beacons” have been developed, which fluoresce in a number of colors from a single monochromatic light source (56).
Scorpions. Scorpions combine the detection probe with the upstream PCR primer (Figure 3E) (57) and consist of a fluorophore on the 5′ end, followed by a complementary stem-loop structure (also containing the specific probe sequence), quencher dye, DNA polymerase blocker (a nonampli-fiable monomer that prevents DNA polymerase extension), and finally a PCR primer on the 3′ end. The probe sequence contained within the hairpin allows the scorpion to anneal to the template strand, which separates the quencher for the fluorophore and results in increased fluorescence. Because sequence-specific priming and probing is a unimolecular event, scorpions perform better than bimolecular methods under conditions of rapid cycling such as the LightCycler (58). Cycling is performed at a temperature optimal for DNA polymerase activity instead of the reduced temperature necessary for the 5′ nuclease assay. Scorpions are specific enough for allele discrimination and may be multiplexed easily (58).
The scorpion chemistry has been improved with the creation of duplex scorpions in which the reporter dye/ probe and quencher fragment are on separate, complementary molecules (59). The duplex scorpions still bind in a unimolecular event, but because the reporter and quenchers are on separate molecules, they yield greater signal intensity because the reporter and quencher can separate completely.
Sunrise™ primers. Created by Oncor (Gaithersburg, MD, USA), Sunrise primers are similar to scorpions in that they combine both the PCR primer and detection mechanism in the same molecule (Figure 3F) (60). These probes consist of a dual-labeled
(reporter and quencher fluorophores) hairpin loop on the 5′ end, with the 3′
end acting as the PCR primer. When unbound, the hairpin is intact, causing reporter quenching via FRET. Upon integration into the newly formed PCR product, the reporter and quencher are held far enough apart to allow reporter emission.
LUX™ fluorogenic primers. Light upon extension (LUX) primers (Invitrogen, Carlsbad, CA, USA) are self-quenched single-fluorophore labeled primers almost identical to Sunrise primers (Figure 3G). However, rather than using a quencher fluoro-phore, the secondary structure of the 3′ end reduces initial fluorescence to a minimal amount (61). Because this chemistry does not require a quencher dye, it is much less expensive than dual-labeled probes. While this system relies on only two oligonucleotides for specificity, unlike the SYBR Green I platform in which a dissociation curve is used to detect erroneous amplifi-cation, no such convenient detection exists for the LUX platform. Agarose gels must be run to ensure the presence of a single PCR product, a step that is extremely important not only for the LUX primers but also for the Sunrise primers and scorpions because PCR priming and probe binding are not independent in these chemistries. Causes of Variation
In theory, PCR is quite robust and predictable, but in actuality, minor variations in reaction components, thermal cycling conditions, and mispriming events during the early stages of the reaction can lead to large changes in the overall amount of amplified product (11,62). Due to the high sensitivity of the real-time PCR assay and the numerous steps that may introduce experimental error, awareness of the causes of variation help produce the most accurate data possible.
Whether using a one- or two-step process, cDNA synthesis can greatly affect the overall real-time PCR results. Both reverse transcriptase enzyme and dithiothreitol (DTT) are PCR inhibitors that may affect reaction kinetics in a one-step process or when carried over during a two-step reaction (18,46). In addition, many samples from complex
biological sources often have other PCR inhibitors that may be carried over during sample preparation (63). Inhibitor carryover can be avoided using a cDNA precipitation protocol (18), while DTT may be omitted from the reaction (24).
The oligonucleotides used for reverse transcription priming affect overall cDNA levels. Gene-specific primers yield the most efficient reaction, oligo(dT) primers have an intermediate efficiency, and random hexamers are the least efficient (46). Gene-specific priming is often not ideal because one cannot assay both a target and a normalization gene from the same cDNA template, while with oligo(dT) priming, one may not effec-tively transcribe the 5′ end of long transcripts. The use of random and specific hexamers has been reported to overestimate mRNA copy number up to 19-fold and 4-fold, respec-tively, in comparison to 22-mer gene-specific primers (64). Consequently, one solution is to use a mixture of both oligo(dT) and random hexamer primers during the reverse transcription reaction.
The structure and concentration of the RNA template and the reverse transcriptase enzyme itself are other sources of variation during cDNA synthesis. RNA secondary structure and protein complexes present on the target RNA can interfere with the reaction by causing enzyme pausing, dissociation, or skipping over looped regions (18). Raising reaction temperature above 47°C may minimize this problem (65). Different reverse transcriptase enzymes have differing abilities to read through secondary structure (66). For example, SuperScript™ RT II (Invitrogen) has greater efficiency and accuracy than Sensiscript® (Qiagen, Valencia, CA,
USA) (34).
As mentioned in the Normalization section, the biological sample itself is often a source of much variation. In cases where whole tissue is assayed, measuring several different cell types within a single sample yields an average expression value of the different cell types. Techniques such as laser-capture microdissection (LCM) may be utilized to extract a pure subpopulation of cells from a heterogeneous source (67).
incurred from several sources including assay design, PCR reagents, PCR equipment, and human error. Assay design, particularly primer stability and specificity as well as PCR product size, is crucial for an accurate result because amplification efficiency can greatly affect overall results (22). When using a block thermal cycler versus capillary tubes, it is important to measure any positional effects because slight varia-tions in temperature when measuring fluorescence can lead to a variation in the amount detected, especially when using a DNA binding dye. If a service contract is used to maintain the real-time PCR machine, these effects are usually monitored as part of the routine maintenance. Variation in annealing temperature can also affect the enzymatic ability of the polymerase, primer binding, and formation or melting of secondary structure, etc., all which have compounding effects on the overall PCR.
Variation can occur from the PCR reagents even when using premade master mixes from the same manufac-turer. Bustin (34) reported a significant Ct value difference from a single template assayed with two different batches of the TaqMan EZ RT-PCR system (a one enzyme/tube system; Applied Biosystems) master mix that translated into a 2.5-fold difference in median mRNA copy number. Different probe lots synthesized within 6 months of each other also generated significant differences in Ct value, resulting in a 7-fold difference in mRNA copy number (34). Probes manufactured from different sources vary in stability. Bustin (34) reported that Applied Biosystems produces the most stable probes.
Nevertheless, the most likely source of variation is the person performing the experiment (34). Three different people used the same micropipets, master mix, laboratory, template, and machine (ABI Prism 7700; Applied Biosystems) to quantitate the same target and found initial copy numbers ranging from 8.7 × 10⁵ to 2.7 × 10³. Even the most careful
pipeting technique may have a 1% relative error. With a 10-fold dilution, this original error will result in a 1% error in amplification efficiency (30). Consequently, precision pipeting and
pipet calibration are also essential for preventing cumulative error. Running a standard curve during every reaction can help alleviate this issue because the standard will be affected to the same extent as the unknowns. Using the same batch of enzymes, buffers, master mixes, pipets, and especially the same person will all help reduce experi-mental variability.
Calculating Variation
Because experimental variation is unavoidable, it is important to validate assay results by measuring intra- and inter-assay variation. Variation should not be calculated using Ct values because these are logarithmic units and will misrepresent true variability (8). Therefore, data used for calculation must be a linear value (such as copy number) to obtain accurate measure-ments of coefficients of variation.
Intra-assay variation quantifies the amount of error seen within a single assay when the same template is run multiple times on the same plate with the same reagents. Intra-assay variation can be calculated for every single sample of every reaction if the real-time PCR experiments are performed in triplicate, with a pooled variance for all sets of PCR triplicates representing statistical power (41). This variation is thought to be both primer and template dependent, with lower concentra-tions of starting template tending to have higher intra-assay variability. PCR reproducibility is influenced by distribution statistics and stochastic effects (Poisson’s Law; Reference 25). However, several reports have found no correlation between initial template copy number and overall variability (7).
Inter-assay variation should be quantified in cases where compar-isons are made of results from two separate assays run on either the same or different days. Variation can be measured by running the same sample on every plate used during a single experiment. This calculation may often be performed using data from either a calibrator or standard sample because these are often already included on all plates.
CONCLUSION
Given the number of choices available for every aspect of real-time PCR, it may be difficult to determine what detection chemistry, quanti-tation method, normalization gene, etc., to use. Although every experi-mental situation is unique and requires specialized consideration, some general guidelines can be suggested. In terms of quantitation method (absolute versus relative), the majority of users will not require absolute data such as copy number of transcripts or nanograms of DNA, and therefore, relative quanti-tation will suffice. As discussed, there are many mathematical models available for relative quantitation. Larger projects would benefit greatly by using a method with an associated Excel worksheet such as Pfaffl (26), Q-Gene (23), or DART-PCR (30). While amplification efficiency may be more efficiently calculated from raw fluores-cence data instead of a standard curve, using a set of serial dilutions is recom-mended not only to check the dynamic range of the assay but also to ensure the accuracy of the quantitation. In addition, inclusion of a standard curve would allow results to be calculated using any of the relative quantitation methods available.
The choice of detection chemistry is highly dependent on the characteristics of an individual experiment. During the validation of microarray results, which tends to have only a few samples and several target genes, it is reasonable to use a DNA binding dye. However, in situations where it may be difficult to design a specific PCR (perhaps due to the presence of processed pseudo-genes), a sequence-specific probe-based method would have increased reaction specificity. Of the many probe-based techniques available, a well-established system such as the hybridization TaqMan probes may be the best choice. This system has very well-written guidelines and protocols and is fairly error-proof when designed and run according to protocol.
In terms of normalization, the use of multiple housekeeping genes is the most accurate method. Nevertheless, when one has only a few genes to assay or a sample set with low diversity (such
as cell culture), it may not be feasible to run multiple housekeeping genes. If a single gene is used, its stability should be validated in an assay similar to the one used to rank gene stability in geNorm.
Because real-time PCR is now a common method for measuring gene expression, it is increasingly important for users to be aware of the numerous choices available in all aspects of this technology. Unlike traditional PCR, there are many complexities with real-time PCR that can affect overall results. However, with a well-designed experiment performed with the proper controls, real-time PCR can be one of the most sensitive, efficient, fast, and reproducible methods of measuring gene expression.
ACKNOWLEDGMENTS
We thank Bob Rice for his comments on the initial manuscript and the anony-mous reviewers, whose comments sig-nificantly improved this manuscript. The authors acknowledge the support of the National Institutes of Health (NIH T32-GM08799-01) Training Program in Biomolecular Technology to M.L.W. and the support of the U.S. Department of Agriculture (USDA) Initiative for Future Agriculture and Food Systems (IFAFS) grant no. 2001-52100-11211 to J.F.M.
COMPETING INTERESTS STATEMENT
The authors declare no competing interests.
REFERENCES
1.Higuchi, R., C. Fockler, G. Dollinger, and R. Watson. 1993. Kinetic PCR analysis: real-time monitoring of DNA amplification reac-tions. Biotechnology (NY) 11:1026-1030. 2.Heid, C.A., J. Stevens, K.J. Livak, and P.M.
Williams. 1996. Real time quantitative PCR. Genome Res. 6:986-994.
3.Morrison, T.B., J.J. Weis, and C.T. Wittwer.
1998. Quantification of low-copy transcripts by continuous SYBR Green I monitoring during amplification. BioTechniques 24 :954-962.
4.Wang, T. and M.J. Brown. 1999. mRNA quantification by real time TaqMan poly-merase chain reaction: validation and
compar-ison with RNase protection. Anal. Biochem. 269:198-201.
5.Malinen, E., A. Kassinen, T. Rinttila, and A. Palva. 2003. Comparison of real-time PCR with SYBR Green I or 5′-nuclease assays and dot-blot hybridization with rDNA-targeted oligonucleotide probes in quantification of se-lected faecal bacteria. Microbiology 149 :269-277.
6.Palmer, S., A.P. Wiegand, F. Maldarelli, H. Bazmi, J.M. Mican, M. Polis, R.L. Dewar, A. Planta. 2003. New real-time reverse tran-scriptase-initiated PCR assay with single-copy sensitivity for human immunodeficiency virus type 1 RNA in plasma. J. Clin. Microbiol. 41:4531-4536.
7.Gentle, A., F. Anastasopoulos, and N.A. Mc-Brien. 2001. High-resolution semi-quantita-tive real-time PCR without the use of a stan-dard curve. BioTechniques 31:502-508. 8.Schmittgen, T.D., B.A. Zakrajsek, A.G.
Mills, V. Gorn, M.J. Singer, and M.W. Reed.
2000. Quantitative reverse transcription-poly-merase chain reaction to study mRNA decay: comparison of endpoint and real-time meth-ods. Anal. Biochem. 285:194-204.
9.Tichopad, A., M. Dilger, G. Schwarz, and M.W. Pfaffl. 2003. Standardized determina-tion of real-time PCR efficiency from a single reaction set-up. Nucleic Acids Res. 31:e122. 10.von Ahsen, N., E. Schutz, V.W. Armstrong,
and M. Oellerich. 1999. Rapid detection of prothrombotic mutations of prothrombin (G20210A), factor V (G1691A), and methy-lenetetrahydrofolate reductase (C677T) by real-time fluorescence PCR with the LightCy-cler. Clin. Chem. 45:694-696.
11.Bustin, S.A. 2000. Absolute quantification of mRNA using real-time reverse transcription polymerase chain reaction assays. J. Mol. En-docrinol. 25:169-193.
12.Battaglia, M., P. Pedrazzoli, B. Palermo, A. Lanza, F. Bertolini, N. Gibelli, G.A. Da Prada, A. Zambelli, et al. 1998. Epithelial tumour cell detection and the unsolved prob-lems of nested RT-PCR: a new sensitive one step method without false positive results. Bone Marrow Transplant. 22:693-698. 13.Mannhalter, C., D. Koizar, and G.
Mitter-bauer. 2000. Evaluation of RNA isolation methods and reference genes for RT-PCR analyses of rare target RNA. Clin. Chem. Lab. Med. 38:171-177.
14.Vandesompele, J., A. De Paepe, and F. Speleman. 2002. Elimination of primer-dimer artifacts and genomic coamplification using a two-step SYBR green I real-time RT-PCR. Anal. Biochem. 303:95-98.
15.Souaze, F., A. Ntodou-Thome, C.Y. Tran, W. Rostene, and P. Forgez. 1996. Quantita-tive RT-PCR: limits and accuracy. BioTech-niques 21:280-285.
16.Fronhoffs, S., G. Totzke, S. Stier, N. Wer-nert, M. Rothe, T. Bruning, B. Koch, A. Sachinidis, et al. 2002. A method for the rapid construction of cRNA standard curves in quantitative real-time reverse transcription polymerase chain reaction. Mol. Cell Probes 16:99-110.
17.Gerard, C.J., K. Olsson, R. Ramanathan, C. Reading, and E.G. Hanania. 1998. Im-proved quantitation of minimal residual
dis-ease in multiple myeloma using real-time polymerase chain reaction and plasmid-DNA complementarity determining region III stan-dards. Cancer Res. 58:3957-3964.
18.Liss, B. 2002. Improved quantitative real-time RT-PCR for expression profiling of individual cells. Nucleic Acids Res. 30:e89.
19.Pfaffl, M.W., A. Tichopad, C. Prgomet, and T.P. Neuvians. 2004. Determination of stable housekeeping genes, differentially regulated target genes and sample integrity: BestKeep-er-Excel-based tool using pair-wise correla-tions. Biotechnol. Lett. 26:509-515.
20.Giulietti, A., L. Overbergh, D. Valckx, B. Decallonne, R. Bouillon, and C. Mathieu.
2001. An overview of real-time quantitative PCR: applications to quantify cytokine gene expression. Methods 25:386-401.
21.Livak, K.J. and T.D. Schmittgen. 2001. Analysis of relative gene expression data us-ing real-time quantitative PCR and the 2(-Del-ta Del2(-Del-ta C(T)) method. Methods 25:402-408. 22.Liu, W. and D.A. Saint. 2002. A new
quan-titative method of real time reverse transcrip-tion polymerase chain reactranscrip-tion assay based on simulation of polymerase chain reaction kinetics. Anal. Biochem. 302:52-59. 23.Muller, P.Y., H. Janovjak, A.R. Miserez,
and Z. Dobbie. 2002. Processing of gene ex-pression data generated by quantitative real-time RT-PCR. BioTechniques 32:1372-1379. 24.Gibson, U.E., C.A. Heid, and P.M. Williams.
1996. A novel method for real time quantita-tive RT-PCR. Genome Res. 6:995-1001. 25.Marino, J.H., P. Cook, and K.S. Miller.
2003. Accurate and statistically verified quan-tification of relative mRNA abundances using SYBR Green I and real-time RT-PCR. J. Im-munol. Methods 283:291-306.
26.Pfaffl, M.W. 2001. A new mathematical mod-el for rmod-elative quantification in real-time RT-PCR. Nucleic Acids Res. 29:e45.
27.Rasmussen, R.P. 2001. Quantification on the LightCycler, p. 21-34. In S. Meuer, C.T. Wittwer, and K. Nakagawara (Eds.), Rapid Cycle Real-time PCR, Methods and Applica-tions. Springer Press, Heidelberg.
28.Liu, W. and D.A. Saint. 2002. Validation of a quantitative method for real time PCR kinetics. Biochem. Biophys. Res. Commun. 294:347-353.
29.Freeman, W.M., S.J. Walker, and K.E. Vrana. 1999. Quantitative RT-PCR: pitfalls and potential. BioTechniques 26:112-115. 30.Peirson, S.N., J.N. Butler, and R.G. Foster.
2003. Experimental validation of novel and conventional approaches to quantitative real-time PCR data analysis. Nucleic Acids Res. 31:e73.
31.Livak, K. 1997. ABI Prism 7700 Sequence Detection System, User Bulletin 2. PE Ap-plied Biosystems, Foster City, CA.
32.Medhurst, A.D., D.C. Harrison, S.J. Read, C.A. Campbell, M.J. Robbins, and M.N. Pangalos. 2000. The use of TaqMan RT-PCR assays for semiquantitative analysis of gene expression in CNS tissues and disease mod-els. J. Neurosci. Methods 98:9-20.
33.Pfaffl, M.W., G.W. Horgan, and L. Demp-fle. 2002. Relative expression software tool (REST) for group-wise comparison and statis-tical analysis of relative expression results in
real-time PCR. Nucleic Acids Res. 30:e36. 34.Bustin, S.A. 2002. Quantification of mRNA
using real-time reverse transcription PCR (RT-PCR): trends and problems. J. Mol. En-docrinol. 29:23-39.
35.Vandesompele, J., K. De Preter, F. Pattyn, B. Poppe, N. Van Roy, A. De Paepe, and F. Speleman. 2002. Accurate normalization of real-time quantitative RT-PCR data by geo-metric averaging of multiple internal control genes. Genome Biol. 3:RESEARCH0034. 36.Schmittgen, T.D. and B.A. Zakrajsek. 2000.
Effect of experimental treatment on house-keeping gene expression: validation by real-time, quantitative RT-PCR. J. Biochem. Bio-phys. Methods 46:69-81.
37.Banerjee, S., S. An, and S. Makino. 2001. Specific cleavage of 28S ribosomal RNA in murine coronavirus-infected cells. Adv. Exp. Med. Biol. 494:621-626.
38.Spanakis, E. 1993. Problems related to the interpretation of autoradiographic data on gene expression using common constitutive transcripts as controls. Nucleic Acids Res. 21:3809-3819.
39.Barbu, V. and F. Dautry. 1989. Northern blot normalization with a 28S rRNA oligonucle-otide probe. Nucleic Acids Res. 17:7115. 40.Tricarico, C., P. Pinzani, S. Bianchi, M.
Paglierani, V. Distante, M. Pazzagli, S.A. Bustin, and C. Orlando. 2002. Quantitative real-time reverse transcription polymerase chain reaction: normalization to rRNA or single housekeeping genes is inappropriate for human tissue biopsies. Anal. Biochem. 309:293-300.
40a.Technical Bulletin #151. Use of Internal and External Standards or Reference RNAs for Accurate Quantitation of RNA Levels. Ambion, Austin, TX, USA.
41.Ginzinger, D.G., T.E. Godfrey, J. Nigro, D.H. Moore, 2nd, S. Suzuki, M.G. Pal-lavicini, J.W. Gray, and R.H. Jensen. 2000. Measurement of DNA copy number at micro-satellite loci using quantitative PCR analysis. Cancer Res. 60:5405-5409.
42.Hamalainen, H.K., J.C. Tubman, S. Vik-man, T. Kyrola, E. Ylikoski, J.A. War-rington, and R. Lahesmaa. 2001. Identifica-tion and validaIdentifica-tion of endogenous reference genes for expression profiling of T helper cell differentiation by quantitative real-time RT-PCR. Anal. Biochem. 299:63-70.
43.Wittwer, C.T., M.G. Herrmann, A.A. Moss, and R.P. Rasmussen. 1997. Continuous fluo-rescence monitoring of rapid cycle DNA am-plification. BioTechniques 22:130-138. 44.Simpson, D.A., S. Feeney, C. Boyle, and
A.W. Stitt. 2000. Retinal VEGF mRNA mea-sured by SYBR green I fluorescence: A ver-satile approach to quantitative PCR. Mol. Vis. 6:178-183.
45.Ririe, K.M., R.P. Rasmussen, and C.T. Wittwer. 1997. Product differentiation by analysis of DNA melting curves during the polymerase chain reaction. Anal. Biochem. 245:154-160.
46.Lekanne Deprez, R.H., A.C. Fijnvandraat, J.M. Ruijter, and A.F. Moorman. 2002. Sensitivity and accuracy of quantitative real-time polymerase chain reaction using SYBR green I depends on cDNA synthesis
condi-tions. Anal. Biochem. 307:63-69.
47.Ramos-Payan, R., M. Aguilar-Medina, S. Estrada-Parra, Y.M.J.A. Gonzalez, L. Fa-vila-Castillo, A. Monroy-Ostria, and I.C. Estrada-Garcia. 2003. Quantification of cy-tokine gene expression using an economical real-time polymerase chain reaction method based on SYBR Green I. Scand. J. Immunol. 57:439-445.
48.Bernard, P.S. and C.T. Wittwer. 2000. Ho-mogeneous amplification and variant detec-tion by fluorescent hybridizadetec-tion probes. Clin. Chem. 46:147-148.
49.Bernard, P.S., R.S. Ajioka, J.P. Kushner, and C.T. Wittwer. 1998. Homogeneous mul-tiplex genotyping of hemochromatosis muta-tions with fluorescent hybridization probes. Am. J. Pathol. 153:1055-1061.
50.Lay, M.J. and C.T. Wittwer. 1997. Real-time fluorescence genotyping of factor V Leiden during rapid-cycle PCR. Clin. Chem. 43:2262-2267.
51.Clegg, R.M. 1992. Fluorescence resonance energy transfer and nucleic acids. Methods Enzymol. 211:353-388.
52.Kutyavin, I.V., I.A. Afonina, A. Mills, V.V. Gorn, E.A. Lukhtanov, E.S. Belousov, M.J. Singer, D.K. Walburger, et al. 2000. 3′- Minor groove binder-DNA probes increase sequence specificity at PCR extension tem-peratures. Nucleic Acids Res. 28:655-661. 53.Tyagi, S. and F.R. Kramer. 1996. Molecular
beacons: probes that fluoresce upon hybrid-ization. Nat. Biotechnol. 14:303-308. 54.Bonnet, G., S. Tyagi, A. Libchaber, and
F.R. Kramer. 1999. Thermodynamic basis of the enhanced specificity of structured DNA probes. Proc. Natl. Acad. Sci. USA 96 :6171-6176.
55.Marras, S.A., F.R. Kramer, and S. Tyagi.
1999. Multiplex detection of single-nucleotide variations using molecular beacons. Genet. Anal. 14:151-156.
56.Tyagi, S., S.A. Marras, and F.R. Kramer.
2000. Wavelength-shifting molecular beacons. Nat. Biotechnol. 18:1191-1196.
57.Whitcombe, D., J. Theaker, S.P. Guy, T. Brown, and S. Little. 1999. Detection of PCR products using self-probing amplicons and fluorescence. Nat. Biotechnol. 17 :804-807.
58.Thelwell, N., S. Millington, A. Solinas, J. Booth, and T. Brown. 2000. Mode of action and application of Scorpion primers to muta-tion detecmuta-tion. Nucleic Acids Res. 28 :3752-3761.
59.Solinas, A., L.J. Brown, C. McKeen, J.M. Mellor, J. Nicol, N. Thelwell, and T. Brown.
2001. Duplex Scorpion primers in SNP analy-sis and FRET applications. Nucleic Acids Res. 29:E96.
60.Nazarenko, I.A., S.K. Bhatnagar, and R.J. Hohman. 1997. A closed tube format for am-plification and detection of DNA based on energy transfer. Nucleic Acids Res. 25 :2516-2521.
61.Nazarenko, I., B. Lowe, M. Darfler, P. Ikonomi, D. Schuster, and A. Rashtchian.
2002. Multiplex quantitative PCR using self-quenched primers labeled with a single fluo-rophore. Nucleic Acids Res. 30:e37. 62.Wu, D.Y., L. Ugozzoli, B.K. Pal, J. Qian,
and R.B. Wallace. 1991. The effect of tem-perature and oligonucleotide primer length on the specificity and efficiency of amplification by the polymerase chain reaction. DNA Cell Biol. 10:233-238.
63.Tichopad, A., A. Didier, and M.W. Pfaffl.
2004. Inhibition of real-time RT-PCR quan-tification due to tissue-specific contaminants. Mol. Cell Probes 18:45-50.
64.Zhang, J. and C.D. Byrne. 1999. Differen-tial priming of RNA templates during cDNA synthesis markedly affects both accuracy and reproducibility of quantitative competitive re-verse-transcriptase PCR. Biochem. J. 337(Pt 2):231-241.
65.Shimomaye, E. and M. Salvato. 1989. Use of avian myeloblastosis virus reverse transcrip-tase at high temperature for sequence analysis of highly structured RNA. Gene Anal. Tech. 6:25-28.
66.Brooks, E.M., L.G. Sheflin, and S.W. Spaulding. 1995. Secondary structure in the 3′ UTR of EGF and the choice of reverse transcriptases affect the detection of message diversity by RT-PCR. BioTechniques 19 :806-815.
67.Walch, S.J., K. Specht, J. Smida, M. Aubele, H. Zitzelsberger, H. Hofler, and M. Wer-ner. 2001. Tissue microdissection techniques in quantitative genome and gene expression analyses. Histochem. Cell Biol. 115:269-276.
Address correspondence to:
Juan F. Medrano
Department of Animal Science University of California, Davis One Shields Avenue
Davis, CA 95616-8521, USA e-mail: jfmedrano@ucdavis.edu
To purchase reprints of this article, contact