W A S T H E R E A ' M E D I E V A L W A R M P E R I O D ' , A N D IF S O , W H E R E A N D W H E N ?
M A L C O L M K . H U G H E S
Laboratory of Tree Ring Research, University of Arizona, Tucson, AZ 85721 (address for correspondence), and Cooperative Institute for Research in Environmental Science, University of Colorado, Boulder, CO 80309, U.S.A.
and
H E N R Y F. D I A Z
NOAA/ERL/CDC, 325 Broadway, Boulder, CO 80303, U.S.A.
Abstract. It has frequently been suggested that the period encompassing the ninth to the fourteenth centuries A.D. experienced a climate warmer than that prevailing around the turn of the twentieth century. This epoch has become known as the Medieval Warm Period, since it coincides with the Middle Ages in Europe. In this review a number of lines of evidence are considered, (including climate- sensitive tree rings, documentary sources, and montane glaciers) in order to evaluate whether it is reasonable to conclude that climate in medieval times was, indeed, warmer than the climate of more recent times. Our review indicates that for some areas of the globe (for example, Scandinavia, China, the Sierra Nevada in California, the Canadian Rockies and Tasmania), temperatures, particularly in summer, appear to have been higher during some parts of this period than those that were to prevail until the most recent decades of the twentieth century. These warmer regional episodes were not strongly synchronous. Evidence from other regions (for example, the Southeast United States, southern Europe along the Mediterranean, and parts of South America) indicates that the climate during that time was little different to that of later times, or that warming, if it occurred, was recorded at a later time than has been assumed. Taken together, the available evidence does not support a global Medieval Warm Period, although more support for such a phenomenon could be drawn from high-elevation records than from low-elevation records.
The available data exhibit significant decadal to century scale variability through- out the last millennium. A comparison of 30-year averages for various climate indices places recent decades in a longer term perspective.
1. Introduction
"A thousand years ago, climate in the North Atlantic regions was perhaps 1 °C warmer than n o w . . . " (U.S. Dept. of Energy, 1989)
The spread of Norse seafarers and the establishment of colonies around the northern North Atlantic from Greenland to Newfoundland from about the close of the ninth Century A.D. has been taken as proof that the climate of this region was probably warmer than today. H. H. Lamb noted that in most areas of the world for which climatic conditions can be inferred, they seemed to have enjoyed, "a renewal of warmth, which at times [during the eleventh and twelfth centuries] may have
110 Malcolm K. Hughes and Henry E Diaz
approached the level of the warmest millenium of post-glacial times." (Lamb, 1982, p. 162). The purpose of this special volume is to consider some of the available evidence for a warmer climate in different parts of the world during the time which has come to be known as the Medieval Warm Period (also referred to as the Little Climatic Optimum and Medieval Warm Epoch), namely from about the ninth to the fourteenth centuries A.D. Indeed, a major goal of our efforts has been directed to answering the question posed in the title of this review paper: was there a Medieval Warm Period (MWP), and if so, where and when?
As will be shown in the following sections, there is some evidence, including some recent studies based on tree-ring growth, that supports the occurrence of a warmer climate in the centuries preceding the start of the European Renaissance. The evidence comes primarily from three sources: growing season temperature re- constructed from tree rings (e. g. Cook et al., 1991, 1992; Graumlich, 1993; Villalba et al., 1990), inferred higher alpine glacier snow lines or glacier fronts (Grove and Switsur, this volume; Luckman, this volume), and from a variety of historical and phenological records which indicate the existence of a warmer climate compared to today's (Lamb, 1982; Zhang, this volume). Such periods of anomalously warm seasonal temperatures are only rarely synchronous between regions. A similarly diverse body of evidence indicates nothing exceptional taking place during this time in different parts of the world. For example, tree-ring evidence from the northern Urals (Graybill and Shiyatov, 1992) indicates only slightly higher sum- mer temperatures in the first few centuries of this millennium. Evidence presented by Stahle and Cleaveland (this volume), also suggests that spring precipitation in the Southeast United States was not exceptional during either the ninth through fourteenth centuries, or during the 'Little Ice Age' (LIA) in the centuries that fol- lowed. Questions have been raised (for example, Alexandre, 1987; Ingram et aL, 1978; Ogilvie, 1991) regarding the reliability and representativeness of a signif- icant portion of the historically-derived information which has been relied upon to infer climatic conditions for the North Atlantic-Western Europe region during the ninth through fourteenth centuries. Given these uncertainties, it seemed to us worthwhile to evaluate critically as much evidence as possible regarding the nature of climatic conditions during this period. One of the core projects of the Inter- national Geosphere Biosphere Program (IGBP, 1990) concerns the delineation of significant climatic and environmental changes that have occurred over the past 20,000 years, with particular emphasis on climatic variations during the last 2,000 years. The IGBP Core Project, referred to by the acronym PAGES, identified the so-called Medieval Warm Period as a focus for the detailed reconstruction of cli- matic parameters in comparison with present-day values. As an initial contribution to the process of evaluation and scholarly research focused on these goals, the authors convened a workshop to review critically the physical evidence for the existence of a significant climatic episode between the ninth to fourteenth cen- turies A.D., the time interval typically associated with the Medieval Warm Period. The meeting was held in Tucson, Arizona on November 5-8, 1991 with support
Was there a "Medieval Warm Period' ? 111
from the National Oceanic and Atmospheric Administration (NOAA), the U.S. Department of Energy and the National Science Foundation. It provided an oppor- tunity for interdisciplinary exchanges of information, and a forum to discuss and evaluate the scientific evidence from different sources and from different parts of the world regarding estimates of climatic differences in surface temperature and precipitation compared to twentieth century values. In the following sections, we give an overview of the physical, biological and historical evidence on the climate of the ninth through fourteenth centuries A.D.. The twelve original contributions, drawn from the Tucson workshop, that comprise this special volmne of Climatic C h a n g e provide a diverse view of how different elements of the earth's climate have behaved in the last thousand years.
Clearly, improving our knowledge and understanding of past climate regimes, such as the 9th through fourteenth centuries A.D., may prove useful as potential predictors or analogues of future climatic patterns forced by increasing atmospheric greenhouse gas concentrations. We realize that a successful approach will require, inter alia, the participation of many experts in paleoclimatic reconstruction, and the generation of a variety of paleoenvironmental data. Together with modeling efforts to ascertain plausible sources of external or internal climate forcing mechanisms, such work will be crucial to assessing the validity and reliability of individual records and regional climate scenarios. It is our hope that this volume will serve as a catalyst to encourage further research on the reconstruction of the climate of this particular period, and to further our knowledge of natural climatic variations, whose understanding will be critical to the assessment of past, present, and future climatic changes.
2. The Medieval Warm Period
Several lines of evidence seem to suggest that much of northern Europe, the North Atlantic, southern Greenland and Iceland experienced a prolonged interval of warmth from about the tenth to thirteenth centuries A.D. exceeding conditions which prevailed during the early part of the twentieth century (Lamb, 1977, 1982). As this epoch belongs historically to Europe's so-called 'Middle Ages', the term, 'Medieval Warm Period' has come to be used to refer to the climate of this time. It may be noted that 'epoch', 'maximum', and 'Little Climatic Optimum' are terms also used to refer to this time interval. Nonetheless, contrary to the impression that the designation 'Medieval Warm Period' might give, there is much evidence of regional and seasonal inconsistency in climate in the ninth through fourteenth centuries. For example, Atexandre (1987) has carefully reviewed much of the evidence cited for inferring that northern Europe experienced a prolonged warm episode during that time. He concluded that the climate of southern Emope, i.e., the Mediterranean region, behaved quite differently from that of northern Europe, such that no exceptional winter warmth is evident in the available records for southern Europe until the mid-fourteenth century. On the other hand, Alexandre notes the
112 Malcolm K. Hughes and Henry E Diaz
predominance of warm springs and dry summers in western Europe throughout most of the thirteenth century (from A.D. 1220-1310). This is consistent with a phase of retreat of alpine glaciers around that time (see Grove and Switsur, this volume). The combination of cold springs and wet summers coupled with humid winters in the mid-fourteenth century could have favored glacial advances at that time.
Evidence presented in this volume indicates that the pattern of regional differ- ences in the character of climatic anomalies during the ninth through fourteenth centuries, indeed shows spatial differentiation, in much the same way as the Little Ice Age (LIA), of the sixteenth to nineteenth centuries, does (Jones and Bradley, 1992). The papers by Luckman and Petersen (this volume) provide evidence to suggest that climatic conditions in the tenth to thirteenth centuries A.D. may have favored glacial retreat and forest advances to higher elevations in the Canadian Rockies, and possibly an improved crop growing environment in the U.S. South- west around that time. Davis (this volume) reports evidence for greater lake depth or fresher water between A.D. 700 and 1350 in the region affected by the Arizona Monsoon, and points out that such an intensification of the monsoon could be con- sistent with higher solar receipts inferred from a radiocarbon minimum (Jirikovic and Damon, this volume). The study by Zhang (this volume) indicates a northward shift of phenological boundaries in China late in the period. On the other hand, the study by Stahle and Cleveland detailing a reconstruction of spring precipitation in the Southeast United States, fails to show any pronounced period (greater than 20 years) of either drought or wet spells in the ninth through fourteenth centuries. For that matter, the LIA also does not contain anomalous precipitation intervals longer than about two or three decades.
What kind of time scale might be characteristic of climatic events within a longer climatic epoch (spanning, say, a few centuries in length), such that it could be considered to differ, climatologically, from times immediately following and preceding it? To address this question we consider two types of evidence: the instrumental record of surface temperature in the Northern Hemisphere land areas (Jones et al., 1986), and a suite of proxy temperature records derived primarily from tree-ring reconstruction of growing season temperature. We will discuss the development of the tree-ring temperature reconstructions in more detail in the next section.
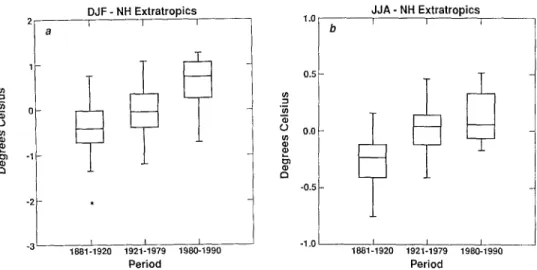
Figures 1 and 2 show plots of the distribution of area-weighted winter (December-February) and summer (June-August) temperature anomalies for ex- tratropical latitudes in the Northern Hemisphere (land areas poleward of 30 ° N) and tropics (equator to 25 ° N) for three time intervals - 1881-1920 (characteristic of the colder climate prevailing at the turn of the twentieth century), 1921-1979 (an intermediate milder period), and the recent warm decade of the 1980s. The graphs illustrate different spatial and temporal shifts in the median (and mean) value. For example, during summer extratropical latitudes warmed up the most from about 1900 to 1950, less so in the 1980s (Figure lb). At higher latitudes in
Was there a "Medieval Warm Period' ? 113
0 u~
t, b3 Q
-11
DJF - NH Extratropics
1 I I 1 . 0
0.5
o~
m
C.~ 0.0
t33 a
- 0 , 5
J J A - NH Extratropics
I I t
I I I -1.0 I I I
18B1-1920 1921-1979 1980-1990 1881-1920 1921-1979 1980-1990
Period Period
Fig. 1 Box and Whisker diagrams showing the distribution of land surface temperature anomalies (referenced to 1951-70) for the Northern Hemisphere extratropics (30 to 70 ° N) during three time intervals - 1 8 8 1 - 1 9 2 0 , 1 9 2 1 - 1 9 7 9 , and 1 9 8 0 - 1 9 9 0 : (a) Winter (December-February); (b) Summer (June-August).
0
O u~
E3 -1
DJF - NH Tropics J J A - NH Tropics
I I
I 1881-1920
Fig. 2.
1.01 b
0.~
0 0.0 .o
121 -0.5
I I I
I I -1,0 I t h
1921-1979 1980-1990 1881-1920 1921-1979 1980-1990
Period Period
Same as Figure 1, but for the Northern Hemisphere tropics (0 to 25 ° N).
winter (Figure la) and tropical latitudes during summer (Figure 2b) warming in the 1980s occurred at a much greater rate than during the first half of this century. Summer warming at the higher latitudes (Figure lb) was much greater between the first and second period than during the 1980s.
There is no reason to believe that a similar heterogeneity of climatic signals (different rates of change according to season, latitude or region) was absent in the ninth through fourteenth centuries. Jones and Bradley (1992) make a similar point with regard to climatic variations since A.D. 1500. Diaz and Bradley (in press) also point out that the great variety of climatic signals and the inherent noise in the
114 Malcolm K. Hughes and Henry E Diaz
system (i.e., 'natural variability') makes it difficult to determine the presence of widespread climatic shifts on decade-to-century time scales. Below, we evaluate a range of the available records upon which characterizations of climate from the ninth to fourteenth centuries are based.
3. Tree-Ring Evidence
3.1. Strengths and Limitations
An optimum paleoenvironmental record of climate over the last thousand years or more would have the following six characteristics:
1. it would be continuous through the whole millennium and preferably longer, with dating good to the calendar year;
2. well understood spatial applicability;
3. a strong and well-defined climate signal of known seasonal applicability; 4. a temporal resolution of one year or better;
5. time-invariance in strength and nature of climate signals; and
6. be capable of recording century-scale as well as interannual and decadal scale fluctuations.
In addition, the optimum type of record would not be unique to one location, but rather would have a sufficiently widespread geographical distribution to cap- ture large scale fluctuations consistently over a large region. This is of particular importance given the possibility that spatial representativeness may be frequency- dependent.
The primary focus here will be on statistically calibrated and verified recon- structions of climate from tree rings. There are a number of published tree-ring based reconstructions of climate in the last millennium with all or most of these characteristics. While the available reconstructions are drawn from a wide range of locations, none are at low latitude and there are far too few for them to be represen- tative of any large region of the Earth. Given the information presented in Figures 1 and 2, this last observation has important implications regarding generalizations of individual (regional) climate signals to much larger scales.
Earlier examinations of the climate of the last millennium used tree-ring chro- nologies from which climate fluctuations were inferred, some after careful consid- eration of the processes limiting tree growth (e.g., LaMarche, 1974) and several apparently without any such analysis (e.g., Lamb, 1977; Ladurie, 1971; Bryson and Julian, 1962). Given the recent growth in availability of statistically calibrated and verified reconstructions in the literature there is neither merit in the use of uncalibrated time series, nor is there any need to continue this practice except in very limited circumstances. Thousand year or longer calibrated and verified recon- structions of seasonal or annual temperature are available for the Polar Urals (POL) (Graybill and Shiyatov, 1989), northern Fennoscandia (FEN) (Briffa et al., 1992), northern Italy (Serre-Bachet, this volume), gridpoint reconstructions in western
Was there a 'Medieval Warm Period' ? 115
Europe based on a combination of tree-rings and other data (EUR) (Guiot et al., 1988; Guiot, 1992), the Sierra Nevada, California (SNW) (Graybill, 1993); (SNS) (Graumlich, 1993); (Scuderi, 1993), Tasmania (TAS) (Cook et al., 1991, 1992), and southern South America (RIA) (Villalba, 1990, and this volume; Lara and Villalba, 1993). Similarly derived reconstructions of precipitation or precipitation related variables such as drought indices have been reported for the Sierra Nevada, California (Graybill, 1993), the Colorado Plateau (Rose et al., 1981; D'Arrigo and Jacoby, 1991; Taylor et al., 1992), the southeastern United States (Stahle et al., 1985; Stahle and Cleaveland, 1992; Stahle and Cleaveland, this volume), Morocco (Till and Guiot, 1990; Chbouki, 1992), and Chile (Boninsegna, 1990). In addition, a 2100 year record of extreme droughts in the San Joaquin Valley in California has been derived from giant sequoia tree rings (Hughes et al., 1990; Hughes and Brown, 1992).
The authors of the temperature reconstructions mentioned above have, to a large extent, used the same or at least comparable methods in their derivation. Similarly, they all address explicitly all or most of the characteristics of an ideal reconstruction listed at the beginning of this section. All these reconstructions, except EUR, extend through the whole of the millennium, are dated to the calendar year and have a temporal resolution in their climate signal of a year or better. Efforts have been made to address the strength, nature and seasonal applicability of their climate signals. In some cases, there is an explicit discussion of the spatial applicability of the climate signal (e.g., Graybill, 1993), and in all cases they document at least the locations of the trees sampled. Special attention will be given here to the following issues:
1. the strength of the climate signal and its geographic applicability for the re- constructions available to us;
2. the time-invariance of the strength and nature of the climate signal;
3. the extent to which these reconstructions faithfully record century-scale as well as interannual and decadal fluctuations.
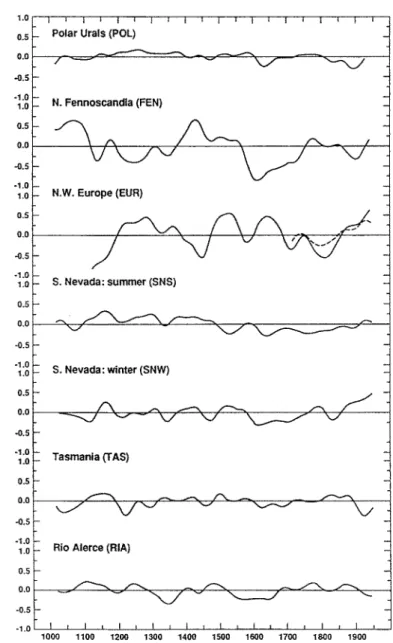
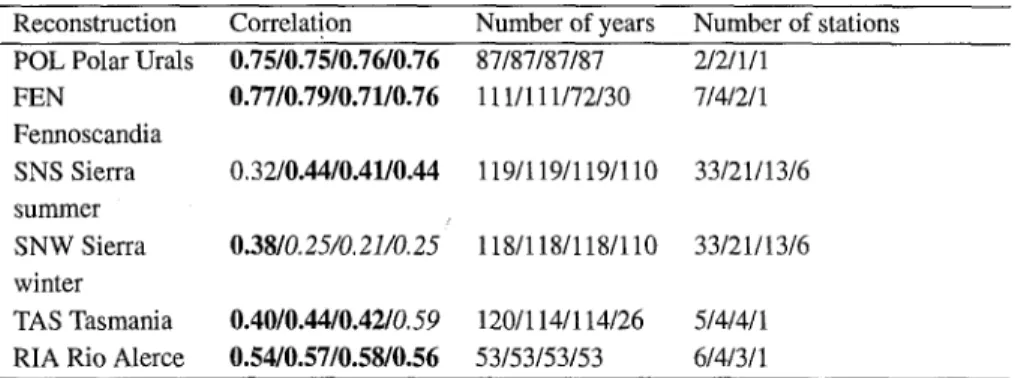
Table I gives the linear correlation between the tree-ring based reconstructions selected for study and the nearest ensemble of available long-term instrumental records. It is clear from this table that there is considerable variation in the extent to which each of the six entirely tree-ring based temperature reconstructions, (filtered versions of which are shown in Figure 3), is correlated with regional instrumental temperature records. There is a much greater number of stations available within 500 km of the locations for the Sierra Nevada reconstructions (SNW and SNS) than for the other reconstructions. Thus, the influence of the individual station or stations used to calibrate each record is much diluted in their particular case, as compared to the others. Taking into account the calculations and careful assessments of the climate signal and its reliability by the original authors of the records, along with the results shown in Table I, it may be concluded that these reconstructions con- tain considerable information about the temperature variations in their respective region at radii of several hundred kilometers. The proportion of the variance of
116 Malcolm K. Hughes and Henry F. Diaz U.l =, El ILl N el- ,¢ El Z I-- 03 1.0 0.5 0.0 -0.5 -1.0 1.0 0.5 0.0 -0.5 ol .0 1.0 0.5 0.0 -0.5 -1.0 1.0 0.5 0.0 -0.5 -1.0 1.0 0.5 0.0 -0.5 -1.0 1.0
0 . 5 ' 0 . 0
-0.5 -1.0 1.0 0.5 0.0 -0.5 -1.0
I I 1 1 I I I I I I 1 I I I I I I I
Polar Urals (POL)
N. Fennoscandla (FEN)
N.W. Europe (EUR)
S. Nevada: summer (SNS)
. - , ~ ,,---"---~ . , -
-S. Nevada: winter (SNW)
Tasmania (TAS)
Rio Alerce (RIA)
. ~ ~ ~
I r I i I , I I t I I ] I I I i I t I ,
1000 1 1 0 0 1 2 0 0 1 3 0 0 1 4 0 0 1 5 0 0 1 6 0 0 1 7 0 0 1 8 0 0 1900
Fig. 3. Low-pass filtered time series for seven long-term temperature reconstructions. Filter has a 50% frequency cut-off at 100 years and is used to highlight century time scale variations in the data, See text for a description of data and sources. The amount of variance present in each series on this time scale is as follows: (a) Polar Urals (POL) - 2.5%; (b) northern Fennoscandia (FEN) - 21.6%; (c) N.W. Europe (EUR) - 26.1%; (d) Sierra Nevada summer (SNS) - 4.0%; (e) Sierra Nevada winter (SNW) - 6.0%; (f) Tasmania (TAS) - 4.4%; and (f) Rio Alerce (RIA) - 3.3%, EUR is the mean of the time-series reconstructed for the four grid points at 50 and 55 ° N and 0 and 10 ° W, being the strongest grouping of high calibration statistics in the region reported by Guiot (1992). Dashed line plotted with EUR curve illustrates low-pass filtered Central England winter temperature in the period of overlap. It accounts for 6.7% of the total Central England winter temperature variance.
Was there a 'Medieval Warm Period'? 117
TABLE I: Correlation between tree-ring based temperature* reconstructions and instrumental records interpolated (using inverse distance weighted method) to the location of the tree-ring reconstruction using search radii of 500, 300 and 200 and 100 km
Reconstruction Correlation Number of years Number of stations POL Polar Urals 0.7510.7510.7610.76 87/87/87/87 2/2/1/1
FEN 0.77/0.7910.71/0.76 111/111/72/30 7/4/2/1
Fennoscandia
SNS Sierra 0.32/0.4410.4110.44 119/119/119/110 33/21/13/6 summer
SNW Sierra 0.3810.25/0.21/0.25 118/118/118/110 33/21/13/6 winter
TAS Tasmania 0.40/0.44/0.42/0.59 1201114/114/26 5/4/4/1 RIA Rio Alerce 0.5410.5710.5810.56 53/53/53/53 6/4/3/1
* seasonal mean values of station temperatures corresponding to the season of the tree-ring reconstruction were used.
Bold signifies p < 0.0001. Plain signifies 0.0001 < p < 0.001.
Italic signifies 0.001 < p < 0.05.
regional-scale temperatures captured by the reconstructions ranges from over 55% for the Polar Urals (POL) and northern Fennoscandia (FEN), through 30 to 42% for Rio Alerce (RIA) and 20 to 38% for Sierra Nevada summer temperature (SNS), down to 16 to 35% for Tasmania (TAS) and 10 to 38% for Sierra Nevada winter temperatures (SNW). In some cases the original authors of these reconstructions report stronger correlations with instrumental data. It should be remembered that they will normally have chosen the meteorological station or stations they judged to be most appropriate for comparison with their tree-ring based material, for ex- ample, in terms of the elevation of the stations. We have made no such selection in the calculations reported in Table I. The 1000 years or longer temperature recon- structions mentioned above, but not shown in Table I, appear to be broadly similar in terms of the strength of their climate signal. Serre-Bachet's (this volume) recon- struction of summer temperatures in northern Italy is reported as capturing at least 33% of observed temperature variance in the period of overlap with instrumental records; Guiot's European reconstructions (EUR) based on tree-rings and other kinds of records capture a mean of 40% of temperature variance; the southern South American reconstruction (RIA) captures 33 to 37%; and Graybill reports a range of explained variance in verification periods of from 34 to 64% in his Sierra Nevada temperature (SNW) reconstruction. Most of these reconstructions are based on relatively limited amounts of material from one to a very few sites, and consequently have weaker climate signals than those obtained from multi-site tree-ring networks for which material of only 500 years' length or less is available. Such shorter reconstructions, especially when wood density rather than ring width
118 Malcolm K. Hughes and Henry E Diaz
is the main variable used, often account for as much or more temperature variance than the 55% plus seen here in the Polar Urals (POL) and in Fennoscandia (FEN) (Briffa et al., 1988; Briffa et al., 1992; Conkey, 1986; Hughes and Davies, 1987; Hughes, 1992). It is very likely that the quality (for example, the proportion of temperature variance accounted for) of most existing 1000-year temperature re- constructions other than the two northernmost (POL and FEN) would be improved if further multiple site chronologies were available.
There are four major sources of change in the strength and nature of a given climate signal in a reconstruction. First, the number of radii series and trees con- tributing to each chronology changes through time, usually being smallest at the beginning of the chronology. Most authors take account of this in deciding from which beginning year to report their reconstruction. This is not a significant prob- lem with most of the reconstructions discussed here, at least for the last 1000 years. Similarly, there may be a change in the number of chronologies used in deriving the reconstruction. In fact, some of the reconstructions discussed here are based on single site chronologies (e.g., RIA, TAS, SNW). Others are based on multiple-site mean chronologies for a small region (FEN and POL), while yet others are based on groups of separate site chronologies (SNS, EUR). Reconstructions based on regional mean chronologies, or on groups of separate site chronologies, are much less likely to be distorted by non-climatc changes than those based on a single site chronology, since changes unique to a single site are to some degree diluted when material from multiple locations is used. Reconstructions based on groups of separate site chronologies have the further advantage that they have the potential to capture information related to larger scale climate phenomena. This is for two reasons: if the chronologies are sufficiently widely distributed, they will respond to the various sub-regional effects of particular climate fluctuations and events, and, as already mentioned, site-specific effects, including microclimate, may be diluted in a multi-chronology set.
The second source of change in climate signal strength and nature is associated with tree biology and ecology. The first few decades of a tree's life are marked by physiological and developmental differences from later life. As they only apply to a very short period (at most a few decades) these changes are likely to be relatively unimportant for most of the reconstructions discussed here, excepting for the first few decades of those that actually begin close to A.D. 1000. Other changes in tree- ring response to climate are associated with the trees' relative position in the forest canopy, which usually stabilizes once each tree has completed most of its height growth. This is unlikely to be important in the case of chronologies built from trees growing in open stands, i.e. those where the trees are so far apart that there is little or no interaction between them (e.g., POL, FEN, all the Sierra Nevada temperature reconstructions and the Graumlich Sierra Nevada precipitation reconstruction). For chronologies from more closed forest stands where greater inter-tree interaction might be expected, this problem is to some degree dealt with by the process of standardization (see below).
Was there a 'Medieval Warm Period' ? 119
The third source of change in the climate signal concerns site conditions. These changes might arise from gradual changes in soil chemistry or in site hydrology, or from more acute changes associated with changes in stand structure caused by disturbance such as fire or human intervention. The influence of disturbance on site chronologies can be minimized by careful site and tree selection, and by inspection of cores for evidence of disturbance and their exclusion from the site chronology, e.g. sudden growth surges or suppression, reaction wood, traumatic resin ducts, fire scars, and so on. This is standard practice in dendroclimatology. It is more difficult to guard against the influence of gradual site changes on climate reconstructions, except again by the use of material from multiple locations. A particular problem arises when trees from an area close to a distributional limit such as elevational or latitudinal treeline are used. Graybill and Shiyatov (1992) discuss this issue with respect to their Polar Urals (POL) temperature reconstruction, and conclude that the evidence of tree line movement contained within their data is consistent with the general pattern of their reconstruction.
The fourth source of noise in the recorded climate signal arises from the inter- action of the various climate factors that might control tree growth. For example, the influence of summer temperature on ring width in semi-arid high elevation sites may only be evident in unusually wet years. A shift in the frequency of such years would produce variations in the relative influence of these two factors on ring width. It is conceivable that such changes could cause the instrumental period in which the reconstruction was calibrated and verified to have few analogues in the last 1000 years. This possibility has been dealt with in a number of ways. One is to choose regions, sites and tree ring variables that have a simple and domi- nant relationship to a climate variable of interest. Examples of such combinations are conifer maximum latewood density from regions with cool moist summers as a summer temperature recorder, and ring widths from mid- to low elevations in semi-arid conditions as recorders of soil moisture or seasonal precipitation. Another approach is to deal explicitly with these interactions, which may be non-linear, for example by developing response surfaces (Graumlich, 1993). Finally, the ensemble of chronologies with different climate responses within a region can be used (Fritts, 1991) as a transducer capable of capturing a wider range of interactions than any 'single response function' data set.
How well do these temperature reconstructions represent century scale fluctu- ations? There is ample evidence from the statistical calibrations and verifications discussed above that the reconstructions contain significant amounts of information on relatively high-frequency fluctuations (two or three decades down to interannual, see Diaz and Pulwarty, this volume). Long-term tree-ring changes associated with tree age and stand dynamics have been removed from the chronologies used in these reconstructions by a variety of techniques. The problem is to remove these non- climatic changes from the tree ring series while retaining as much climate-induced variability as possible. In the case of almost all the temperature reconstructions discussed here, strenuous efforts have been made to conserve climate-related vari-
120 Malcolm K. Hughes and Henry E Diaz
ation on time scales of up to one or a few centuries. Generally, this has involved using core or tree series several centuries long and detrending very conservatively using a straight line, negative exponential or very stiff spline. In the case of the Fennoscandia (FEN) reconstruction, a rather simple standardization curve was de- rived from the date-independent mean growth curve of a large sample of trees (Briffa et al., 1992). It does seem likely, however, that the standardization method used by Serre-Bachet (this volume), namely, the ratio of measured ring-width to a curve produced by a 60-year low-pass filtering of the data, would minimize all century-scale features in the chronologies, including those due to climate. Guiot et al. (1988, 1992) has used similar methods to Serre-Bachet but his reconstruc- tions contain century-scale information from the ice core and historical data he uses along with tree rings. Finally, the possibility should be recognized that some trees may be able to adapt to century-scale climate fluctuations (see Stahle and Cleaveland, this volume) and hence will not record such changes in their tree-ring series.
3.2. Interpretation of the Climate Record
What evidence of a Medieval Warm Epoch, if any, is offered by these reconstruc- tions? Figure 3 illustrates the time behavior of the temperature reconstructions considered here. The annual data have been standardized for ease of comparison and smoothed with a Lanczos filter (Duchon, 1979) having a frequency cutoff of 50% at 100 years to emphasize variation with periods of 100 years or longer. It is of interest that the variance passed by these filters is, in most cases, only a small fraction of the total variance of the unfiltered series, usually less than 5%. This is similar to the fraction of total variance passed by an identical filter applied to the longest available instrumental temperature record, Manley's Central Eng- land series. Winter temperatures for the period from 1721-1990 were used in this calculation. Two reconstructions show proportionately much more century-scale variance, namely summer temperatures at Tornetrask, northern Sweden (FEN), and annual temperatures in northwestern Europe (EUR). It is not clear whether this higher proportion of century-scale variance in these two reconstructions represents local climate reality or is the product of the methods used to develop them. Sum- mer temperatures in the Polar Urals (POL) and the Sierra Nevada (SNS) show persistent positive anomalies from the millennium mean from around A.D. 1110 to 1350 and A.D. 1090 to 1450, respectively. There is a persistent warm anomaly in Guiot et al.'s (1988, 1992) multiproxy reconstruction of northwest European annual temperatures between A.D. 1190 and 1350, whereas the Fennoscandian reconstruction (FEN) shows negative anomalies at the same times as the positive anomalies in the Polar Urals (POL). The largest persistent positive anomalies in the Fennoscandian reconstruction were from A.D. 971 to 1100 and from A.D. 1350 to 1540. A positive anomaly centered around A.D. 1150 is seen in both Sierra Nevada reconstructions in Figure 3 (SNS and SNW) and in Tasmanian summer
Was there a 'Medieval Warm Period'? 121
temperatures (TAS). A similar anomaly is seen in southern South American sum- mer temperatures (RIA) centered around A.D. 1090, but overlapping the warm anomalies in SNS, SNW, and TAS. These are the largest warm anomalies in SNS, TAS and RIA, and the second largest in SNW. For all series shown in Figure 3 the warm anomalies between A.D. 900 and 1300 have only been exceeded subse- quently in two cases, the twentieth century in Sierra Nevada winter temperatures (SNW) and EUR. There is, however, only limited synchrony in the anomalies in the tenth to fourteenth centuries. Serre-Bachet (this volume) notes as many cold as warm episodes between A.D. 1000 and 1300, with no evidence of warming in the twelfth century (although the probability that her reconstruction may not reflect century scale variations adequately was discussed above). It has already been noted that Guiot et al.'s (1988, 1992) multiproxy reconstruction of northwestern Euro- pean temperatures (EUR) shows temperatures close to modern between A.D. 1200 and 1300, colder before 1200 and between 1370 and 1450, and similar to present in the early sixteenth and early seventeenth centuries. Lara and Villalba (1993) do not find evidence for a Medieval Warm Period in their long summer temperature reconstruction from southern South America, although they may have reduced their chances of observing such a change by standardizing their tree-ring series using a spline with a 50% variance reduction at 128 years. Scuderi's (1993) reconstruction of annual temperatures in the Sierra Nevada indicates a warmer period from the late tenth to early twelfth centuries, but this is not as marked as a warm period in the sixteenth century. There is evidence to support the low frequency trends in Graumlich's (1993) reconstruction of summer temperatures in the Sierra Nevada (SNS) by virtue of its broad similarity to the growing season temperature changes inferred by LaMarche (1974) from upper elevation bristlecone pine ring widths from the White Mountains, 50 km or more to the east of the Sierra Nevada sites. LaMarche's speculation that this series might represent temperatures, at least on multidecadal and longer time scales prior to the mid-nineteenth century, has re- ceived support recently from the similarity of a series derived from upper elevation bristlecone pine ring widths in a larger region, and a smoothed version of a well calibrated summer temperature reconstruction derived from wood density from a completely independent network of conifer chronologies (Graybill and Idso, 1993). The similarity between Graumlich's reconstruction (SNS) and LaMarche's series suggests that the pattern of a sustained Medieval Warm Epoch followed by a Little Ice Age illustrated in a number of technical and popular works on past climate may well have existed at high elevations in the mountains of eastern California. Further support is given by the existence of the same pattern, particularly the cool period in the seventeenth and early eighteenth centuries, in Graybill's Sierra Nevada winter temperature reconstruction (SNW). It is of interest that all the tree-ring materials used by these authors (Graumlich, Graybill and LaMarche) in the White Mountains and Sierra Nevada were collected at high elevation (3000 m, or above).
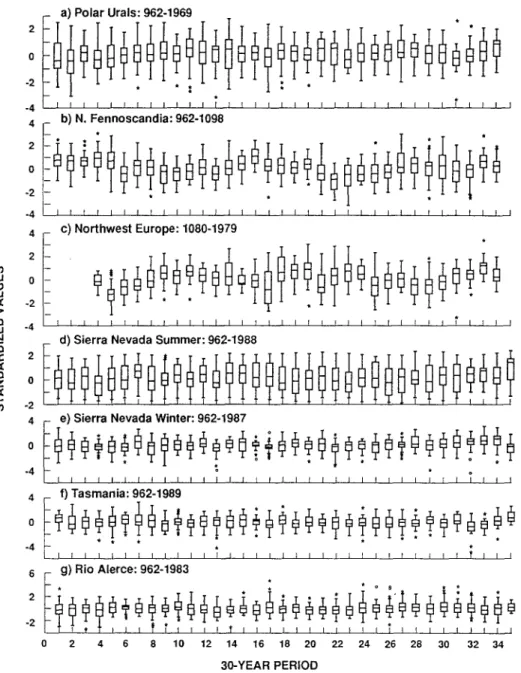
It is instructive to view these 1000-year reconstructions in terms of consecutive 30-year periods commonly used in descriptive climatology. Figure 4 (a through
122 Malcolm K. Hughes and Henry E Diaz a) Polar Urals: 962-1969
0
-2 , , , ,~ ,
4 b) N. F e n n o s c a n d i a : 962-1098
-4 ~ ~ ~ ~ ~ ~ ~ ~ ~ ~ ~ ~ ~ J ~ ~ ~ ~ ~
4 e) Northwest Europe: 1080-1979
¢'~ I I I I ~ I I I t I [ I I I I 1 I I I I
LU - 4
N d) Sierra Nevada S u m m e r : 962-1988
i:
4 r- e) Sierra Nevada Winter: 962-1987o
,
!
-4 *=
4 r- f) T a s m a n i a : 9 6 2 - 1 9 8 9
6 ~ ,g) Rio Aleree: 962-1983
I J l l l I l i ~ l J f
I ~ l l l l l I I l l l l
F l l l I I I ~ J ~ I I 1
!!!!!!!I!!!!!!
22 24 26 28 30 32 34
- 2
0 2 4 6 8 10 12 14 16 18 20
30-YEAR PERIOD
Fig. 4. Box and Whisker diagrams for each of the seven long-term temperature indices used in this study. Graphs show the distribution of standardized values (over the record length of each series) in each successive 30-yr interval. See text for a description of data and sources.
g) s h o w s t h e s e v e n s e r i e s f e a t u r e d in F i g u r e 3 in t e r m s o f b o x - a n d - w h i s k e r
d i a g r a m s f o r n o n - o v e r l a p p i n g 3 0 - y e a r p e r i o d s c o m m e n c i n g in A . D . 962. E a c h b o x g i v e s t h e d i s t r i b u t i o n o f t h e c e n t r a l 5 0 % o f t h e s t a n d a r d i z e d v a l u e s (i.e., v a l u e s in t h e r a n g e b e t w e e n the 2 5 t h a n d 7 5 t h p e r c e n t i l e s ) ; the h o r i z o n t a l l i n e in e a c h b o x r e p r e s e n t s t h e m e d i a n , t h e v e r t i c a l l i n e s ( w h i s k e r s ) e x t e n d o u t f r o m
Was there a 'Medieval Warm Period'? 123
TABLE II: Calendar year intervals for the 35 thirty-year periods shown in Figure 4 Period covered is A.D. 960 to 1989. Note that the last interval, number 35, covers only 8 years 1982-1989
Index Calendar years Index Calendar years Index Calendar years
n o . n o . n o .
1 962-991 8 1172-1201
2 992-1021 9 1202-1231
3 1022-1051 10 1232-1261
4 1052-1081 11 1262-1291
5 1082-1111 12 1292-1321
6 1112-1141 13 1322-1351
7 1142-1171 14 1352-1381
22 1592-1621 29 1802-1831
23 1622-1651 30 1832-1861
24 1652-1681 31 1862-1891
25 1682-1711 32 1892-1921
26 1712-1741 33 1922-1951
27 1742-1771 34 1952-1981
28 1772-1801 35 1982-1989
15 1382-1411 16 1412-1441 17 1442-1471 18 1472-1501 19 1502-1531 20 1532-1561 21 1562-1591
the 25th and 75th percentiles up to 1.5 times the interquartile range (IQR) and the starred and circled values correspond to annual values at distances between 1.5 and 3.0 times the IQR, and greater than 3.0 times the IQR, respectively. The highest median in POL is for 1952-1969, the last 18 years in the record, followed closely by 1262-1291. Table II identifies the fixed 30-year period (starting in A.D. 962) corresponding to each index value plotted along the abscissa of each graph. The last '30-year box' may contain less than 30 values depending on when the particular series ended. Beginnings of record boxes may also contain fewer than 30 values. In FEN, the highest median is for 1412-1441, followed by 1052-1081, and then by a group of 30-year periods in the tenth and eleventh centuries. The warmest median for EUR is from 1922-1951 followed by 1532-1561, 1502-1531 and 1262-1281. The highest 30-year median in SNS is for 1142-1171 followed by 1352-1381 and 1382-1411, then 1922-1951. In SNW, the highest median is for 1952-1981, followed by 1142-1171 and 1382-1411. The periods 962-991 and
1112-1141 have the highest 30-year medians in Tasmania (TAS), followed by a
group of periods from 1322 to 1411. At Rio Alerce (RIA) 1112-1141 has the highest 30-year median followed by 1082-1111 and several other periods in the first half of the millennium. In only two out the seven cases illustrated in Figure 4 does the first half of the seventeenth century not contain one or more of the four coldest 30-year periods in the millennium, and three have their coldest 30-year period in this half-century. In no case where a full 30 years data are available for 1952-1981 does this period stand out as unusual when compared with the rest of
124 Malcolm K. Hughes and Henry E Diaz the millennium (see Diaz and Bradley, in press).
Is there any distinguishing feature of the Medieval period to be found in any of the tree-ring reconstructions of precipitation? Graybill (1993) reconstructs multi- decade periods of low winter precipitation in the Sierra Nevada around 1300, 1600 and 1900, followed on each occasion by wetter than normal conditions. There is some similarity between this reconstruction and that produced independently by Graumlich (1993) for the same region, who notes drought periods between A.D. 800-859, 1020-1070, 1197-1217, 1249-1365, 1443-1479, 1566-1602, 1764- 1794, 1806-1861 and 1910-1934. She finds no evidence of century-scale or longer deviations in her reconstruction. Reconstructed periods of higher frequency of ex- treme drought events in the San Joaquin drainage (Hughes and Brown, 1992) are inferred from A.D. 700 to 850, 250 to 350 and 1480 to 1580 in order of decreasing intensity, and of relatively low frequency droughts from 100 B.C. to A.D. 100, 400 to 500, 1600 to 1700 and 1850 to 1950. If distinguished at all, the Middle Ages demonstrate a relative lack of multi-decade or century scale variation in the frequency of these extremes. The only significant exception to this is the unusually wet period between A.D. 1080 and 1129 inferred from anomalously low A13C in bristlecone pine in the White Mountains of California (Leavitt, this volume). The Medieval Period does not appear to differ from the rest of the last millennium in re- constructions of precipitation on the Colorado Plateau (Taylor et al., 1992), except that the last authors note abrupt changes in the power spectrum between A.D. 1280- 1350, 1416-1534, 1645-1714 and 1800-1835, all believed to be periods of low sunspot activity. In particular, they report that oscillations with periods of approxi- mately 20 and 80 years are absent during times of low sunspot activity. Stahle and Cleaveland (this volume) observe no century scale effects in reconstructed spring precipitation in the southeastern United States, although the second to fourth driest decades did occur between A.D. 900 and 1300 (945-954, 1192-1201, 1082-1091, 1262-1271; the driest was 1756-1765). They do note a relative prevalence of decadal scale dry episodes between the mid-eleventh and early thirteenth century. Similarly, Moroccan winter precipitation (Till and Guiot, 1990) tended to be low between 1186 and 1234, and from 1379 and 1428, whereas wet years were unusu- ally frequent between 1250 and 1300. A sustained drought is reconstructed for the period 1270-1450 at Santiago de Chile (Boninsegna, 1992), followed by another such episode between 1600-1650. This reconstruction is considered highly reliable after 1250. It is difficult to discern any consistent multi-decade or century-scale pattern in the available precipitation reconstructions.
3.3.
Summary of Dendroclimatology Evidence
Other than the regions containing the Sierra Nevada and the Great Basin, northern Fennoscandia, the Polar Urals (POL) and Guiot's large regional reconstructions (whose low frequency component may be substantially affected by less well dated and more poorly understood records than tree rings), these reconstructions offer
Was there a 'Medieval Warm Period'? 125 little support for a sustained Medieval Warm Epoch/Little Ice Age sequence in the last 1000 years. On the other hand, there are some consistent features such as: (a) an increased tendency toward cold conditions in the early and mid-seventeenth century; and (b) either a warm period in the mid-twelfth century and/or the late thirteenth/early fourteenth centuries. This latter feature is not striking. The records for the twentieth century show no consistent distinguishing features in comparison with the rest of the millennium (with the exception of the Sierra Nevada winter temperature reconstruction). It should be noted that only TAS covers the whole of the 1980s, while POL and EUR do not cover this decade at all, and FEN ends in 1980.
4. Ice Core Evidence
4.1. Strengths a n d Limitations
Annually layered ice cores from the polar regions or from high elevations at mid- and low-latitudes may possess a number of the characteristics of an optimum paleoclimate record of the last thousand years listed above (section 3a). There are many situations in which records spanning the last millennium, and indeed much longer, have apparently annual layers. In general, the occurrence of such records depends upon a sufficiently reliable and high rate of deposition to allow identification of seasonal features, and on maximum temperatures being too low to permit melting. Almost all the published records are based on single cores, relying on the distinctness of interannual features such as seasonal cycles of stable isotopes (usually lSo), conductivity, and concentrations of ions and of microparticles as guides to the identification of annual layers. Having identified the annual layers, the investigators establish a chronology by counting them back from the known date of sampling. This procedure fails to deal with situations in which one or more annual layers has been lost, perhaps by wind action, or where a strong intra- annual feature has been mistakenly identified as an annual layer. Thompson (1991) points out that "It is important that two ice cores be drilled at the same site and independently analyzed to provide an independent verification of the time scale and to ensure an uninterrupted physical and chemical stratigraphic record" (p. 205). Of course, it is possible that a dating error could survive even this approach if the same layer was missing from both cores. In ideal circumstances multiple cores would be used. It is sometimes possible to use a specific marker event to check an ice-core chronology. For example, a notable dust layer in the Summit Core from Quelccaya, Peru has been identified with the historically recorded eruption of Huaynaputina from 19 February to 6 March A.D. 1600 (Thompson, 1991). In cases where such markers are not available, and in particular in the earlier part of the millennium in records based on a single core, dating errors of several years or more cannot be ruled out. This limits the value of such records in the present investigation, where decadal-scale variation is important.
126 Malcolm K. Hughes and Henry E Diaz
Few direct analyses of spatial relations between interannual variability in ice- core measurements, usually 6180, and meteorological records have been made that would allow a rigorous assessment of the spatial applicability of these records. Lack of consistency has been noted between stable isotope time series from different parts of, for example, Greenland (Robin, 1981) or the Antarctic Peninsula (Jones
et al., 1993). Some of this inconsistency may be ascribed to intraregional climate complexity, and some to noise in the ice core records. The paucity of meteorological stations in polar and high-elevation regions makes it impossible to do the kind of analysis presented for tree ring-derived temperature records in Table I. The best hope for gaining a firmer understanding of the spatial applicability of ice core derived records of, for example, temperature and snowfall, may rest in a combination of regional networks of cores and partially synthetic meteorological data based on forecast models with adequate mesoscale resolution.
Annually layered ice core records are, of course, absent from the greater part of the Earth's surface. They are found, however, in several regions of great importance to understanding of the global climate system, where few if any other records exist, notably the polar ice caps, the Tibetan Plateau, and the High Andes. Of the many variables that may be measured in the annual layers of ice cores, 6180 has received the greatest attention as a potential source of information on past temperatures. This variable is often assumed to be a recorder of "changes in the temperature gradient from the vapor source region(s) to the ice core site" (p. 96 in Oeschger and Langway, 1989), or of temperature at the ice core site. As Jones et aL (1993) p. 14 point out, "Although the isotopic fractions of the heavier oxygen- 18 and deuterium in snowfall are temperature dependent, researchers should not unquestioningly add a temperature scale to isotope time-series plots. The temptation to do this arises from the strong spatial correlation between the annual-mean temperature and the mean isotopic ratio (5180 or ~SD) of precipitation. This spatial correlation, however, masks the complexities of the isotopic evolution process, from the source through atmospheric transport to final deposition... Because of these many problems one cannot assume a p r i o r i that isotopic changes at a single site are closely related to temperature changes." They go on to recommend that isotope based reconstructions be based on relationships that have been checked against instrumental climate data on appropriate time scales. This has not been done very often, due no doubt in part to the lack of long-running meteorological stations near the sites of ice cores. In the few cases where such analyses have been attempted (for example Jones et al.,
1993, Robin, 1981) only about one-third of annual temperature variance on time scales of years to decades is accounted for by the isotopic data. In several cases this estimate is based on 30 or fewer years and hence is of little value in assessing these records on the decadal time scale. The alternative approach of comparing isotopic records with temperature histories derived from borehole or ice temperatures has been proposed (Robin, 1981), and is to be applied on time scales relevant to this review as part of the GISP2 project (Alley and Koci, 1990).
Although it is clear that the seasonal nature of isotopic signals in ice depends in
Was there a 'Medieval Warm Period'? 127 part on the seasonal distribution of snowfall, which may be very short, it could also be affected by seasonal variations elsewhere between the vapour-source region and the site of the ice core. Changes in ocean currents, seasonality of snowfall and storm-tracks, for example, could lead to changes in the isotope record over decades and centuries. The use of deuterium excess above that calculated from a temperature-determined relationship between 6180 and ~D to detect changes in source region is possible (Oeschger and Arquit, 1991). This might be a useful component of a screening procedure for time-variance in the nature of the climate signal in 6180 time series.
It is difficult to assess if isotopic records from annually-layered ice cores are capable of recording century-scale as well as interannual and decadal fluctuations, given the uncertainties surrounding the nature and strength of the climate signal. There are, however, some cases where marked shifts in the relationships between a suite of variables measured in an ice-core occur almost simultaneously and persist for several decades or longer (Thompson and Mosley-Thompson, 1989; Mayewski et aL, 1993). This might represent a more general change in atmospheric conditions than should be deduced from the variation of a single quantity.
4.2. Evidence for a Medieval Warm Epoch
Inconsistencies between 6180 time series from several locations in the region in- cluding Greenland were noted by Robin (1981, p. 193), who pointed out that "a warm s p e l l . . , in the middle of the twentieth century is almost the only feature common to all records", inferring warmth from less negative 6180 values. Decadal scale differences between regions within Greenland are known from the instrumen- tal record, and so it is not particularly surprising that such differences are seen in the isotopic time series. On the other hand, Ogilvie (in press) has shown similarities between multi-decade anomalies in the Cr~te and Milcent 6180 series, Dye-3 melt data, Iceland sea ice data and Iceland temperatures reconstructed from historical documents for the period A.D. 1600 to 1800.
There is little evidence of a globally coherent pattern of century scale variation in the north-south global transect assembled by Thompson (1991) and reproduced in Figure 5. The time series of decadal averages of 6180 have been interpreted as temperature records. Only two, those from Quelccaya in the Peruvian Andes and from South Pole, Antarctica, show evidence of a higher incidence of above average 'temperatures' in the first part of the 1000 years followed by a period of more frequent below-average decades after A.D. 1520. Quelccaya Summit is at 5670 m and South Pole is at 2912 m, whereas Siple Station is at 1054 m. The other high elevation core included in Figure 5, Dunde from the northern Tibetan Plateau, does not show this pattern. Dansgaard etal. (1975) noted a strong similarity between smoothed versions of the Cr~te 6180 series and Lamb's English temperature record based on a mixture of historical and other sources, and early instrumental records. There is considerable similarity in these smoothed series during their most reliable
128 Malcolm K. Hughes and Henry F. Diaz
-31 1980 f 9 0 0 1 8 2 0
.
1740-
~ 6 6 0
~'~ 1580
C'1
~500 1420 -
13aO 1280
Camp Century Dunde
Greenland Chine
77o10'N, 61o08'w 38o08'N,98o24' W - 2 9 -27 -12.5 -10.5
I900 -
~820 1740 I 6 6 0
1 5 8 0 -
1500 - ~ 4 2 0 -
i 5 4 0 -
8 iSOfgto) DecadafAvcrages
Quelccaya South Pole
P e r u A n t a r c t i c a
1 3 " 5 6 ' 5 , 7 0 " 5 0 ' w
-210 - ! 9 0 -t7.0 - 5 2 5 -51.5 -50.5 - 4 9 . 5
~660 : 5 8 0 ~500
Siple Station Antarctica
75" 55'S, 84*:5'W -31.5 - 5 0 5 -29.5 -28.5 i ! 9 8 0 r I , T i I
q.
1900 ~820
g . .
i 7 4 0
4
t42C
"°°1
It"
Fig. 5. Decadal averages of the 5180 records in a north-south global transect. The shaded areas represent periods isotopically less negative than the long-term mean for that core as shown here, which is commonly interpreted as indicating relative warmth. The converse applies to the unshaded areas. Reproduced from Thompson (1991).
period, that since A.D. 1700. The Crete series does indicate a higher frequency of above average 'temperature' multidecadal periods in the ninth and eleventh centuries than at any time since, except the twentieth century. It may be relevant to note that Crete is the highest elevation Greenland ice core (3172 m) discussed so far in this review. For comparison, Camp Century is at 1885 m.
4.3. Summary of Ice Core Evidence
Considerable caution should be exercised when interpreting time series of 5tSo as temperatures on decadal to century time scales, although multi-variable analyses show promise. There is evidence for higher frequency of above-average 5180 on decadal and multidecadal time scales at the end of the first millennium A.D. and in the early centuries of the second millennium A.D. at Quelccaya, Peru, South Pole and Crete, Greenland, all sites at close to 3000 m elevation or higher.
Was there a 'Medieval Warm Period'? 129
5. Documentary Evidence
5.1. Strengths and Limitations
H. H. Lamb (1977, p. 435) drew the following conclusions concerning the 'me- dieval warm epoch, or Little Optimum'
"In the heartland of North America, as in European Russia and Greenland, the warmest times may be placed between about A.D. 950 and 1200. In most of Europe the warmest period seems to have been between 1150 and about 1300, though with notable warmth also in the late 900s. In New Zealand the peak may have been as late as 1200 to 1400. In southernmost South America the forest was receding rapidly to western aspects only, indicating more effective rain shadow from the Andes."
Lamb was able to collate a much higher geographic and temporal density of evidence on the climate of Europe, particularly northern Europe, than for any other region. This applies especially to documentary sources. He brought together a very wide range of evidence for the existence, location and nature of this 'warm epoch', including natural archives such as tree rings, ice cores, and speleothems, paleoeco- logical analyses (notably those concerning latitudinal and longitudinal distribution of forest vegetation, and of inshore marine conditions), geomorphological analy- ses (particularly concerning glaciers and fluvial processes), archeological evidence (particularly as it refers to the latitudinal and elevational extent of cultivation of various crops), written records of various kinds referring to meteorological phe- nomena (especially extreme seasons, but also such matters as observed sea ice), sea level changes, phenological records, crop prices and social conditions.
These records were used to establish a time course of relative change for a number of features of seasonal climate at particular locations or in specified regions, for example, an index of summer dryness/wetness in England based on documentary sources. Various methods were then used to quantify, in terms of meteorological measurements, the changes inferred from the analysis of this very large collection of information. A notable example of this is an assessment of crop or other plant distributional data and wine harvest dates, all from western Europe. A table was presented (Lamb, op. cit., Table 17.1, p. 426) of calculated temperature departures for the warmest month of the year for various parts of the Middle Ages compared with 'average values prevailing about 1900'. These ranged from 0.5 to 1.6 °C and seemed to refer primarily to temperatures in some period of unspecified length ending around the early fourteenth century, although the change in wine harvest dates is reported as taking place after 1550. Other than this table, the major evidence Lamb (op. cit.) presented for the level of temperature change associated with the 'medieval warm epoch' is based on reports or inferences concerning conditions in the Viking colonies in Greenland.
Knowledge of many of the types of records used by Lamb in his earlier papers (Lamb, 1965) and in his classic 1977 monograph, as well as by others focussing
130 Malcolm K. Hughes and Henry E Diaz
on this period (e.g., Flohn, 1950) has advanced by a considerable extent in the last decade. In the case of evidence based on documentary sources, the most impor- tant methodological development has been the systematic and rigorous application of the techniques of historical analysis as advocated, for example, by Gottschalk (1971-1977), Ingram et al. (1978), Bell and Ogilvie (1978), Ingrain et al. (1981), and Pfister (1988). These techniques emphasize a dependence on contemporaneous reports of well established provenance and a critical review of the reliability of the record based on the highest standards of modem historical scholarship. Such analyses (e.g., Alexandre, 1987; Ogilvie, 1991) have led to the rejection of im- portant blocks of information used by workers such as Lamb (1977) and Flohn (1950). For example, work by Ogilvie (1991) demonstrates that a major proportion of the (Bergth6rsson, 1969) reconstruction of temperature in Iceland is based on Thoroddsen's 1916 compilation which contains 'no reliable climatic information' (Ingram et al., 1978, p. 331) for 24 out of 59 decades between A.D. 950 and 1540. Many of the decades with information have very little documentation, for exam- ple, only one reliable item between A.D. 1431 and 1560. Similarly, it has been demonstrated (Bell and Ogilvie, 1978; Alexandre, 1987) that a high proportion of data in climate catalogs much used by mid-twentieth century climate historians of the Middle Ages such as Lamb, for example those of Vanderlinden (1924), Easton (1928), and Hennig (1904), fail the tests of modem historical scholarship (45%, 50% and 50% of relevant material, respectively, being rejected for Vanderlinden, Easton and Hennig). A significant proportion of these errors is attributed to the uncritical re-use of second-hand or worse sources, with no direct reference to or analysis of primary sources (Bell and Ogilvie, 1978; Alexandre, 1987). Alexandre notes (1987, p. 17), for example, "innumerable errors of dating and localization which are scattered across Easton's published work". Ingram et al. (1978) point out that, while the correlation between Lamb's summer wetness index for England and data derived independently from the Winchester manorial rolls (Titow, 1970) is 0.77 (n = 15) for the decades A.D. 1200-1350, Lamb's winter severity index for England has a correlation of only 0.2 (n = 30) for the period A.D. 1100-1400 with Alexandre's index based on primary data from mainland Europe.
5.2. Evidence f o r a Medieval Warm Epoch
Recent work based on the rigorous application of modem techniques of historical analysis yields a somewhat different picture of European climate in the Middle Ages to that described by Lamb. For example, for the region of western and central Europe (excluding the British Isles) that he has studied, Alexandre's (1987, p. 808) conclusion is that, "the 'Medieval climate optimum' was not reached around 1150-1200, but around 1300." Ogilvie (1991, p. 249) in her analysis of Iceland's climate reaches conclusions less at variance with those of Lamb (1977), but she points out the weakness (or even absence) of reliable specific evidence for much of what has become accepted as fact. In particular, she concludes " . . . there is
Was there a "Medieval Warm Period' ? 131
no firm foundation of data for a so-called 'Climatic Optimum' during the early years of Iceland's history. However, there is considerable circumstantial evidence for generally mild conditions up to the late twelfth century. The climate of that time may have been similar to the relatively mild climate experienced in Iceland during much of the twentieth century. From the latter part of the twelfth century, on to the sixteenth century, relatively short periods of harsh climate occurred periodically. During these times, mean annual temperatures may have fallen to 1 or 2 °C below typical twentieth century Icelandic temperatures." She points out that even these rather extreme departures cannot reasonably be seen as the onset of a 'Little Ice Age' because a prolonged cold period was not experienced in Iceland until the mid-eighteenth century, lasting until the 1840s. These recent authors have produced reconstructions of several different kinds of climate indices. For example, Alexandre (1987) has adopted a similar procedure to Lamb's (1977) in calculating an index of winter severity for all Europe north of the Alps, and indices of summer and winter precipitation for westem Europe. Specific indices were developed for the Mediterranean regions (winter and summer), and similarly for spring temperatures in westem Europe. He drew the following major conclusions for the various regions into which he had divided Europe on the basis of an analysis of m o d e m instrumental data (pp. 807-808):
For Europe north o f the Alps: "an important but short-lived increase of tem- peratures around the middle of the fourteenth century; from 1150 to 1330 a cold winter climate predominated, with more severe phases in the mid-12th century, at the beginning of the thirteenth century and in the first quarter of the fourteenth century; winter precipitation was higher from 1240 to 1400 than from 1170 to
1240."
For the mediterranean zone: "no warming in the mid-14th century."
For western Europe: "a remarkable preponderance of dry summers is estab- lished for the period 1200 to 1310, in contrast to phases of high precipitation in the second half of the twelfth century and the first half of the fourteenth century. No particular correlation is evident between these fluctuations and those of summer climate in the mediterranean region. Spring temperatures in western Europe show a long warm period from 1220 to 1310 followed by a spectacular cooling in the fourteenth century, culminating in about 1340-1350."
At least one attempt (Guiot, 1992) has been made to combine European docu- mentary evidence with tree-tings and ice-core data. The only documentary record used that spans a major part of the Middle Ages is the decennial estimates of temperature in Iceland, but only for the decades from A.D. 1170 to 1450; the other records covering the first part of the millennium are tree-rings for various parts of Europe and Morocco and oxygen isotope data from two Greenland ice cores, in the form of quasidecadal or even longer term means. Focussing on the region between 35 ° and 55 ° N and 10 ° W to 20 ° E, Guiot (1992) reconstructs a very cold twelfth century (circa 0.5 °C below the 1851-1979 period), values close to modem from 1200 to 1300, and between modem and 0.4 degrees below modem