Hironao Okahana, Research Associate
Jeff Allum, Director, Research and Policy Analysis
CGS Spring 2015 Research and Policy Forum
May 28, 2015
Doctoral Experience and Outcomes of URM
Students in STEM Fields: Implications for
Acknowledgements
•
The CGS publication, “Doctoral Initiative on Minority Attrition &
Completion (2015)” is based upon work supported by the
National Science Foundation
under Grant No. 1138814
(
Completion and Attrition in AGEP and non-AGEP Institutions
).
Any opinions, findings, and conclusions or recommendations
expressed in this publication are those of the authors and do not
necessarily reflect the views of the National Science Foundation.
Acknowledgements
•
The project also benefited from participation of the following 21
institutions: Brown University; Drexel University; Florida
International University; Florida State University; Loyola
University Chicago; Mississippi State University; New Mexico
State University; North Carolina State University; Northwestern
University; Princeton University; Texas A&M University; the
University of California, Irvine; the University of California, San
Diego; the University of Central Florida; the University of
Georgia; the University of Illinois, Urbana-Champaign; the
University of Iowa; the University of Maryland, Baltimore
County; the University of Mississippi; the University of Missouri;
and the University of South Florida
Project Background
•
The project builds on the previous CGS PhD Completion Project and aims to
further our understanding of completion and attrition of URM STEM doctoral
students.
•
More specifically, the following research questions were asked in this report:
•
RQ1. What are the completion and attrition rates for URM students in STEM
doctoral programs at the participating institutions?
•
RQ2. Do these URM STEM doctoral completion and attrition rates vary by
student characteristics?
•
RQ3. How have these completion and attrition rates changed over time?
•
RQ4. What are the times-to-degree and times-to-attrition for URM students in
STEM doctoral programs at the participating institutions?
•
RQ5. What activities or initiatives have been implemented by participating
institutions to facilitate completion of STEM doctoral programs among URM
students?
•
RQ6. What activities and initiatives enhance success, in terms of completion,
Project Background (Cont.)
•
With support and active participation from 21 institutions, DIMAC
complied the largest data of its kind that includes:
•
Over 7,500 student records,
•
Over 1,600 URM STEM doctoral students surveyed, and
•
Over 320 URM STEM doctoral students participated in focus groups.
•
The project, through data collection exercises and site visits, facilitated
campus conversations about how to better support URM STEM
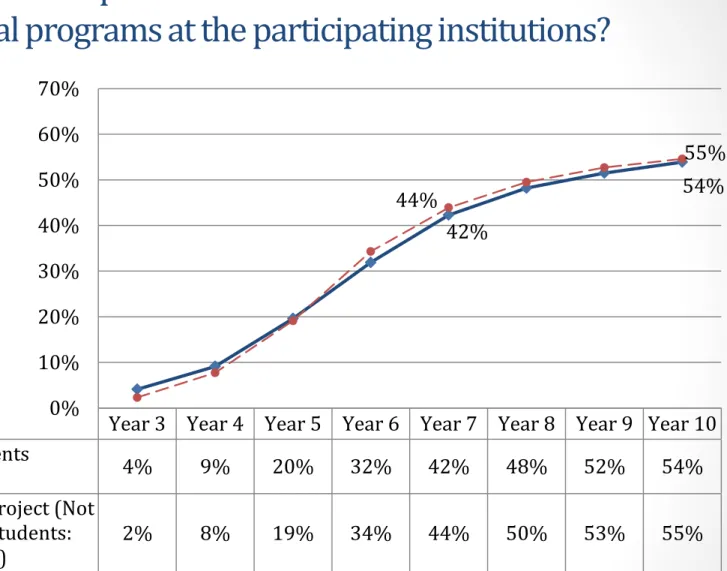
RQ1. What are the completion and attrition rates for URM students
in STEM doctoral programs at the participating institutions?
Year 3 Year 4 Year 5 Year 6 Year 7 Year 8 Year 9 Year 10
DIMAC URM Students
(N=2,530)
4%
9%
20%
32%
42%
48%
52%
54%
PhD Completion Project (Not
Including Int'l Students:
N=5,546)
2%
8%
19%
34%
44%
50%
53%
55%
42%
54%
44%
55%
0%
10%
20%
30%
40%
50%
60%
70%
Figure 1 10-Year STEM Doctoral Completion Rates. Reprinted from “Data Sources: Highlights from the Doctoral Initiative on Minority Attrition and Completion,” by J. Allum and H. Okahana, 2015,
GradEdge, 4(4), p.4. Copyright 2015 by the Council of Graduate Schools. Reprinted with permission.
RQ2. Do these URM STEM doctoral completion and
attrition rates vary by student characteristics?
0%
10%
20%
30%
40%
50%
60%
70%
Social & behavioral sciences
Physical & mathematical…
Life sciences
Engineering
No prior Master's
w/ prior Master's
Black/African American
Hispanic/Latino
Men
Women
All URM students (N=2,530)
52%
45%
63%
56%
52%
57%
50%
58%
52%
56%
54%
Data Source: Council of Graduate Schools, Doctoral Initiative on Minority Attrition and Completion, 2015
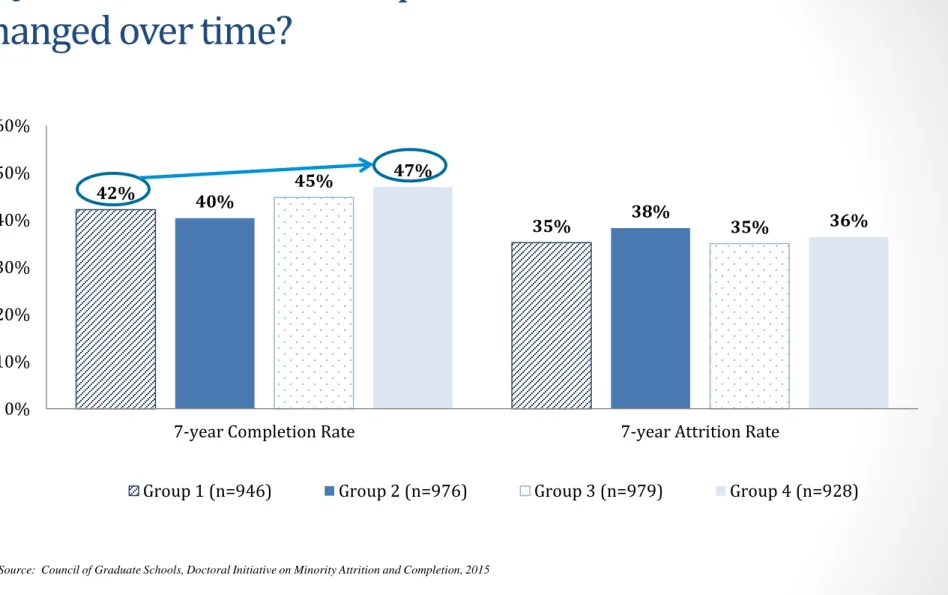
RQ3. How have these completion and attrition rates
changed over time?
42%
35%
40%
45%
38%
35%
47%
36%
0%
10%
20%
30%
40%
50%
60%
7-year Completion Rate
7-year Attrition Rate
Group 1 (n=946)
Group 2 (n=976)
Group 3 (n=979)
Group 4 (n=928)
Data Source: Council of Graduate Schools, Doctoral Initiative on Minority Attrition and Completion, 2015
Figure 3.5 Seven-year Completion and Attrition Rates by Academic Year Groups. Reprinted from
Doctoral Initiative on Minority Attrition and Completion (p.22), by R. Sowell, J. Allum, and H. Okahana, 2015, Washington, DC: Council of Graduate Schools. Copyright 2015 by the Council of Graduate Schools. Reprinted with permission.
RQ4. What are the times-to-degree and times-to-attrition
for URM students in STEM doctoral programs at the
participating institutions?
23 24 21 24 21 24 21 18 19 20 21 22 23 24 25Median Time-to-Attrition (Months)
Data Source: Council of Graduate Schools, Doctoral Initiative on Minority Attrition and Completion, 2015
66 69 64 68 64 69 60 50 55 60 65 70 75
Median Time-to-Degree (Months)
Data Source: Council of Graduate Schools, Doctoral Initiative on Minority Attrition and Completion, 2015
Figure 3.12 Median to-Degree by Select Student and Institutional Characteristics & Figure 3.14 Median Time-to-Attrition by Select Student and Institutional Characteristics. Reprinted from Doctoral Initiative on Minority Attrition and Completion (p.28 & 29), by R. Sowell, J. Allum, and H. Okahana, 2015, Washington, DC: Council of Graduate Schools. Copyright 2015 by the Council of Graduate Schools. Reprinted with permission.
RQ5. What activities or initiatives have been implemented
by participating institutions to facilitate completion of
STEM doctoral programs among URM students?
19% 23% 26% 28% 36% 36% 73% 79% 80% 86% 86% 88% 89% 94%
Grant faculty mentoring awards Provide faculty record of advisees' success in program to students Offer new faculty advising/mentoring workshops Provide web-based mentoring resource for faculty Provide targeted mentoring for ABD students Provide peer mentoring program Use early research experiences as mentoring tools Provide information on changing advisors Conduct annual student evaluations (preferably written) Assign designated advisor upon enrollment Provide graduate handbook to students Offer a clear process for selection/assignment of advisors Permit students to have multiple faculty mentors (especially for… Hold program/department orientation for new graduate students
% Programs with a Practice in Place as of Summer 2012
Data Source: Council of Graduate Schools, Doctoral Initiative on Minority Attrition and Completion, 2015
Figure P.2 Summary of Advising and Mentoring Related Practices and Procedures. Reprinted from
Online Appendices for the DIMAC Project, by R. Sowell, J. Allum, and H. Okahana, 2015, Retrieved from http://cgsnet.org/online-appendices-dimac-project. Copyright 2015 by the Council of Graduate Schools. Reprinted with permission.
RQ5. What activities or initiatives have been implemented
by participating institutions to facilitate completion of
STEM doctoral programs among URM students?
•
Graduate schools are engaged in long-standing efforts to
promote URM student success; however, they are often
early interventions that focus on recruitment, selection,
and 1
st
year transition.
•
In latter stages of the doctoral process, students often rely
on more informal support mechanisms, such as peer
supports, mentorships, advocates/champions, and
personal determination.
•
Students are generally satisfied with support and
interventions offered by graduate programs and faculty
members; however, they seem to grow skeptical in latter
stages of the doctoral process.
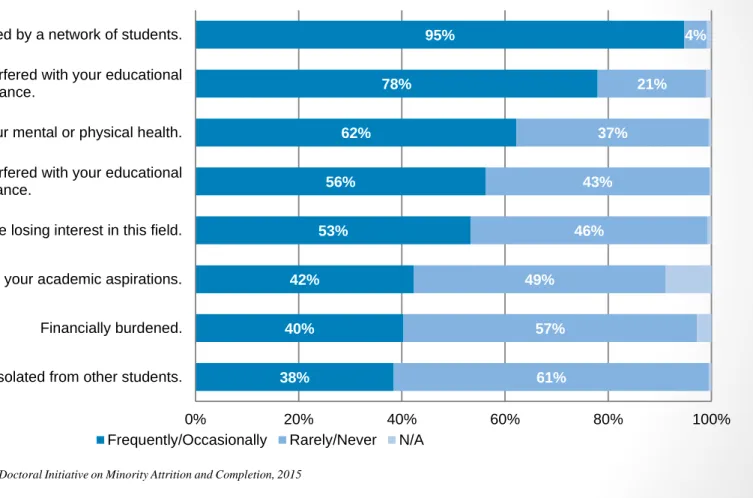
RQ6. What activities and initiatives enhance success, in
terms of completion, for URM students in STEM doctoral
programs?
38% 40% 42% 53% 56% 62% 78% 95% 61% 57% 49% 46% 43% 37% 21% 4%0% 20% 40% 60% 80% 100%
Isolated from other students. Financially burdened. Your family fully supports your academic aspirations. As though you are losing interest in this field. Your family responsibilities interfered with your educational
performance.
Worried about your mental or physical health. Your work responsibilities interfered with your educational
performance.
Supported by a network of students.
Frequently/Occasionally Rarely/Never N/A
Data Source: Council of Graduate Schools, Doctoral Initiative on Minority Attrition and Completion, 2015
Figure 4.2 URM Doctoral Student Responses to Survey Questions on Graduate Student Experience. Reprinted from Doctoral Initiative on Minority Attrition and Completion (p.39), by R. Sowell, J. Allum, and H. Okahana, 2015, Washington, DC: Council of Graduate Schools. Copyright 2015 by the Council of Graduate Schools. Reprinted with permission.
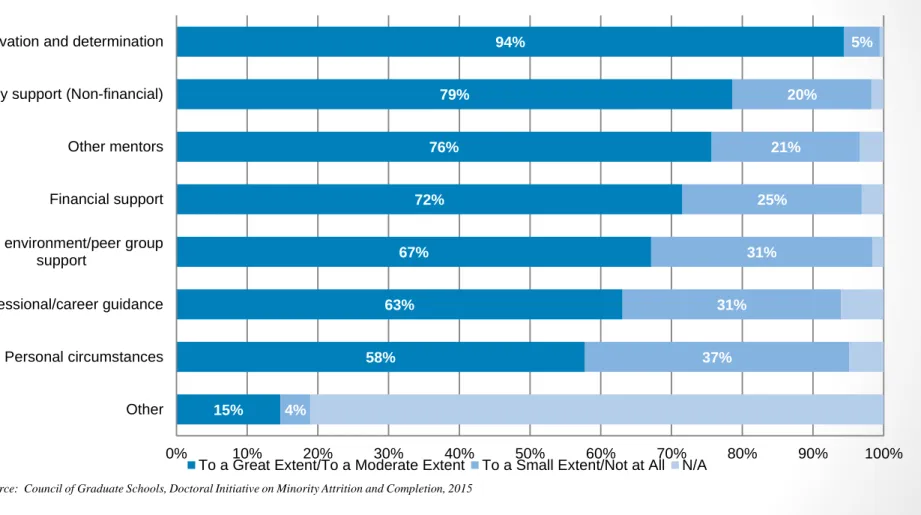
RQ6 (Cont.): Informal support mechanisms, such as peer supports,
mentorships, advocates/champions, and personal determination
play an important role.
15% 58% 63% 67% 72% 76% 79% 94% 4% 37% 31% 31% 25% 21% 20% 5%
0% 10% 20% 30% 40% 50% 60% 70% 80% 90% 100%
Other Personal circumstances Professional/career guidance Social environment/peer group
support
Financial support Other mentors Family support (Non-financial) Motivation and determination
To a Great Extent/To a Moderate Extent To a Small Extent/Not at All N/A
Data Source: Council of Graduate Schools, Doctoral Initiative on Minority Attrition and Completion, 2015
Figure 4.4 URM Doctoral Student Responses to Survey Questions on Program Personal Affecting Achievement of Degree Objectives. Reprinted from Doctoral Initiative on Minority Attrition and Completion (p.40), by R. Sowell, J. Allum, and H. Okahana, 2015, Washington, DC: Council of Graduate Schools. Copyright 2015 by the Council of Graduate Schools. Reprinted with permission.
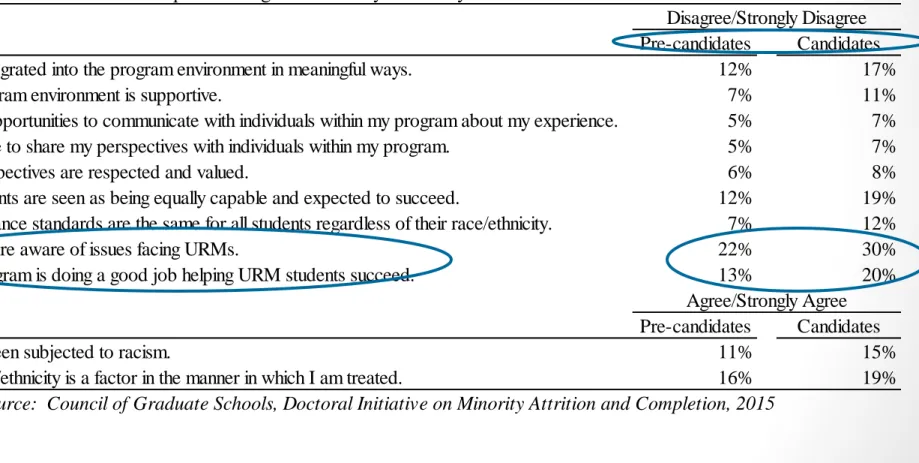
RQ6 (Cont.): Students are generally satisfied with support and
interventions offered by graduate programs and faculty members;
however, they seem to grow skeptical in latter stages of the doctoral
process.
Table 4.1 URM Students’ Perception of Program Climate by Candidacy Status
Pre-candidates
Candidates
I feel integrated into the program environment in meaningful ways.
12%
17%
My program environment is supportive.
7%
11%
I have opportunities to communicate with individuals within my program about my experience.
5%
7%
I am able to share my perspectives with individuals within my program.
5%
7%
My perspectives are respected and valued.
6%
8%
All students are seen as being equally capable and expected to succeed.
12%
19%
Performance standards are the same for all students regardless of their race/ethnicity.
7%
12%
Faculty are aware of issues facing URMs.
22%
30%
This program is doing a good job helping URM students succeed.
13%
20%
Pre-candidates
Candidates
I have been subjected to racism.
11%
15%
My race/ethnicity is a factor in the manner in which I am treated.
16%
19%
Data Source: Council of Graduate Schools, Doctoral Initiative on Minority Attrition and Completion, 2015
Agree/Strongly Agree
Disagree/Strongly Disagree
Table 4.1 URM Students’ Perception of Program Climate by Candidacy Status. Reprinted from
Doctoral Initiative on Minority Attrition and Completion (p.41), by R. Sowell, J. Allum, and H. Okahana, 2015, Washington, DC: Council of Graduate Schools. Copyright 2015 by the Council of Graduate Schools. Reprinted with permission.
RQ6 (Cont.): Students are generally satisfied with support and
interventions offered by graduate programs and faculty members;
however, they seem to grow skeptical in latter stages of the doctoral
process.
Table 4.2 URM Graduate Student Experience by Candidacy Status
Pre-candidates
Candidates
As though you are losing interest in this field.
52%
55%
Your work responsibilities interfered with your educational performance.
78%
78%
Financially burdened.
39%
42%
Your family responsibilities interfered with your educational performance.
55%
58%
Worried about your mental or physical health.
59%
65%
Isolated from other students.
32%
45%
Pre-candidates
Candidates
Your family fully supports your academic aspirations.
48%
49%
Supported by a network of students.
5%
4%
Data Source: Council of Graduate Schools, Doctoral Initiative on Minority Attrition and Completion, 2015
Rarely/Never
Frequently/Occasionally
Table 4.2 URM Graduate Student Experience by Candidacy Status. Reprinted from Doctoral Initiative on Minority Attrition and Completion (p.42), by R. Sowell, J. Allum, and H. Okahana, 2015, Washington, DC: Council of Graduate Schools. Copyright 2015 by the Council of Graduate Schools. Reprinted with permission.