Creating a Competitive
Edge with Data
Today’s highly-connected and data-driven world is having an enormous impact on the retail industry. The retail environment is becoming more instrumented, providing the information retailers need to respond to what’s happening in the store and beyond, like community events, weather conditions, social media postings, and competitor actions (e.g., pricing and promotions).
Store-Based Insights
Retailers have been using data analytics to generate business intelligence for years. But the availability of more powerful tools and access to more information from inside and outside of the store is enabling amazing shopping experiences that help customers better connect with brands and retailers. With a unique insight into customer preferences, social media impact, and inventory staging throughout the supply chain, forward-thinking retailers can simultaneously increase sales and operations performance.
The end-to-end customer experience is an immersive journey through which consumers dream, discover, browse, investigate, and purchase products; and retailers cement relationships with post-sales support and informative emails, text messages, and other communications. At each step, retailers can better serve customers by gathering and analyzing data that help them offer the right product at the right price, time, and place. Making it easier to put the necessary infrastructure in place, Intel offers professional consulting, tools, and computing platforms that can produce tangible benefits, such as:
• Increase sales per visit with a deeper understanding of customers’ purchase patterns. • Learn about new sales opportunities by identifying unexpected trends from social media. • Improve inventory management with greater visibility into the product pipeline.
This information is being used to captivate customers with compelling, personalized shopping experiences that include directed promotions, product recommendations, and other services that make in-store shopping more exciting. Brick-and mortar stores are now taking a page from the online retailer playbook – use data analytics to connect with and retain customers. Analytics also plays a key role in turning physical stores into virtual warehouses that can ship products to customers in less time and at lower cost than the centralized warehouses of online retailers.
Transforming the End-to-End
Customer Experience
Retailers can deliver the right product at the right price, time,
and place using store-based insights uncovered by data analytics.
Key Benefits
• Increase sales per visit by promoting complementary products customers are likely to purchase.
• Ensure sufficient complementary product stock is on-hand to avoid lost sales.
• Get customers to try something new by providing them information on new products of interest.
Challenge 2: Learn About New Sales Opportunities
Thanks to social media and Internet postings, some products have unexpectedly gone viral because a celebrity or expert endorsed them. In the U.S., a popular medical doctor with a health-oriented television show and a very large following on Twitter* recommended raspberry
ketone pills to help reduce weight,1
which caused a run on the product at
Applying Data Analytics
in the Retail Store
Working with retailers and brands across the industry, Intel conducted a series of studies on large datasets from the Natural Food industry. The objective was to understand and measure how data analytics could help identify complementary products, recognize new sales trends, and improve supply chain management. The results are described in the next three sections:
Challenge 1: Increase Sales per Visit
It’s possible to boost sales with cross-selling techniques that encourage customers to spend a little more. But in order to do this, a retailer must have a better understanding of customer buying patterns for complementary products. These are insights that can be discovered with data analytics performing product adjacency analysis.
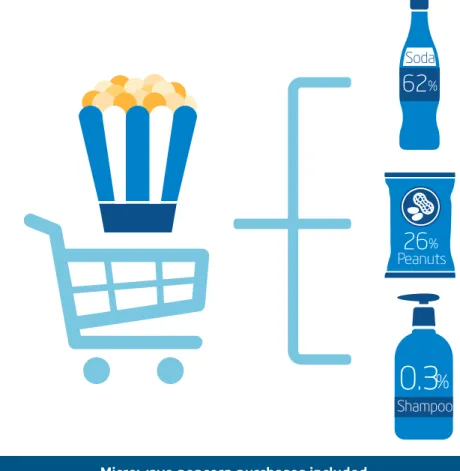
Figure 1 shows a simple product adjacency example, indicating a customer buying microwave popcorn will also buy soda 62 percent of the time, peanuts 26 percent of the time, and shampoo hardly ever, because it bears no relationship to popcorn purchases. Data analysis on purchase receipts can identify several critical relationships, including how often products are typically purchased together. This information enables retailers to:
• Run promotions that take advantage of the most effective cross selling opportunities.
• Determine which products should be stocked together.
• Avoid out-of-stocks on complementary products during promotions.
• Deliver personalized messages recommending related products.
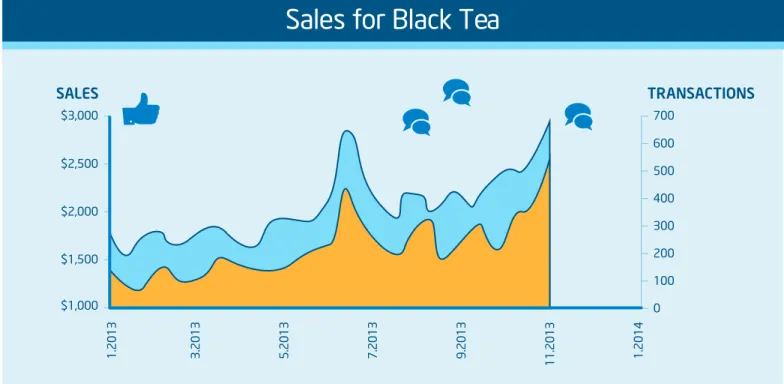
health stores and ultimately led to empty shelves. Figure 2 shows other natural food products the doctor talked about on social media, where the size of the bubble is proportional to the number of postings. The tool that created Figure 2 also lets users pull up the social media postings and view a word cloud showing which other words are used most prominently in the postings. Retailers can use data analytics to get a forewarning about potential increasing demand based on a tweet or other posting with keywords related to their offerings. For example, it may be possible to give store buyers enough lead time about products quickly gaining in popularity after analyzing social media data. This is illustrated in Figure 3, where following two social media postings about black tea in the August-September timeframe, in the August-September timeframe, the number of transactions (blue) and sales (orange) for the product jumped. Unfortunately,
Figure 1. Product Adjacency Analysis.
Microwave popcorn purchases included...
Peanuts
Soda
62
%26
%Shampoo
0.3
Raw Ginger Lemon
Cherry Juice Beet Root Juice Pumpkinseed Powder Wakame Yacon Syrup Portobello Mushrooms Oyster Mushrooms Maitake Mushrooms Enoki Mushrooms Shitake Mushrooms Whey Protein Ginko Biloba Cocoa Panca Astrag Cocoa Hemp Horseradish Whole Grains White Tea Quinoa Frozen Greek Yogurt Licorice Extract Flaxseed Oil Green Tea Banana Leaf Tea Aloe Juice Black Tea Crimini Mushrooms Cashews Papaya Seltzer Blueberries Vinegar Aspirin Mulberries Cinnamon Greek Yogurt
the retailer didn’t have enough inventory to meet demand, and sales dropped due to stock-outs in November. Data analytics can also identify whether trends are regional in nature so retailers are presented information relevant to their location. The conclusions drawn from data analytics also enables retailers to send customers personalized messages informing them of interesting tweets and blogs about their favorite products. This can increase the loyalty of customers who appreciate receiving relevant news on products they purchase or are considering, made possible through analytics that correlate purchase records, complementary products, and news and social media feeds.
Key Benefits
• Predict when products may go viral. • Take advantage of trends that could
dramatically boost sales.
• Identify pull-through products that will require higher stocking levels.
Challenge 3: Improve Inventory Management
In an ideal world, retailers would be able to see the entire supply chain from what’s currently on the shelf all the way back to the product’s manufacturing line. In reality, many retailers lose visibility once a product ships from the warehouse, unable to accurately track what’s on the truck, in the back room,
on the shelves, on display, expired, or in the return bin. This is where data analytics can help. It connects the dots between order, inventory, and sales, enabling store buyers to maximize profits by matching orders to predicted sales, thus minimizing carrying costs while increasing turns.
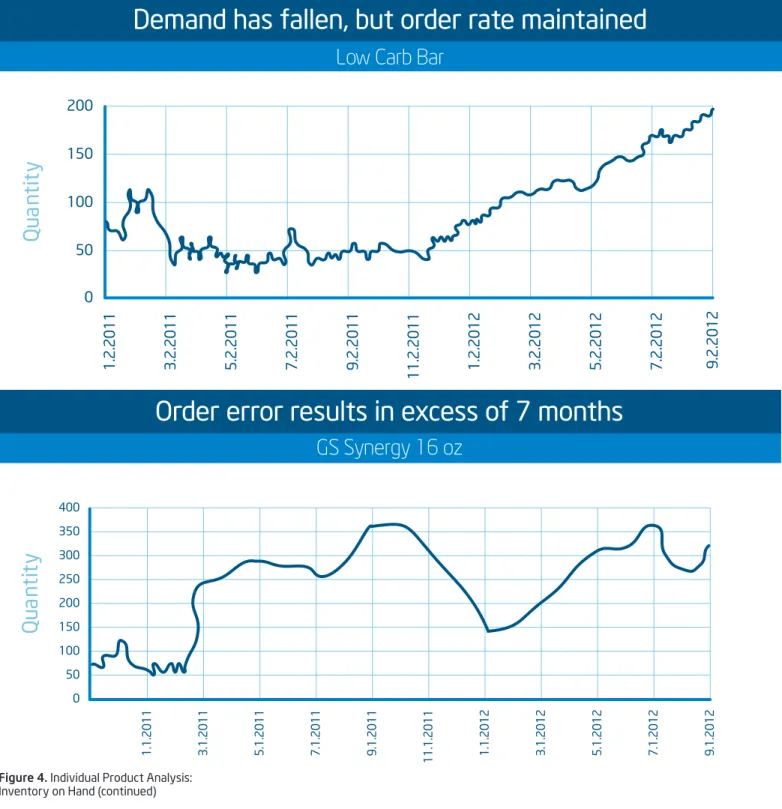
Charts like those in Figure 4 help buyers better manage their in-store inventory. The first chart is an example of excellent inventory management because supply and demand is balanced, indicated by consistent and moderate inventory levels. In contrast, the second chart shows high inventory levels that are increasing, and the third chart indicates the buyer made an error by ordering an excessive quantity of product that took seven months to move. To avoid inventory issues, such as over-stock or out-of stock situations, data analytics could be used to warn buyers when new order quantities are out of line with historic or recent sales trends. This capability requires an accurate accounting of product quantities throughout the retail environment; however, generating actionable data can be difficult when data (e.g., order, inventory, and sales) is stored in a wide variety of formats across various systems. Big data analytics was developed to solve these types of issues since it reconciles format differences in supply chain data. Once this is done, retail buyers can make economic-based reordering decisions by considering handling cost, order costs, and average daily demand.
Key Benefits
• Minimize carrying costs by reducing over-stocks.
• Avoid lost sales caused by out-of stocks Figure 2. Social Media Bubble Chart
Figure 3. Social Media Increases Demand for Black Tea
Figure 4. Individual Product Analysis: Inventory on Hand
Example of excellent inventory management
Think Peanut Butter
7.7.2011
60
50
40
30
20
10
0
8.7.2011 9.7.2011
10.7.2011 11.7.2011 12.7.2011 1.7.2012 2.7.2012 3.7.2012 4.7.2012 5.7.2012 6.7.2012 7.7.2012 8.7.2012 9.7.2012
Sales for Black Tea
1.2013
$2,000 $2,500 $3,000
$1,500
$1,000
500 600 700
400 300 200 100 0
3.2013 5.2013 7.2013 9.2013 11.2013 1.2014
TRANSACTIONS
SALES
Making Analytics Easier
With Intel Consulting Services
The value of big data is the ability to unlock insights into what drives customer behavior and buying habits. To stay ahead of the curve, retailers need a platform that runs advanced data analytics on a mix of data types, thereby providing a greater understanding of customer preferences and influencers. Moving forward,
successfully applying data analytics will drive higher revenue and create a competitive advantage for retailers who successfully turn this information into personalized shopping experiences. Working to make implementing big data easier, Intel has a team of experts who create data analytics applications for retailers so they can focus on solving business problems instead of on system
development. Intel has been in the big data business for over 30 years, managing state-of-the-art manufacturing sites and complex supply chain networks. Applying this knowledge to in-store analytics, Intel data analytics consulting services yield actionable data that allows retailers and brands to respond to customers’ desires in a more responsive and predictive manner. Figure 4. Individual Product Analysis:
Inventory on Hand (continued)
Qua
nt
it
y
Order error results in excess of 7 months
GS Synergy 16 oz
1.1.2011
300 350 400
250 200 150 100 50 0
3.1.2011 5.1.2011 7.1.2011 9.1.2011
11.1.2011 1.1.2012 3.1.2012 5.1.2012 7.1.2012 9.1.2012
Demand has fallen, but order rate maintained
Low Carb Bar
1.2.2011
200
150
100
50
0
3.2.2011
5.2.2011
7.2.2011
9.2.2011
11.2.2011
1.2.2012
3.2.2012
5.2.2012
7.2.2012
9.2.2012
Qua
nt
it
1 Source: Website article, “Raspberry Ketone: Fat-Burner in a Bottle,“ www.doctoroz.com/videos/miracle-fat-burner-bottle.
INFORMATION IN THIS DOCUMENT IS PROVIDED IN CONNECTION WITH INTEL PRODUCTS. NO LICENSE, EXPRESS OR IMPLIED, BY ESTOPPEL OR OTHERWISE, TO ANY INTELLECTUAL PROPERTY RIGHTS IS GRANTED BY THIS DOCUMENT. EXCEPT AS PROVIDED IN INTEL’S TERMS AND CONDITIONS OF SALE FOR SUCH PRODUCTS, INTEL ASSUMES NO LIABILITY WHATSOEVER AND INTEL DISCLAIMS ANY EXPRESS OR IMPLIED WARRANTY, RELATING TO SALE AND/OR USE OF INTEL PRODUCTS INCLUDING LIABILITY OR WARRANTIES RELATING TO FITNESS FOR A PARTICULAR PURPOSE, MERCHANTABILITY, OR INFRINGEMENT OF ANY PATENT, COPYRIGHT OR OTHER INTELLECTUAL PROPERTY RIGHT.
A “Mission Critical Application” is any application in which failure of the Intel Product could result, directly or indirectly, in personal injury or death.
SHOULD YOU PURCHASE OR USE INTEL’S PRODUCTS FOR ANY SUCH MISSION CRITICAL APPLICATION, YOU SHALL INDEMNIFY AND HOLD INTEL AND ITS SUBSIDIARIES, SUBCONTRACTORS AND AFFILIATES, AND THE DIRECTORS, OFFICERS, AND EMPLOYEES OF EACH, HARMLESS AGAINST ALL CLAIMS COSTS, DAMAGES, AND EXPENSES AND REASONABLE ATTORNEYS’ FEES ARISING OUT OF, DIRECTLY OR INDIRECTLY, ANY CLAIM OF PRODUCT LIABILITY, PERSONAL INJURY, OR DEATH ARISING IN ANY WAY OUT OF SUCH MISSION CRITICAL APPLICATION, WHETHER OR NOT INTEL OR ITS SUBCONTRACTOR WAS NEGLIGENT IN THE DESIGN, MANUFACTURE, OR WARNING OF THE INTEL PRODUCT OR ANY OF ITS PARTS.
Intel may make changes to specifications and product descriptions at any time, without notice. Designers must not rely on the absence or characteristics of any features or instructions marked “reserved” or “undefined”. Intel reserves these for future definition and shall have no responsibility whatsoever for conflicts or incompatibilities arising from future changes to them. The information here is subject to change without notice. Do not finalize a design with this information. The products described in this document may contain design defects or errors known as errata which may cause the product to deviate from published specifications. Current characterized errata are available on request. Contact your local Intel sales office or your distributor to obtain the latest specifications and before placing your product order. Copies of documents which have an order number and are referenced in this document, or other Intel literature, may be obtained by calling 1-800-548-4725, or go to: http://www.intel.com/design/literature.htm The TCO or other cost reduction scenarios described in this document are intended to enable you to get a better understanding of how the purchase of a given Intel product,
combined with a number of situation-specific variables, might affect your future cost and savings. Circumstances will vary and there may be unaccounted-for costs related to the use and deployment of a given product. Nothing in this document should be interpreted as either a promise of or contract for a given level of costs.
Intel®’s compilers may or may not optimize to the same degree for non-Intel microprocessors for optimizations that are not unique to Intel® microprocessors. These
optimizations include SSE2, SSE3, and SSE3 instruction sets and other optimizations. Intel does not guarantee the availability, functionality, or effectiveness of any optimization on microprocessors not manufactured by Intel. Microprocessor-dependent optimizations in this product are intended for use with Intel® microprocessors. Certain
optimizations not specific to Intel® microarchitecture are reserved for Intel® microprocessors. Please refer to the applicable product User and Reference Guides for more
information regarding the specific instruction sets covered by this notice. Notice revision #20110804
Copyright © 2014 Intel Corporation. All rights reserved. Intel, the Intel logo, and Xeon are trademarks of Intel Corporation in the U.S. and other countries. * Other names and brands may be claimed as the property of others. Printed in USA 0114/MB/ICMC/PDF Please Recycle 330038-001US
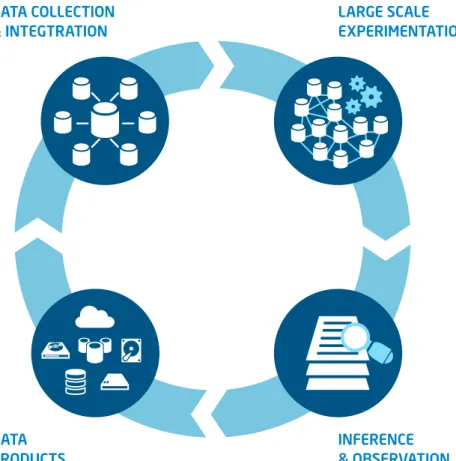
Figure 5. Intel Data Analytics Consulting Services Produce Data-Driven Insights
Intel data analytics consulting services pulls together the necessary hardware and software products capable of large-scale data collection, integration, experimentation, observation, and inference (Figure 5). These capabilities allow retailers to:
• Integrate any kind of data
• Experiment at the speed of thought • Model on deep history
• Challenge and improve inferences • Simulate products and models • Embed capabilities into the business For more information about Intel solutions for retail, visit www.intel.com/retailsolutions