Full Length Research Paper
Effect of working capital management practices on
financial performance: A study of small scale
enterprises in Kisii South District, Kenya
Nyabwanga Robert Nyamao
1*, Ojera Patrick
2, Lumumba Martin
1, Alphonce J. Odondo
2and
Otieno Simeyo
11
Department of Business and Management, Faculty of Commerce, Kisii University College, P.O. Box 408-40200, Kisii, Kenya.
2
School of Business and Economics, Maseno University, P.O. Box 333 Maseno-Kenya.
Accepted 1 September, 2011
Small scale enterprises (SSEs) are acknowledged in Kenya as significant contributors to economic growth. Despite this, it is estimated that up to 40% of the start-ups fail by year 2 and at least 60% close their doors by year 4. Working capital management is credited as one of the causes of these failures. The purpose of this study was to assess the effect of working capital management practices on the financial performance of SSEs in Kisii South District. The study adopted a cross-sectional survey research design which allowed the collection of primary quantitative data through structured questionnaires. The target population was 159 managers of 101 trading and 58 manufacturing SSEs. Stratified random sampling technique was used to obtain a sample of 113 SSEs comprising 72 trading and 41 manufacturing enterprises. The data was analyzed using both descriptive and inferential statistics. Consequently, the findings of the study were that, working capital management practices were low amongst SSEs as majority had not adopted formal working capital management routines and their financial performance was on a low average. The study also revealed that SSE financial performance was positively related to efficiency of cash management (ECM), efficiency of receivables management (ERM) and efficiency of inventory management (EIM) at 0.01 significance level. The coefficient of determination (R2) indicated that 63.4% of the variations in financial performance (FP) could be explained by changes in ECM, ERM and EIM. The study concluded that working capital management practices have influence on the financial performance of SSEs, hence there was need for SSE managers to embrace efficient working capital management practices as a strategy to improve their financial performance and survive in the uncertain business environment. The study corroborates other research findings that established a positive relationship between working capital management practices and financial performance.
Key words: Working capital management, financial performance, small scale enterprises.
INTRODUCTION
Management of working capital which aims at maintaining an optimal balance between each of the working capital components, that is, cash, receivables, inventory and payables is a fundamental part of the
*Corresponding author. E-mail:
overall corporate strategy to create value and is an important source of competitive advantage in businesses (Deloof, 2003). In practice, it has become one of the most important issues in organizations with many financial executives struggling to identify the basic working capital drivers and the appropriate level of working capital to hold so as to minimize risk, effectively prepare for uncertainty and improve the overall performance of their
businesses (Lamberson, 1995).
The existence of efficient working capital management practices can make a substantial difference between the success and failure of an enterprise and it is of particular importance to the managers of small scale enterprises, because it is they who strive for finances and the opportunity cost of finances, for them is usually on the higher side (Kwame, 2007). As established by Padachi (2006), efficient management of working capital is vital for the success and survival of the SSEs which needs to be embraced to enhance performance and contribution to economic growth.
However, as observed by Atrill (2006), there is evidence that many small scale enterprises are not very good at managing their working capital despite their high investments in current assets in proportion to their total assets and this has been a major cause of their high failure rates as compared to large businesses. According to him, majority of the small scale enterprises operate without credit control department implying that both the expertise and the information required to make sound judgments concerning terms of sales may not be available. They also lack proper debt collection procedures, hence, they tend to experience increased risks of late payment and default by debtors who tend to increase where there is an exclusive concern for growth; in this case, small scale enterprises may not be too willing to extend credit to customers who have poor credit risks. Also, in a recent study by Bowen et al. (2009) debt collection was identified by 55% to be among the top five major challenges facing micro and small businesses.
In Kenya, small scale enterprises are acknowledged as vital and significant contributors to economic development through their critical role in providing job opportunities, reducing poverty levels, nurturing the culture of entrepreneurship and are a vital link in the economy through their supply chain and intermediary role in trade (Oketch, 2000). According to the Economic Survey of 2006, small scale enterprises contributed over 50% of new jobs created in the year 2005 and over 20% to the GDP of the country. In recognition of this indispensable role, the government has instituted enterprise support programmes including the introduction of Women and Youth Enterprise Funds in the years 2006 and 2007 respectively to fuel the development of these enterprises. Also, many micro finance institutions have joined the foray in providing them with microcredit hence, seeing their access to microcredit increase from 7.5% in 2006 to 17.9% in 2009 (FSD Kenya, 2009). However, the International Labour Organization (2010) estimates that two-thirds of the enterprises were generating income equal to or below the minimum wage, a sobering finding that must temper one’s enthusiasm for the growth of SSE’s as a solution to the country’s poverty and employment problems.
Despite their significance and the increased efforts by the government of Kenya and other stakeholders to
ensure the success of small scale enterprises, past statistics indicate that they exhibit high birthrates and high death rates with 40% of the startups failing by year two and at least 60% closing their doors by year four (Kenya National Bureau of Statistics, 2007; Fina Bank Report, 2007). Also a study by Bowen et al. (2009) established that up to 50 % of the small businesses in operation have a deteriorating performance and are said to stagnate at ‘small’ level hence do not progressively grow into medium or even large enterprises as envisaged in their conceptual plans. In a study by Bowen et al. (2009), up to 53% of the respondents identified lack of working capital caused by the inability of the owners to manage their working capital efficiently as one of the greatest challenge that SSEs face.
As observed by Mead (1998), the health of the economy as a whole has a strong relationship with the health and nature of small enterprise sector and given their importance to a nation's economic growth and the role that they play in poverty reduction, an understanding of the problems negatively affecting small businesses in Kenya is a vital first step in managing and avoiding the massive failure of these small businesses (ILO, 2010).
Based on this background, the study was designed to assess the effect of working capital management practices on the financial performance of SSEs in Kisii South district, Kenya. The study was guided by the following specific objectives:
1. To establish the working capital management practices of small scale enterprises in Kisii South District.
2. To evaluate the financial performance of small scale enterprises in Kisii South District.
3. To establish the relationship between working capital management practices and financial performance of small scale enterprises in Kisii South District.
LITERATURE REVIEW
Working capital management is a very important component of corporate finance because it directly affects the liquidity, profitability and growth of a business and is important to the financial health of businesses of all sizes as the amounts invested in working capital are often high in proportion to the total assets employed (Atrill, 2006). It involves the planning and controlling of current assets and liabilities in a manner that eliminates the risk of inability to meet short-term obligations and avoid excessive investments in these assets (Lamberson, 1995). This management of short-term assets is as important as the management of long-term financial assets, since it directly contributes to the maximization of a business’s profitability, liquidity and total performance. Consequently, businesses can minimize risk and improve the overall performance by understanding the role and drivers of working capital (Lamberson, 1995). Also, as
established by several researchers (Peel and Wilson, 1997; Padachi, 2006; Kotut, 2003) efficient management of working capital is pivotal to the health and performance of small firms hence their view that firms should employ the use of efficient working capital management practices as a strategy of improving their value. The investigation on the working capital management is focused on three constructs: cash management practices, receivables management practices and inventory management practices.
Cash management is the process of planning and controlling cash flows into and out of the business, cash flows within the business, and cash balances held by a business at a point in time (Pandey, 2004). Efficient cash management involves the determination of the optimal cash to hold by considering the trade-off between the opportunity cost of holding too much cash and the trading cost of holding too little (Ross et al., 2008) and as stressed by Atrill (2006), there is need for careful planning and monitoring of cash flows over time so as to determine the optimal cash to hold. A study by Kwame (2007) established that the setting up of a cash balance policy ensures prudent cash budgeting and investment of surplus cash. This finding agree with the findings by Kotut (2003) who established that cash budgeting is useful in planning for shortage and surplus of cash and has an effect on the financial performance of the firms. The assertion by Ross et al. (2008) that reducing the time cash is tied up in the operating cycle improves a business’s profitability and market value furthers the significance of efficient cash management practices in improving business performance.
Provision of trade credit is normally used by businesses as a marketing strategy to expand or maintain sales (Pandey, 2004). Efficient receivables management augmented by a shortened creditor’s collection period, low levels of bad debts and a sound credit policy often improves the businesses’ ability to attract new customers and accordingly increase financial performance hence the need for a sound credit policy that will ensure that SSEs’ value is optimized (Ross et al., 2008). Costs of cash discounts, losses of bad debts and costs of managing credit and credit collections constitute the carrying costs associated with granting a credit which increase when the amount of receivables granted are increased. Lost sales resulting from not granting credit constitute the opportunity cost which decrease when the amounts of receivables are increased. Firms that are efficient in receivables management should determine their optimal credit which minimizes the total costs of granting credit (Ross et al., 2008).
As observed by Michalski (2007) in his study, an increase in the level of accounts receivables in a firm increases both the net working capital and the costs of holding and managing accounts receivables and both lead to a decrease in the value of the firm. A study by Lazaridis and Dimitrios (2005) found out that firms who
pursue increase in their accounts receivables to an optimal level increase their profitability resulting from increase sales and market share. A study by Juan and Martinez (2002) emphasized that firms can create value by reducing their number of days of accounts receivable, thus confirmed the finding of Deloof (2003) who established that the length of receivables collection period has a negative effect on a firm’s performance. A study by Sushma and Bhupesh (2007) also affirmed that, putting in place a sound credit policy ensures proper debt collection procedures and is pivotal in improving efficiency in receivables management hence the performance of firms.
Efficient inventory management practices should answer the questions: how much should be ordered? And when should it be ordered? These questions relate to the problem of determining the economic order quantity and the problem can be answered by the analysis of the costs of maintaining certain levels of inventory as there are costs involved in holding too much stock and there are also costs involved in holding too little, hence the need to put in place an effective stock management system to ensure reliable sales forecasts to be used in stock ordering purposes (Atrill, 2006). As Ross et al. (2008) observed the Economic Order Quantity model as one of the approaches of determining the optimal inventory level takes into account the inventory carrying costs, inventory shortage costs and total costs helps in the determination of the appropriate inventory levels to hold.
Maintaining optimal inventory levels reduces the cost of possible interruptions or of loss of business due to the scarcity of products, reduces supply costs and protects against price fluctuations. The inventory conversion period has a negative effect on a business’s performance. For instance, shortening the inventory conversion period could increase stock out costs of inventory which results in losing sales opportunities and leads to poor performance (Deloof, 2003). Managers of firms should therefore keep their inventory to an optimum level since mismanagement of inventory will lead to tying up excess capital at the expense of profitable operations (Lazaridis and Dimitrios, 2005).
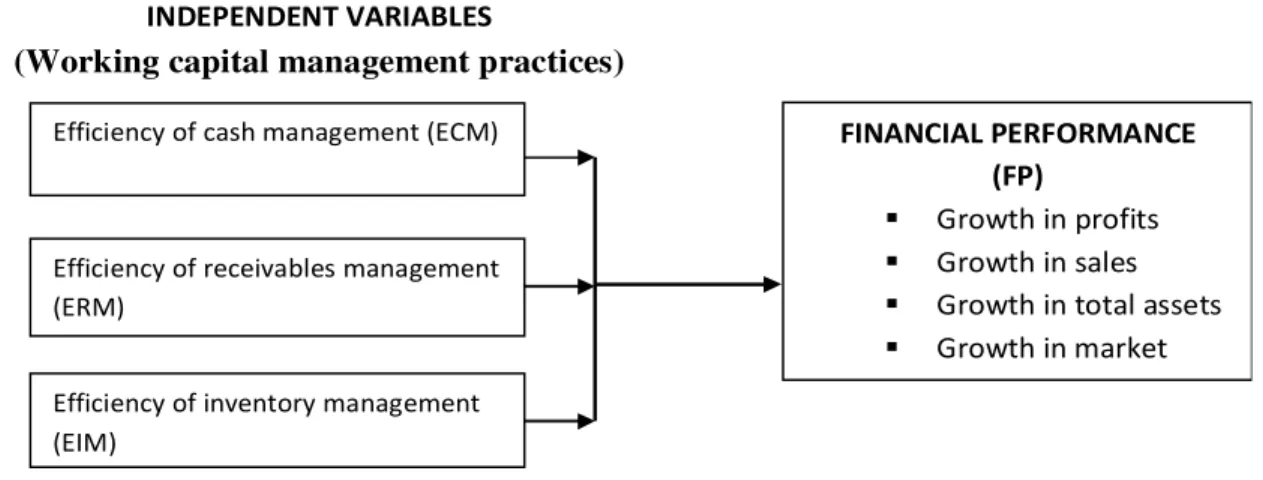
The literature on working capital management practices identifies efficiency of cash management, efficiency of receivables management and efficiency of inventory management as determinants of financial performance model. Financial performance could therefore be improved if efficiency levels of cash, receivables and inventory management practices are increased. The model variables interrelationship can be conceptualized as shown in Figure 1.
The model hypothesizes that efficiency in working capital management practices as measured by efficiency in cash management, efficiency in receivables management and efficiency in inventory management has an influence on the growth rate of businesses’ sales, market share, profits and total assets.
INDEPENDENT VARIABLES
(Working capital management practices)
DEPENDENT VARIABLE
Efficiency of cash management (ECM)
Efficiency of receivables management (ERM)
Efficiency of inventory management (EIM)
FINANCIAL PERFORMANCE (FP)
Growth in profits
Growth in sales
Growth in total assets
Growth in market
Figure 1. Conceptual framework for the research.
METHODOLOGY
The study adopted a cross-sectional survey research design. The research design was preferred for the study since it provided a quick, efficient and accurate means of accessing information about the population and it is more appropriate where there is a lack of secondary data. In this case, secondary data on working capital management practices of small scale enterprises in Kisii South District is not available thus conducting a survey to gain such information was necessary (Oso and Onen, 2005).
The target population of the study was 159 managers of 101 trading and 58 manufacturing small scale enterprises operating within Kisii South District, are privately owned and registered by Suneka Town Council for the periods 2007 to 2010. Out of the 159 SSEs, 113 SSEs consisting of 72 trading and 41 manufacturing enterprises were selected using stratified random sampling technique to constitute the study sample. Stratification ensured that the sample accurately reflected the population on the basis of the criteria used for stratification whereas random sampling ensured that each member of the target population had an equal and independent chance of being selected (Oso and Onen, 2005).
Primary quantitative data was collected by use of self-administered structured questionnaires. The questionnaire was divided into three sections: business profile, working capital management practices and financial performance. Perceptual responses were captured in a five – point Likert scale. The content validity of the instrument was determined by the experts’ and peers’ advice whereas face validity was determined by administering the questionnaires to 10 SSEs in the neighbouring Kisii Central district. Cronbach`s coefficient alphas were computed using the formula alpha = Np/ [1+p (N-1)]; where N equals the number of items and p equals the mean interitem correlation to determine the internal consistency of the questionnaire constructs measuring efficiency in cash management, efficiency in receivables management, efficiency in inventory management and financial performance. the obtained cronbach alphas for ECM, ERM, EIM and FP were as listed in Table 1.
The alpha values are acceptable as they exceeded the 0.7 threshold as recommended by Gliem and Gliem (2003). Data was analyzed using descriptive statistics: weighted averages, mean and standard deviation. Correlation and multiple regression analysis were used to measure the nature of the relationship between financial performance and the working capital management practices. The financial performance model adopted for this study was as summarized below:
FP = β0+β1ECM+β2ERM+β3EIM+е (1)
Where: β0, β1, β2 and β3 are coefficients; ECM-Efficiency in Cash
Management; EIM- Efficiency in Inventory Management; ERM-Efficiency in Receivables Management; FP-Financial Performance indicator and e- Error variable.
RESULTS AND DISCUSSION
Working capital management practices
The first objective of this research was to establish the working capital management practices of small scale enterprises. To achieve this, the construct of working capital management was defined to constitute cash management practices, receivables management practices and inventory management practices of SSEs.
Cash management practices
Examination of cash management practices focused on the frequency of cash budgeting and target cash balance determination, occurrence of cash surplus or shortage and investment of cash surpluses.
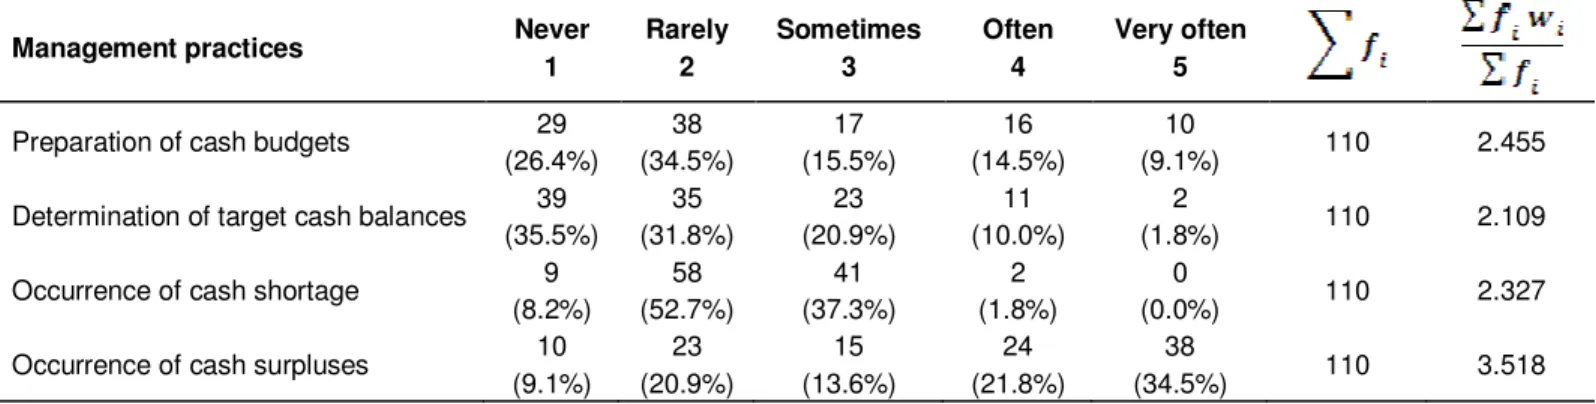
On the frequency of preparation of cash budgets, the results are as shown in Table 2 which indicates that on the average, SSE managers rarely prepared cash budgets (weighted average = 2.455). Majority of the respondents (67 respondents representing 60.9% of all respondents) seldom prepared cash budgets (score 1 and 2 on the scale). Only 26 SSEs representing 23.6% of all SSEs often prepared cash budgets (scores 4 and 5 on the scale).
The finding shows that SSEs in Kisii South District did not embraced cash budgeting as a tool to plan and control cash flows of their businesses. Contradictory views were expressed by Kotut (2003) who established that over 56.25% of the businesses studied prepared cash budgets on a daily basis and used them to plan for shortage and surplus of cash.
Table 1. Reliability of variables.
Latent variable No. of items Cronbach alpha
ECM 7 0.78
ERM 7 0.76
EIM 8 0.82
FP 4 0.85
Source: Pilot test data, 2010.
Table 2. Frequency of occurrence of the cash management practices.
Management practices Never
1 Rarely 2 Sometimes 3 Often 4 Very often 5
Preparation of cash budgets 29 (26.4%) 38 (34.5%) 17 (15.5%) 16 (14.5%) 10 (9.1%) 110 2.455
Determination of target cash balances 39 (35.5%) 35 (31.8%) 23 (20.9%) 11 (10.0%) 2 (1.8%) 110 2.109
Occurrence of cash shortage 9 (8.2%) 58 (52.7%) 41 (37.3%) 2 (1.8%) 0 (0.0%) 110 2.327
Occurrence of cash surpluses 10 (9.1%) 23 (20.9%) 15 (13.6%) 24 (21.8%) 38 (34.5%) 110 3.518
Source: Survey data (2010).
On the frequency of determination of target cash balances, the results of the study as shown in Table 2 show that on the average, 13 SSEs representing 11.8% of the SSEs indicated that they often determined their target cash balances (score 4 and 5 on the scale) as compared to 67.3% who indicated that they hardly determined their target cash balances (score 1 and 2 on the scale). The results suggest that on the average, majority of the SSEs hardly determine the appropriate amount of cash to hold. The pronouncement is consistent with a finding by Kwame (2007) who established that small firms rarely pay attention to setting up a cash-balance policy but simply consider cash-cash-balance as the result of differences in cash inflows and outflows without any guidelines. However, the finding is at variance with the finding by Waweru (2003) who established that most businesses studied had a set minimum cash balance level which guarded them against running out of cash.
On how regularly SSEs experienced cash surpluses as compared to cash shortages, Table 2 shows that on the average, SSEs experienced cash surpluses regularly and experienced cash shortages irregularly as indicated by their weighted averages of 3.518 and 2.327 respectively. Majority of the SSEs (62 SSEs representing 56.4% of all the SSEs) regularly experienced cash surpluses, compared to only 2 representing 1.8% of all SSEs that indicated that they regularly experienced cash shortages (score 4 and 5 on the scale). The finding buttresses the
assertion by Scarborough and Zimmerer (2003), that small businesses reserve cash and maintain relatively high current ratios to ensure that they do not run out of cash hence the conclusion that the management of cash surpluses rather than cash shortages is a problem for SSEs.
Table 3 also shows that 49.1% of the SSEs that experienced cash surpluses reported that they deposited it in bank accounts for interest while 7.3% reported that they had it lying idle in the business. This implies that up to 56.8% did not invest temporary cash surpluses for profit. Also, only 2 SSEs representing 1.8% of all SSEs invested their cash surpluses in financial markets. This finding supports the pronouncement by Waweru (2003), that majority of businesses do not invest their surplus cash in marketable securities. It also confirms Kwame (2007) decree that most small businesses have problems on how to invest temporary cash for profitable purposes.
Receivables management practices
On receivable management practices, respondents were asked whether they make credit sales and they put down credit guidelines for the customers and frequency of review of the levels of receivables and bad debts. Analysis of responses on how frequently SSE managers sold their product on credit, only 42 SSEs representing
Table 3. Investment of temporary cash surplus. Cash surplus investment Bank deposit Financial markets Business Expansion No cash
surpluses Nowhere Total
Frequency 54 2 33 13 8 110
Percent 49.1 1.8 30.0 11.8 7.3 100
Source: Survey data (2010).
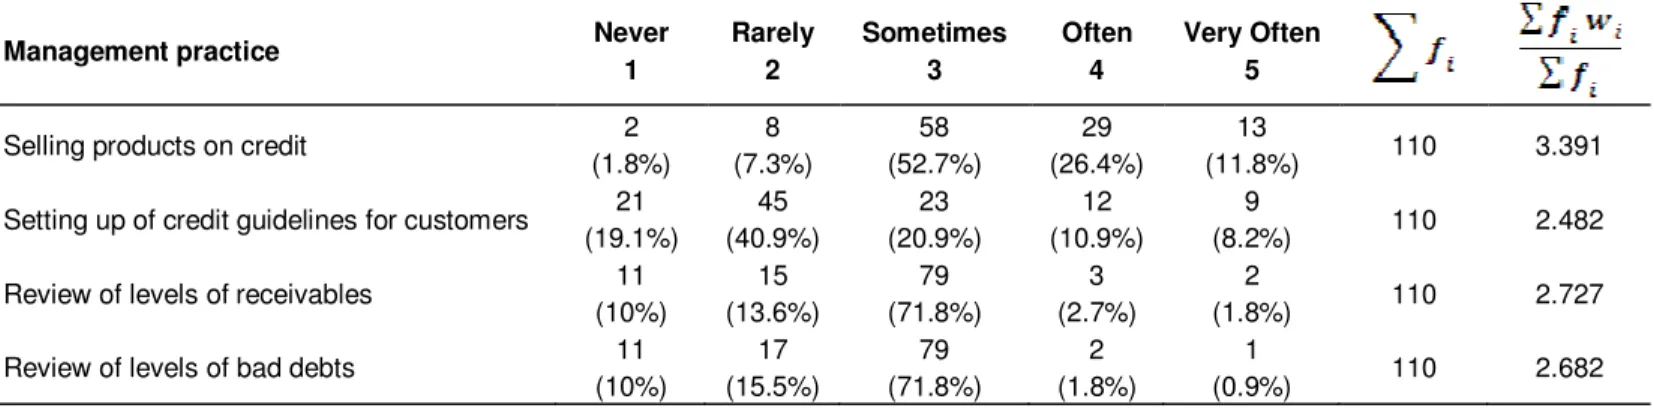
Table 3. Frequency of occurrence of the receivables management practices.
Management practice Never
1 Rarely 2 Sometimes 3 Often 4 Very Often 5
Selling products on credit 2
(1.8%) 8 (7.3%) 58 (52.7%) 29 (26.4%) 13 (11.8%) 110 3.391
Setting up of credit guidelines for customers 21 (19.1%) 45 (40.9%) 23 (20.9%) 12 (10.9%) 9 (8.2%) 110 2.482
Review of levels of receivables 11 (10%) 15 (13.6%) 79 (71.8%) 3 (2.7%) 2 (1.8%) 110 2.727
Review of levels of bad debts 11 (10%) 17 (15.5%) 79 (71.8%) 2 (1.8%) 1 (0.9%) 110 2.682
Source: Survey data (2010).
38.2% of all SSEs often sold their products on credit and only 21 SSEs representing 29.1% of all SSEs often set up credit guidelines for their credit customers. This finding suggests that selling products on credit was averagely practised for SSEs in Kisii South District and contradicts findings by Kwame (2007) which showed that small businesses always sold their products on credit. The low use of credit sales can be attributed to the lack of sound credit policies since majority (56 SSEs representing 60% of all SSEs) seem not to set credit guidelines for their credit customers. As established by Laziridis and Dimitrios (2005) pursuing reduced receivables account causes diminished financial performance for firms hence the suggestion by Juan and Martinez (2002) for firms to keep an eye on the debtors’ repayment period with a view to make it minimal.
On the frequency of review of the levels of receivables and bad debts, Table 8 shows that a substantial number of SSEs (79 SSEs which represents 71.8% of all SSEs) reviewed their levels of receivables and bad debts monthly. This finding is at variance with Kwame’s (2007) finding that most small businesses review their level of receivables and bad debts quarterly.
Inventory management practices
On inventory management, respondents were asked how frequently they prepared inventory budgets and reviewed their inventory levels; and basis upon which they
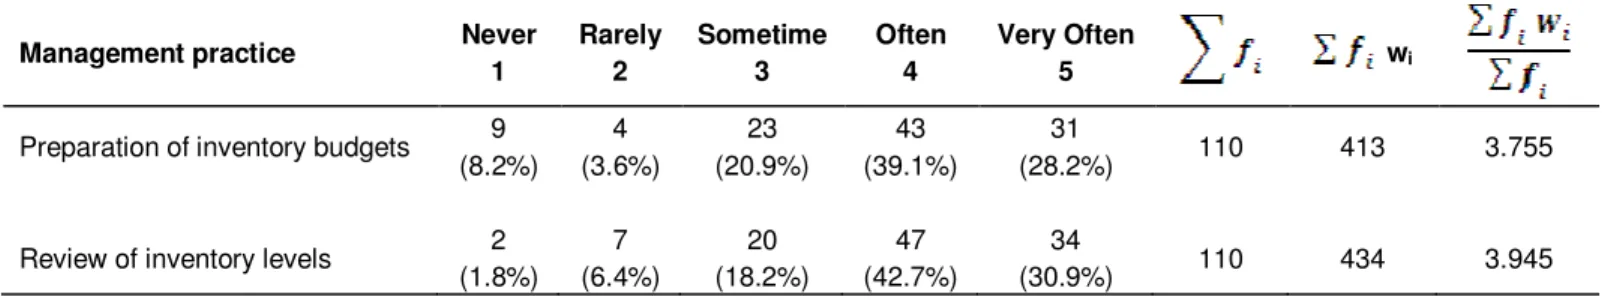
determined their inventory levels and their frequency of stock replacement. Table 4 shows that majority of the SSEs (75 SSEs representing 67.3% of all the SSEs) often prepared inventory budgets (score 4 and 5 on the scale). 81 SSEs representing 73.6% of all the SSEs often reviewed their inventory levels (score 4 and 5 on the scale). These findings suggest that preparation of inventory budgets and review of inventory levels are
regularly carried out by SSEs’
owner-managers/managers and are in agreement with findings of Kwame (2007) which established that majority of small businesses always review their inventory levels and prepare inventory budgets and which is as stressed by Lazaridis and Dimitrios (2005) that enhancing the management of inventory thus enable businesses to avoid tying up excess capital in idle stock at the expense of profitable ventures.
Although, the SSEs regularly reviewed inventory levels and prepared inventory budgets, the ability to apply theories of inventory management in inventory budgeting is very limited with a substantial number of SSEs (78 respondents representing 70.9% of all SSEs) indicated that they determined their inventory levels based on owner-manager’s/manager’s experience (Table 5). A study by Kwame (2007) established similar results which showed that up to 90% of small businesses relied on manager’s experience in their management of working capital.
The findings that majority of SSEs determined their inventory levels based on managers’ experience could be
Table 4. Frequency on inventory management practices.
Management practice Never
1 Rarely 2 Sometime 3 Often 4 Very Often 5 wi
Preparation of inventory budgets 9 (8.2%) 4 (3.6%) 23 (20.9%) 43 (39.1%) 31 (28.2%) 110 413 3.755
Review of inventory levels 2 (1.8%) 7 (6.4%) 20 (18.2%) 47 (42.7%) 34 (30.9%) 110 434 3.945
Source: Survey data (2010).
Table 5. Basis of determining inventory levels.
Parameter Number of firms Percentage
Based on theories of inventory management 6 5.5
Based on historical data 10 9.1
Based on owner/manager 's experience 78 70.9
Never determines inventory levels 16 14.5
Total 110 100
Source: Survey data (2010).
Table 6. Frequency of stock replacement orders. Very infrequently (yearly) 1 Infrequently (monthly) 2 Frequently (after every 2 weeks)
3 Very frequently (weekly) 4 Most frequently (daily) 5 N Mean 0 (0.0%) 13 (11.8%) 52 (47.3%) 31 (28.2%) 14 (12.7%) 110 3.418
Source: Survey data, 2010.
the basis for the findings that 97 SSEs representing 88.2% regularly replenished their stock (score 3, 4 and 5 on the scale) an indication that majority of the SSEs do not stock optimal quantities of stock and do not determine appropriate re-order points (Table 6).
Efficiency of working capital management practices On the efficiency of working capital management (EWCM) practices, Table 7 shows that efficiency in cash management rated lowest in average with a mean index of 18.4364 with responses deviating from this mean by a standard margin of 4.3590. This was followed by receivables management with the mean of 19.1727, with standard deviation of 4.1505, and inventory management (mean = 28.1545, Std Dev. = 6.8015) in that order. This ordering could be interpreted to mean that, SSEs were more efficient in the management of inventory. Conversely, they were less efficient in the management
of their cash. On the average, the efficiency levels were low thus indicating that a majority of the SSEs have not embraced and implemented efficient working capital management practices in their business operations. These results concur with assertions by Kwame (2007) and Peel and Wilson (1996) that small firms are not good in the management of their working capital.
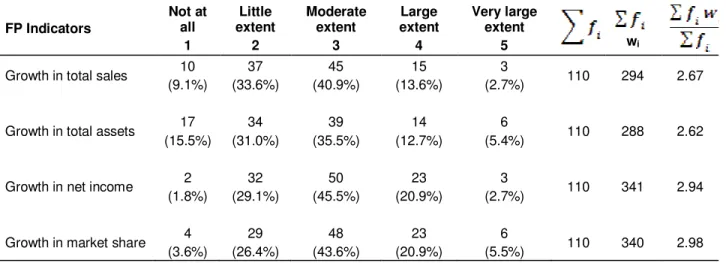
Financial performance of the small scale enterprises The second objective of this research study was to evaluate the financial performance of SSEs in Kisii South District. To achieve this, respondents were asked to rate their perceived extent of growth in their businesses’ sales, total assets, net income and market share. Table 8 indicates that on the average, the extent of growth of sales, total assets, net income and market share was moderate and had weighted averages of 2.67, 2.62, 2.94 and 2.98 respectively. However, as shown in the Table 8,
Table 7. Means and standard deviations for indexed EWCM variables.
Variable N Mean Std. Deviation Min Max
ECM 110 18.4364 4.3590 9 25
ERM 110 19.1727 4.1505 9 25
EIM 110 28.1545 6.8015 12 38
Source: Survey data (2010).
Table 8. Respondents’ perception on the extent of growth of the FP Indicators.
FP Indicators Not at all 1 Little extent 2 Moderate extent 3 Large extent 4 Very large extent 5 wi
Growth in total sales 10 (9.1%) 37 (33.6%) 45 (40.9%) 15 (13.6%) 3 (2.7%) 110 294 2.67
Growth in total assets 17 (15.5%) 34 (31.0%) 39 (35.5%) 14 (12.7%) 6 (5.4%) 110 288 2.62
Growth in net income 2 (1.8%) 32 (29.1%) 50 (45.5%) 23 (20.9%) 3 (2.7%) 110 341 2.94
Growth in market share 4 (3.6%) 29 (26.4%) 48 (43.6%) 23 (20.9%) 6 (5.5%) 110 340 2.98
Source: Survey data (2010).
a greater number of SSEs had a growth rate that could be considered low (score 1 and 2 on the scale) as compared to the number of SSEs whose growth rate could be considered high (score 4 and 5 on the scale).
The various ratings of the extent of growth of each financial indicator were summed up to obtain a single financial performance index which ranged from 4 (lowest) to 20 (highest). The higher the points a business scored, the higher its financial performance was. Table 9 shows the descriptive statistics for financial performance of the SSEs. The results show that the financial performance ranged from a minimum value of 6 to a maximum value of 15. The results also show an average financial performance index of 11.6545 with the scores deviating from the mean score by 2.0157. This average score is less than 12, hence the conclusion that the financial performance of SSEs in Kisii South District was on a low average. Similar results were established by Bowen et al. (2009) who established that over 50.9% of the businesses studied reported a deteriorating or failing performance.
The relationship between working capital management practices and financial performance The third objective of this study was to establish the relationship between the working capital management practices and the financial performance of SSEs.
Pearson’s correlation coefficients and multiple regression analysis techniques were used to address this objective.
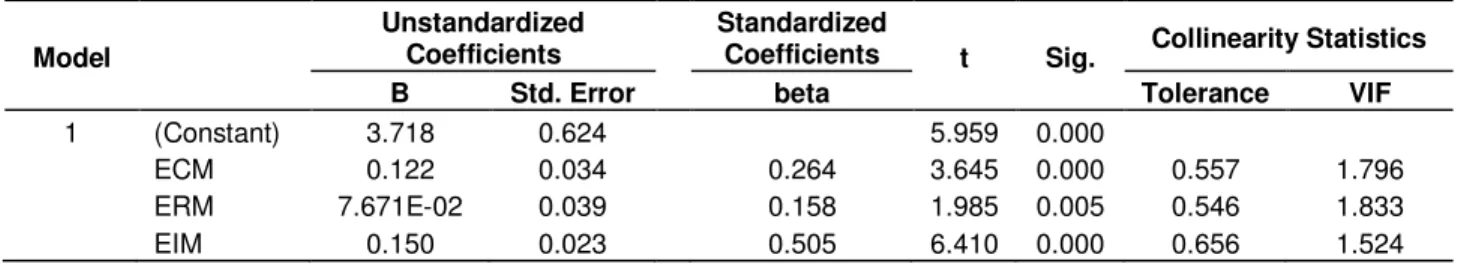
Before the correlation and regression procedures were carried out, the basic assumptions of multiple regression analysis were verified and they were satisfactorily met as follows: the concern for multicollinearity was tested by observing the variance inflation factors (VIF’s) subject to the rule of thumb that the number should be less than 10 (Thomas, 2008). All the VIF’s entries as shown in Table 11 were adequately low hence the possibility of multicollinearity did not exist. The normality of the dependent variable was checked by the use of normal probability plots (histogram and normal P-P plot) which both indicated that the residuals were normally distributed. The test for the linearity assumption was done by the use of scatter plots and none of the plots demonstrated a nonlinear pattern. Constant variance (homoscedasticity) assumption was checked by visual examination of a plot of the standardized residuals (the errors) by the regression standardized predicted value. The residuals were randomly scattered around 0 (the horizontal line) providing a relatively even distribution and hence no violations of homoscedasticity were detected. Pearson’s correlation coefficient results
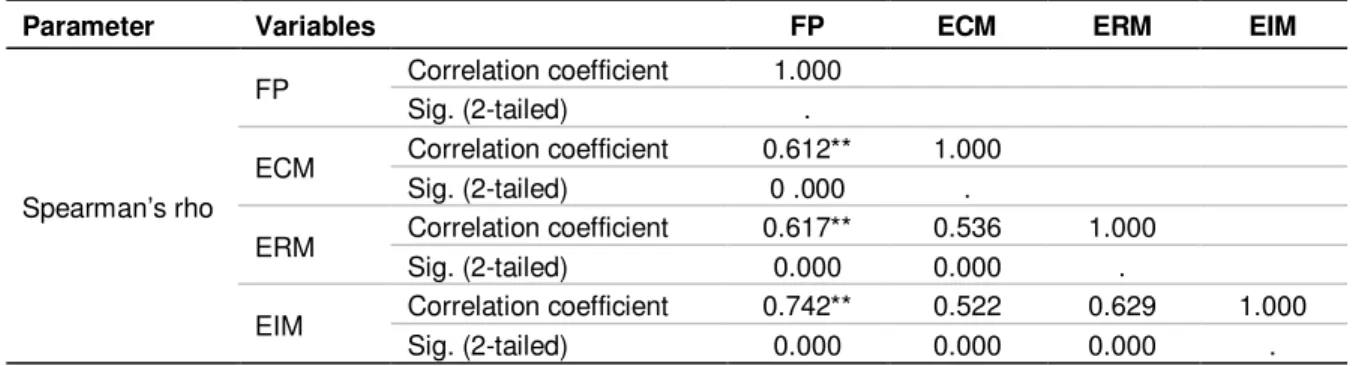
The correlation results as shown in Table 10 shows that there was a strong positive relationship between SSEs’
Table 9. Descriptive statistics for financial performance.
Variable N Mean Std. Dev Minimum Maximum
Financial performance 110 11.6545 2.0157 6 15
Source: Survey data, 2010.
Table 10. Correlation results (N=110).
Parameter Variables FP ECM ERM EIM
Spearman’s rho
FP Correlation coefficient 1.000
Sig. (2-tailed) .
ECM Correlation coefficient 0.612** 1.000
Sig. (2-tailed) 0 .000 .
ERM Correlation coefficient 0.617** 0.536 1.000
Sig. (2-tailed) 0.000 0.000 .
EIM Correlation coefficient 0.742** 0.522 0.629 1.000
Sig. (2-tailed) 0.000 0.000 0.000 .
**Correlation is significant at the 0.01 level (2-tailed). Source: Survey data (2010).
FP and ECM (R=0.612, p<0.01). Also, a strong positive relationship was established between FP and ERM (R=0.617, p<0.01). On the other hand, a very strong positive relationship was established between FP and EIM (R=0.742, p<0.01). Generally most researchers have showed that businesses’ performance is correlated positively to the working capital management practices (Padachi, 2006; Benjamin and Kamalavali, 2006; Kotut, 2003; Sushma and Bhupesh, 2007) and are therefore supported by this research finding.
Multiple regression analysis
Multiple regression analysis was used to deduce a model that could be used to explain the effect of working capital management practices on financial performance.
Table 11 shows the contribution of each variable in explaining the financial performance as shown by standardized beta values which assess the contribution of each variable towards the prediction of the dependent variable. Efficiency in inventory management had the greatest effect on financial performance with a unit change in the EIM, holding ECM and ERM constant, resulting to a 50.5% increase in financial performance, whereas efficiency in receivables management had the least effect with a unit change in ERM holding ECM and EIM constant, resulting to a 15.8% increase in financial performance. The overall equation as suggested in the conceptual framework can be represented by use of unstandardized coefficients as follows:
FP = 3.718 + 0.122ECM + 0.0767ERM + 0.150EIM. (2)
This means that even without the three variables under study, financial performance is expected to be 3.718.
Table 12 summarizes the regression model. R2 = 0.643 shows that 63.4% of the variability of financial performance could be attributed to changes in efficiency of cash management, efficiency of receivables management and efficiency of inventory management practices. Comparing the value of R2 and adjusted R2 gives a difference of 0.01 which is too small. This shows that the validity of the model is very good since its shrinkage is less than the 0.5 threshold suggested by Field (2005).
Table 12 shows the F-statistic which indicate that the set of independent variables were as a whole contributing to the variance in the dependent variable and that there was a statistically significant relationship between financial performance and the set of predictor variables (ECM, ERM and EIM) as shown by its F-statistic (F (3,106)
= 61.189, p < 0.05).
These findings indicate that there is a relatively high support for the existence of a positive significant relationship between financial performance and working capital management practices. Generally, most researchers have established a positive relationship between efficiency in working capital management practices and business performance (Kotut, 2003; Padachi, 2006; Lazaridis and Dimitrios, 2005; Kwame, 2007; Peel and Wilson, 1996). Moreover, based on the findings of this study, the central role of working capital management to the success of SSEs has been demonstrated by the empirical data from SSEs in Kisii south district. The data analysis indicated that, those businesses whose managers were more efficient in
Table 11. Regression coefficients and collinearity statistics(N=110).
Model
Unstandardized Coefficients
Standardized
Coefficients t Sig. Collinearity Statistics
B Std. Error beta Tolerance VIF
1 (Constant) 3.718 0.624 5.959 0.000
ECM 0.122 0.034 0.264 3.645 0.000 0.557 1.796
ERM 7.671E-02 0.039 0.158 1.985 0.005 0.546 1.833
EIM 0.150 0.023 0.505 6.410 0.000 0.656 1.524
a. Predictors: (Constant), ECM, EIM and ERM. b. Dependent variable: FP.
Table 12. Model summary (N=110).
R R2 Adjusted R2 Std. Error of the Estimate Change Statistics
R2 change F-change df1 df2 Sig. F-change
0.796 0.634 0.624 1.2367 0.634 61.189 3 106 0.000
a. Predictors: (Constant), ECM, EIM and ERM. b. Dependent variable: FP. Source: Survey data (2010).
managing the working capital elements had higher financial performances; hence, emphasizing the pronouncement that efficient working capital management is an indispensable component for the success of SSEs. The finding by Waweru (2003) which showed that there is no relationship between cash management problems and how firms managed their cash contradicts the study finding that showed that, a 26.4% increase in financial performance could result for every unit change in efficiency of cash management. The findings also reinforces the establishment by Deloof (2003) which showed that, the way working capital is managed has a significant effect on the overall performance of businesses.
CONCLUSIONS AND RECOMMENDATIONS
The study established that majority of the SSEs were not good in managing their working capital since they seemed not to have embraced and implemented efficient working capital management routines in their business operations. This was envisaged in their low means of the efficiency levels in cash, receivables and inventory management and their limited application of theories working capital management in their operations. On this premise, the study concludes that working capital management might be a cause of small business failure and recommends financial management training for the managers of SSEs and the recruitment of field officers to provide counsel and other non-financial services to the small business operators so as to help improve their working capital management efficiency levels. The SSE managers should invest their cash surpluses in ventures that yield high returns such as treasury bills rather than in
current accounts and make use of computerized accounting packages to help improve their efficiency in working capital management.
Based on the establishment of the fact that the financial performance of SSEs in Kisii South District had a low average with majority of the SSEs describing their performance to be either deteriorating or failing, the study concludes that most small scale enterprises in Kisii South District are not thriving, hence their contribution to economic development and their evolution into medium or large enterprises as envisaged in their conceptual plans may not be certain. The study suggests that the small enterprise sector needs effective and dynamic management skills in order to remain successful. Hence, the emphasis on credit provision by the Government of Kenya should be flanked with appropriate training programmes.
The study also found out that efficient working capital management practices have a significant influence on the financial performance of SSEs and recommends that SSEs embrace efficient working capital management practices as a strategy to improve their financial performance and gaining competitive advantage over other competitors.
Based on the establishment that EIM had the greatest effect on the FP model as indicated by its largest standardized beta coefficient (0.505), the study concludes that SSEs should pay more attention to the management of inventory since it has a larger effect on their financial performance. The study therefore recommends that SSEs ensures that stocks are sufficient to meet customer demands at all times while at the same time avoiding holding unnecessary surplus stocks that may increase holding costs. SSEs should seek knowledge on the use of stock optimization techniques so
as to be able to determine right quantities of stock to hold at any given time.
REFERENCES
Atrill P (2006). Financial management for decision makers (4th Ed). Prentice Hall.
Bowen M, Morara M, Mureithi S (2009). Management of business challenges among small and micro enterprises in Nairobi-Kenya, Retrieved from http://www.kcajournals.com. KCA J. Bus. Manag., 2: 1.
Deloof M (2003). “Does Working Capital Management Affect Profitability of Belgian Firms?” J. Bus. Financ. Account., 30(314): 573-587. Field A (2005). Discovering Statistics Using SPSS, 2nd Ed. SAGE
Publications. London.
Fina Bank Report (2007). Why small businesses fail. Nairobi, Kenya. FSD (2009). National survey of financial services access. Finaccess,
Kenya.
Gliem A, Gliem R (2003). Calculating, Interpreting, and Reporting Cronbach’s Alpha Reliability Coefficient for Likert-Type Scales. A refereed paper presented at the \mid-West Research to Practice Conference, Ohio University, October 8-10, Retrieved from http://infotrac.galegroup.com/itweb
ILO (2010). Voucher Program for Training and Business Development services Kenya Micro and Small Enterprise Training and Technology Project. Accessed at http://www.ilo.org/public/english/employment/ent/papers/voucher1.ht m
Juan PG, Martinez S (2002). Effects of working capital management on SME profitability, Retrieved from http://www.sagepublications on 5th Feb 2010., J. Bus. Financ. Account., 30(3–4): 1-14.
Kenya National Bureau of Statistics (2007). Micro and Small enterprise survey. Nairobi, Kenya.
Kotut PK (2003). Working capital management practices by Kenyan firms: A case study of firms listed in the NSE. Unpublished MBA project. Egerton University.
Kwame K (2007). Working capital management practices of small firms in the Ashanti region of Ghana. Retrieved from http://www. ssrn.com on January 2010.
Lamberson M (1995). Changes in Working Capital of Small Firms in Relation to Changes in Economic Activity, Retrieved from http://www. AJBonline.com on 17th December 2009. Mid-Am. J. Bus. 10(2): 45-50.
Lazaridis I, Dimitrios T (2005). The relationship between working capital management and profitability of listed companies in the Athens Stock Exchange. Retrieved from http://ssrn.com/ on January 2010.
Mead DC (1998). Micro and Small Businesses tackle poverty and growth (but in different proportions). Paper presented at the conference on Enterprises in Africa: between poverty and growth. Centre for African Studies, University of Edinburgh, 26-27 May. Michalski GM (2007). Small and Medium Enterprises Accounts
Receivable Management with Value of Liquidity in View. Available at http://ssrn.com
Oketch HO (2000). Micro and small Enterprises in Kenya: Agenda for improving the Policy Environment. Nairobi: ICEG.
Oso WY, Onen D (2005). A general guide to writing research proposal and reports. A hand book for beginning Researchers, (2nd ed.). Makerere University press. Kampala, Uganda.
Padachi K (2006). “Trends in Working Capital Management and its Effect on Firms’ Performance: An Analysis of Mauritian Small Manufacturing Firms”. Retrieved from http://www.emeraldinsight.com/ on January 2010. Int. Rev. Bus. Res.,2(2): 45-58.
Pandey IM (2004). Financial Management 9th Edition, Vikas Publishing House PVT Ltd.
Peel M, Wilson N (1996). “Working Capital and Financial Management Practices in the Small Firm Sector”, Retrieved from http://www.sagepublications.com on 5th February 2010. Int. Small.
Bus. J., 14(2): 52-68.
Scarborough NM, Zimmerer TW (2003). Effective small business management: An Entrepreneurial Approach 7th Edition, Prentice Hall International Inc. New Jersey.
Sushma V, Bhupesh S (2007). Effect of Working Capital Management Policies on Corporate Performance an Empirical Study. Retrieved from http://www.gbr.sagepub.com on February 4, 2010. Glob. Bus. Rev., pp. 8-267.
Thomas J (2008). Basic data analysis IV: Regression diagnostics. Accessed at http://spss.regressiondiagnostics.mht
Waweru KM (2003). Determining cash balance management practices: A case study of SACCOs in Nakuru district. Unpublished MBA project. Egerton University.