BEA BRIEFING
Treatment of Research and Development in Economic
Accounts and in Business Accounts
By Dylan G. Rassier
R
ESEARCH AND DEVELOPMENT (R&D) activi ties are important in many economies and thus warrant a consistent treatment across countries for purposes of national economic accounting. Interna tional guidelines for national economic accounting, notably the System of National Accounts 2008 (SNA 2008), recommend capitalizing expenditures on R&D—that is, treating such expenditures as invest ment that contributes to future production and in come generation. In contrast, U.S. rules for business accounting, as embodied by U.S. generally accepted ac counting principles (GAAP), use a more conservative treatment that requires immediate expensing of R&D expenditures.The different accounting treatments result from their respective objectives. To meet their objectives, the SNA 2008 and U.S. GAAP share some fundamental principles, such as double-entry bookkeeping with debits and credits and accrual methods to match reve
nues and expenses in the same accounting period.1 However, the SNA recommends measures on a cur-rent-cost basis rather than a historical-cost basis as required under U.S. GAAP, which imposes a measure ment challenge that is unique to national economic ac counting. Table 1 provides a quick look at the relationship between national economic accounting measures and business accounting measures.
The objective of the SNA is to provide measures of national economic activity for policymakers, inves tors, business leaders, researchers, and other inter ested users. Thus, the SNA guidelines yield measures of national economic activity within an accounting framework that is based on economic concepts. The SNA is a system in which symmetric treatment is given to both parties of a transaction, and national economic
1. Given a seller and buyer for each transaction, national economic accounts give rise to quadruple-entry accounting: a debit and credit for the seller and a debit and credit for the buyer.
Table 1. Concordance of National Economic Accounting Measures and Business Accounting Measures
National Economic Accounting Business Accounting
Output Net sales
Less: Cost of sales Gross margin
Less: Operating expenses Less: Intermediate consumption
Value added (GDP) Less: Compensation
Less: Taxes on production less subsidies Gross operating surplus
Less: Consumption of fixed capital
Operating income
Less: Depreciation and amor tization
Net operating surplus Earnings before interest and taxes
Less: Net property income Less: Net interest paid
Net entrepreneurial income before current taxes Income before income taxes
Less: Current taxes on income, wealth, etc. Less: Provision for income taxes
Net entrepreneurial income after current taxes Net income
GDP Gross domestic product accounting, and depreciation and amortization is based on historical-cost accounting.
NOTE. Some economic accounting measures are conceptually different than the corresponding Source: Author’s concordance of national economic accounting measures and financial accounting
accounts are designed to summarize transactions from the perspectives of both sellers and buyers. Under the SNA 2008, R&D is recognized as capital formation be cause of future economic benefits associated with R&D. Under previous versions of the SNA, R&D was treated as intermediate consumption, which was con sistent with immediate expensing required under U.S. GAAP.2
The objective of U.S. GAAP is to provide financial information on individual firms to managers, inves tors, creditors, and other interested users. Thus, the U.S. rules yield financial information on individual firms within an accounting framework that is based on business accounting concepts. Business accounts are designed to summarize transactions for a firm in isola tion. Under U.S. GAAP, R&D is not recognized as capi tal formation because of the uncertainty of future economic benefits associated with R&D—that is, U.S. rule makers are traditionally conservative in the treat ment of expenditures. Immediate expensing implies that R&D expenditures contribute to sales and the re lated profits in the current period with no contribu tion to sales and profits in future periods.
The Bureau of Economic Analysis (BEA) generally accounts for R&D according to recommendations in the SNA 2008. As a result, the recent 2013 comprehen sive revision of the national income and product ac counts (NIPAs) incorporates the conceptual change in the treatment of R&D (Smith and Holdren 2013).
This BEA Briefing discusses the international guide lines for national economic accounting under the SNA 2008 and the U.S. business accounting rules under GAAP for expensing or capitalizing expenditures on R&D. The article also demonstrates that the national economic accounting measures of production and in come and the business accounting measures of operat ing income and net income are all higher when R&D expenditures are capitalized. The article then discusses the aforementioned measurement challenge associated with current-cost accounting under the SNA.
The article is an abbreviated version of Rassier (2013), which outlines the international economic ac counting guidelines and the U.S. business accounting rules for all intellectual property products identified in the SNA 2008.
2. The conceptual change is a result of considerable research by interna tional organizations and national statistical offices. Likewise, some work on business accounting research focuses on changing the U.S. requirements for R&D from immediate expensing to capitalization (Amir and Lev 1996; Lev and Sougiannis 1996; Collins, Maydew, and Weiss 1997; Aboody and Lev 1998; Francis and Schipper 1999; Lev and Zarowin 1999; Penman 2009; and Ciftci, Darrough, and Mashruwala 2013).
The System of
National Accounts 2008 and R&D
The SNA 2008 is a collaboration of five international organizations: the United Nations, the European Com mission, the Organisation for Economic Co-operation and Development (OECD), the International Mone tary Fund, and the World Bank Group. Countries are encouraged to follow the recommendations provided in the international guidelines in order to facilitate the comparability of national income and product statis tics. In addition, some organizations’ member coun tries are periodically required to report statistics that are consistent with the international guidelines.
The SNA 2008
The accounting framework of the SNA 2008 is struc tured as a sequence of accounts that reflect stocks of as sets and liabilities and related economic flows for national economies. Each account in the sequence yields a residual or balancing item that is carried for ward to the next account in the sequence. The se quence of accounts includes three categories of accounts:
●Current accounts. These accounts include a pro duction account, which reflects production, and income accounts, which reflect the generation, dis tribution, and uses of income from production. ●Accumulation accounts. These accounts reflect
changes in assets, liabilities, and net worth as a result of volume changes, price changes, and saving from production. The accumulation accounts include the capital account, which shows transac tions in nonfinancial assets (such as R&D) and cap ital transfers.
●Balance sheet. This presentation reflects stocks of assets and liabilities and changes in assets and liabil ities. The difference between assets and liabilities is net worth.
Please see the appendix for more detail and a sum mary of the sequence of accounts.
R&D in the SNA capital account
The capital account shows transactions in nonfinancial assets and capital transfers. Nonfinancial assets are ei ther produced or nonproduced. Produced assets result from a production process and include fixed assets, in ventories, and valuables. In order to be considered a fixed asset, an asset must be used in production for more than 1 year. Inventories may be used in produc tion or may be held for sale or other uses. Valuables are stores of value that are generally not used in produc tion. Nonproduced assets result from a process other
than production and include natural resources; con tracts, leases, and licenses; and purchased goodwill and marketing assets.
Capitalizing fixed assets in the capital account re quires statisticians to derive related measures of gross fixed capital formation and consumption of fixed capi tal (CFC), which is a measure of economic deprecia tion. Gross fixed capital formation includes fixed assets purchased by a producer from other producers and in cludes fixed assets produced by a producer and re tained for the producer’s own use in future production (that is, own-account production). Thus, CFC also in cludes own-account fixed assets.
The asset boundary for fixed assets in the capital ac count generally includes R&D. Similar to other types of fixed assets, R&D may be purchased from other pro ducers or produced internally. According to the SNA 2008, the amounts capitalized should be consistent with the future economic benefits the R&D is expected to provide, which can be determined by the market prices of purchased R&D or by the costs associated with own-account R&D when market prices are un available. Costs should be capitalized regardless of the actual commercial or technological success of an en deavor because all costs form part of a future successful endeavor. While some R&D may require many failures to reap one success, businesses are not presumed to in cur costs related to R&D with an expectation of ulti mate failure. Once R&D is recorded in the capital account, subsequent charges should be made to CFC over the useful life determined for the R&D output.3
The SNA 2008 defines R&D as follows: “Research and [experimental] development consists of the value of expenditures on creative work undertaken on a sys tematic basis in order to increase the stock of knowl edge, including knowledge of man, culture and society, and use of this stock of knowledge to devise new appli cations. This does not extend to human capital as as sets within the SNA” (SNA 2008, paragraph 10.103, 206).
Under prior versions of the SNA, expenditures on R&D were treated as intermediate consumption. As a result, the assets that were recognized as resulting from R&D were limited to legal rights or contractual agree ments, such as patents and trademarks, and were treated as nonproduced assets that were brought into existence through the legal system rather than through the production of knowledge. The SNA 2008 recog nizes the creation of an underlying intellectual prop erty product requires production activity using
3. Measurement of capitalized amounts and subsequent charges to CFC are outside the scope of this paper, but guidance is offered in Li (2012), OECD (2010), and Aizcorbe, Moylan, and Robbins (2009) in addition to the SNA 2008.
resources such as labor and capital and treats R&D as a produced fixed asset. Under this treatment, legal rights and contractual agreements are no longer recorded in the capital account.
R&D Under
U.S. Business Accounting Rules
Two organizations are recognized for issuing U.S. GAAP for nongovernmental entities: the Financial Ac counting Standards Board (FASB) and the Securities and Exchange Commission (SEC). The single source of authoritative GAAP issued by FASB for nongovern mental entities is provided by the Accounting Stan dards Codification. In addition to the Codification, the SEC issues rules and interpretive releases, which serve as authoritative GAAP for SEC registrants.Under the FASB Codification, expenditures on R&D are treated as expenses regardless of the success of the R&D. In contrast to the SNA 2008, the justification for expensing R&D expenditures is due to the uncertainty associated with future economic benefits. As a result, expenditures on R&D are distinguished from expendi tures on intangibles that may evolve from the results of R&D and result in asset recognition, such as legal fees incurred to obtain a patent.
The Codification includes five categories of costs to be identified with R&D activities: (1) materials, equip ment, and facilities, (2) personnel, (3) intangible assets purchased from others with no alternative future uses, (4) contract services, and (5) indirect costs. For the third category, purchased software may be capitalized if the software has an alternative future use.
Current-Cost Accounting
and Economic Accounts
The SNA 2008 recommends that the costs of produc tion be consistent with the economic concept of op portunity cost. Opportunity cost is the value of the next best alternative that is foregone when a resource is used. Current-cost accounting is offered in the SNA 2008 as a practical solution to opportunity cost. Under current-cost accounting, a resource used in production is valued at its actual or estimated current-market price at the time production takes place. Thus, in the capital account, current-cost accounting requires as sets that are purchased and used in different time peri ods to be adjusted using price indexes. In the case of previously capitalized expenditures related to R&D, data on current prices may not be readily available, be cause there are no observed transactions.
In contrast to the SNA 2008, the U.S. business ac counting rules require a resource to be recorded on a historical-cost basis, which is determined by the actual costs incurred to acquire the resource. Thus, national
economic accounting statisticians face a measurement challenge under current-cost accounting that is unique to national economic accounting.4
Effects of Own-Account R&D on
Economic Accounting Measures and
Business Accounting Measures
Expensing R&D expenditures assumes that the expen ditures only affect the current period, thus affecting re lated accounting measures only in the current period. Capitalizing R&D expenditures assumes the expendi tures provide current and future benefits, which affects accounting measures in the current and future periods. Table 1 provides a concordance of national economic accounting measures and business accounting mea sures. Some of the differences in scope between cost of sales and intermediate consumption and between op erating expenses and compensation and taxes on pro duction less subsidies affect the concordance between value added (Gross domestic product) in national eco nomic accounting and gross margin in business ac counting. Likewise, some economic accounting measures are conceptually different from the corre sponding business accounting measure; for example, CFC in national economic accounting is based on cur-rent-cost accounting, and depreciation and amortiza tion in business accounting is based on historical-cost accounting.National economic accounting measures
Based on Hulten and Hao (2008), table 2 summarizes the conceptual effects of expensing or capitalizing own-account R&D on the SNA production account and the SNA generation of income account. In table 2, Q denotes output, X denotes intermediate consump tion, and R denotes R&D expenditures. In addition,
4. Measurement of prices related to R&D is outside the scope of this paper, but guidance is offered in Copeland and Fixler (2012), Robbins, Belay, Donahoe, and Lee (2012), Corrado, Goodridge, and Haskel (2011), and Copeland, Medeiros, and Robbins (2007).
when expenditures are capitalized, the capitalized amounts are subject to economic depreciation at a rate denoted δ, where 0 < δ < 1.
If R&D expenditures are expensed, the expenditures are treated as intermediate consumption in the pro duction of products other than R&D and have no im pact on the output of R&D. If the expenditures are capitalized, however, they are treated as intermediate consumption in the production of R&D, and the capi talized amount is treated as R&D output. Whether the R&D output is sold to other producers or used inter nally, there is presumably a return, denoted Π, associ ated with the output. Thus, if own-account R&D is capitalized in lieu of expensing, output increases by the amount of the expenditures plus the associated return, (1 + Π)R. Intermediate consumption stays the same because capitalizing own-account R&D does not change the purchases of intermediate inputs. Likewise, value added (GDP) and gross operating surplus in crease by (1 + Π)R, and net operating surplus increases by the output of R&D adjusted for economic deprecia tion (1 + Π–δ)R.
To demonstrate the quantitative effects of ex pensed and capitalized business R&D on U.S. product and income measures, table 3 presents annual U.S. GDP and net operating surplus with expensed and capitalized business R&D expenditures for 2008–2012. Lines 1 and 4 in table 3 include capitalized mea sures of R&D and are published in the U.S. NIPAs. Likewise, lines 2, 5, and 6 are published in the U.S. fixed assets accounts. The amounts in lines 2 and 5 are equivalent to (1 + Π)R in table 2, and the amounts on line 6 are equivalent to δR in table 2. Before the 2013 comprehensive revision of the NIPAs, business R&D was treated as intermediate consumption rather than as investment. To demonstrate the effects of ex pensed R&D, line 3 in table 3 presents GDP net of R&D investment, and line 7 presents net operating surplus net of R&D investment and the related CFC.
Table 2. National Economic Accounting Measures With Expensed and Capitalized R&D (Own-Account)
Expensed Capitalized
Output ... Q Q + (1+Π) R
Less: Intermediate consumption... X + R X + R
Value added (GDP)... Q – X – R Q – X + Π R
Less: Compensation ... W W
Less: Taxes less subsidies... T T
Gross operating surplus ... Q – X – W – T – R Q – X + Π R – W – T
Less: Consumption of fixed capital ... D D +δR
Net operating surplus ... Q – X – W – T – D – R Q – X – W – T – D + ( Π – δ) R
GDP Gross domestic product
Business accounting measures
Table 4 summarizes the differences between business accounting measures with expensed and capital ized own-account R&D expenditures. In this table, S denotes sales, C denotes cost of sales, and R denotes R&D expenditures. In addition, the return to own-ac count R&D is Π, and the associated amortization rate is δ(0 < δ < 1).
If expenditures related to own-account R&D are ex pensed, the expenditures are treated as operating ex penses with no impact on sales. If the expenditures are capitalized, they may be treated as the cost of sales in the production of intangibles, and the capitalized
amount may be treated as sales of intangibles. Thus, capitalizing own-account R&D instead of expensing increases the cost of sales by the amount of the expen ditures, R, which are offset by an equal decrease in op erating expenses. In addition, sales increase by the amount of the expenditures plus the associated return, (1 + Π)R, which is also reflected in operating income. Given the charge to amortization, the difference in earnings before interest and taxes and net income are each (1+ Π–δ)R. The changes for sales, operating in come, earnings before interest and taxes, and net in come are equivalent to the changes for their counterparts in the national economic accounts.
Table 3. U.S. Economic Accounting Measures With Expensed and Capitalized Business R&D
[Billions of U.S. dollars]
Line 2008 2009 2010 2011 2012
1 GDP with capitalized business R&D ... 14,720.3 14,417.9 14,958.3 15,533.8 16,244.6 2 Less: Business R&D ... 224.5 214.0 223.6 235.3 248.7 3 GDP with expensed business R&D... 14,495.8 14,203.9 14,734.7 15,298.5 15,995.9 4 NOS with capitalized business R&D ... 3,178.6 3,213.9 3,557.0 3,811.2 4,033.2 5 Less: Business R&D ... 224.5 214.0 223.6 235.3 248.7 6 Plus: Consumption of fixed capital ... 182.5 185.4 193.2 202.8 215.3 7 NOS with expensed business R&D... 3,136.6 3,185.3 3,526.6 3,778.7 3,999.8
GDP Gross domestic product (NIPAs); lines 2 and 5 come from line 83 of table 2.7 of the U.S. fixed assets accounts (FAAs); line 4 NOS Net operating surplus comes from line 9 of table 1.10 of the U.S. NIPAs; and line 6 comes from line 83 of table 2.4 of the U.S. R&D Research and development FFAs.
Source: Line 1 comes from line 1 of table 1.1.5 of the U.S. national income and product accounts NOTE. Business R&D investment excludes expenditures on software development.
Table 4. Business Accounting Measures With Expensed and Capitalized R&D (Own-Account)
Expensed Capitalized
Net sales ... S S + (1 + Π ) R
Less: Cost of sales ... C C + R
Gross margin ... S – C S – C + Π R
Less: Operating expenses ... X X Less: R&D... R
Operating income ... S – C – X – R S – C – X + Π R
Less: Depreciation and amor tization ... D D +δR
Earnings before interest and taxes ... S – C – X – D – R S – C – X – D + ( Π – δ) R
Less: Interest and income taxes ... T T
Net income... S – C – X – D – T – R S – C – X – D – T + ( Π – δ) R
R&D Research and development
Appendix
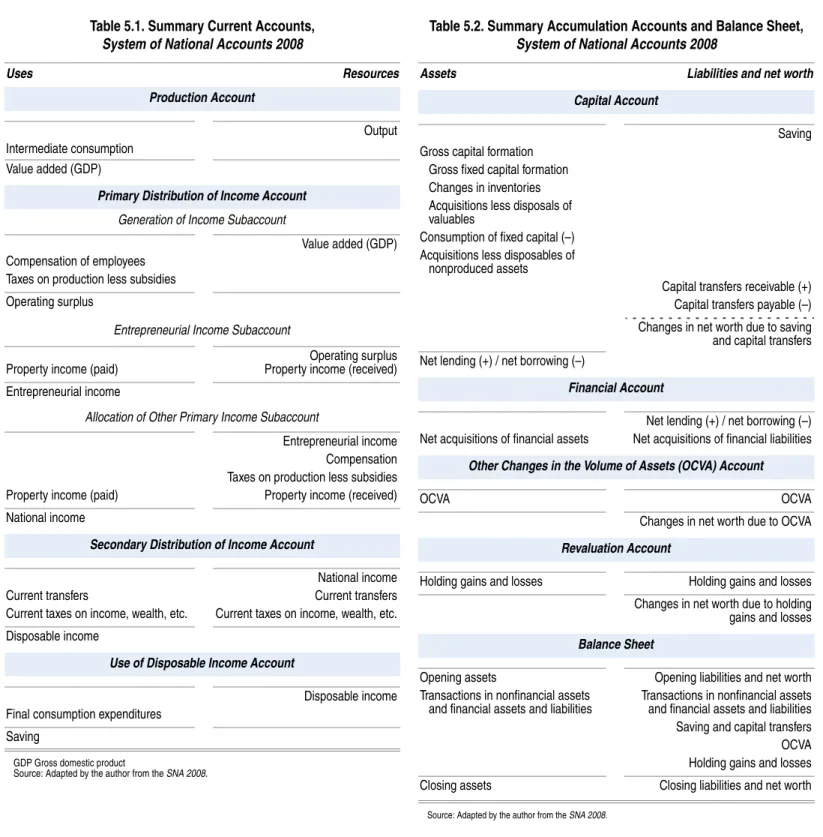
The System of National Accounts 2008 sequence of ac counts includes three categories of accounts: (1) cur rent accounts, (2) accumulation accounts, and (3) a balance sheet. Tables 5.1 and 5.2 summarize this se quence. To understand the treatment of R&D in the accounting framework of the SNA 2008, a basic under standing of each category of accounts is helpful.
Current accounts
Table 5.1 summarizes the current accounts. The cur rent accounts include a production account, which reflects production, and income accounts, which re flect the generation, distribution, and uses of in come from production. The production account is the first account in the sequence and yields value added as a residual between output and intermediate con sumption of materials, energy, and purchased ser vices. Value added is referred to in the SNA 2008 as gross domestic product (GDP) and is conceptually equivalent to GDP and gross domestic income (GDI) in the NIPAs.
The income accounts of the SNA 2008 are com posed of a primary distribution of income account, a secondary distribution of income account, and a use of disposable income account. The primary distribution of income account shows the generation of income from production and the allocation of income to the primary factors involved in production: labor, capital, and government. In concept, value added equals the income generated in production. The secondary distri bution of income account shows the redistribution of primary income through income taxes and transfers. The balancing item in the secondary distribution of in come account is disposable income, which is shown in the use of disposable income account for final con sumption expenditures or saving. Saving is the starting point for the accumulation accounts.
The balancing items of the current accounts may be
measured gross or net. In the SNA 2008, the difference between gross and net is consumption of fixed capital (CFC), a measure of economic depreciation. While CFC is excluded from the summary in table 5.1 for simplicity, CFC plays an important role in the current accounts by revealing the extent to which production and the related income are affected by declines in in vested capital. Thus, CFC plays a role in national eco nomic accounts similar to the role of depreciation and amortization in business accounts, where income is measured gross (operating income) and net (net in come) of depreciation and amortization.
Accumulation accounts
Accumulation accounts reflect changes in assets, liabil ities, and net worth as a result of volume changes, price changes, and saving from production. Accumulation accounts include four accounts: the capital account, the financial account, the other changes in volume of assets account (OCVA), and the revaluation account. The capital account shows transactions in nonfinancial assets and capital transfers, which result in a redistri bution of wealth. The financial account reflects trans actions in financial assets and liabilities, such as stock and bonds. The OCVA records changes in the values of assets that result from flows other than transactions, such as catastrophic losses or discovery of subsoil re sources. The revaluation account captures holding gains and losses, which reflect changes in prices but do not reflect transactions and do not arise from produc tion. Table 5.2 summarizes the contents of the accu mulation accounts.
Balance sheet
The balance sheet is also summarized in table 5.2. The balance sheet reflects stocks of assets and liabilities and changes in assets and liabilities for the accounting pe riod. The difference between assets and liabilities is net worth.
Table 5.1. Summary Current Accounts, System of National Accounts 2008
Uses Resources
Production Account
Intermediate consumption Value added (GDP)
Output
Primary Distribution of Income Account
Generation of Income Subaccount
Value added (GDP) Compensation of employees
Taxes on production less subsidies Operating surplus
Entrepreneurial Income Subaccount
Operating surplus
Property income (paid) Property income (received)
Entrepreneurial income
Allocation of Other Primary Income Subaccount
Entrepreneurial income Compensation Taxes on production less subsidies
Property income (paid) Property income (received)
National income
Secondary Distribution of Income Account
National income
Current transfers Current transfers
Current taxes on income, wealth, etc. Current taxes on income, wealth, etc. Disposable income
Use of Disposable Income Account
Disposable income Final consumption expenditures
Saving
GDP Gross domestic product
Source: Adapted by the author from the SNA 2008.
Table 5.2. Summary Accumulation Accounts and Balance Sheet, System of National Accounts 2008
Assets Liabilities and net worth Capital Account
Gross capital formation Gross fixed capital formation Changes in inventories Acquisitions less disposals of valuables
Saving
Consumption of fixed capital (–) Acquisitions less disposables of
nonproduced assets
Capital transfers receivable (+) Capital transfers payable (–) Changes in net worth due to saving and capital transfers Net lending (+) / net borrowing (–)
Financial Account
Net lending (+) / net borrowing (–) Net acquisitions of financial assets Net acquisitions of financial liabilities
Other Changes in the Volume of Assets (OCVA) Account
OCVA OCVA
Changes in net wor th due to OCVA
Revaluation Account
Holding gains and losses Holding gains and losses
Changes in net wor th due to holding gains and losses
Balance Sheet
Opening assets Opening liabilities and net worth
Transactions in nonfinancial assets Transactions in nonfinancial assets and financial assets and liabilities and financial assets and liabilities Saving and capital transfers OCVA Holding gains and losses
Closing assets Closing liabilities and net worth
References
Aboody, David, and Baruch Lev. 1998. “The Value Rel evance of Intangibles: The Case of Software Capitaliza tion.” Journal of Accounting Research 36, Supplement, 161–191.
Aizcorbe, Ana M., Carol E. Moylan, and Carol A. Robbins. 2009. “Toward Better Measurement of Inno vation and Intangibles.” SURVEY OF CURRENT BUSINESS 89
(January): 10–23.
Amir, Eli, and Baruch Lev. 1996. “Value Relevance of Nonfinancial Information: The Wireless Communi cations Industry.” Journal of Accounting and Economics 22, nos. 1–3 (August–December): 3–30.
Ciftci, Mustafa, Masako Darrough, and Raj Mashruwala. 2013. “Value Relevance of Accounting Information for Intangible-Intensive Industries and the Impact of Scale: The U.S. Evidence.” Euro pean Accounting Review. Posted online in Septem ber.
Collins, Daniel W., Edward L. Maydew, and Ira S. Weiss. 1997. “Changes in the Value Relevance of Earn ings and Book Values Over the Past Forty Years.” Jour nal of Accounting and Economics, 24, no. 1 (December): 39–67.
Copeland, Adam, and Dennis Fixler. 2012. “Mea suring the Price of Research and Development Out put.” Review of Income and Wealth 58, no. 1 (March): 166–182.
Copeland, Adam, Gabriel W. Medeiros, and Carol Robbins. 2007. “Estimating Prices for R&D Investment in the 2007 R&D Satellite Account.” Bureau of Eco nomic Analysis (BEA)/National Science Foundation 2007 R&D Satellite Account Background Paper. Wash ington, DC: BEA, November; www.bea.gov under Pa pers by Topic.
Corrado, Carol, Peter Goodridge, and Jonathan Haskel. 2011. “Constructing a Price Deflator for R&D: Calculating the Price of Knowledge Investment as a Re sidual.” Economics Program Working Paper Series (EPWP) #11–03. New York, NY: The Conference Board.
European Commission, International Monetary Fund, Organisation for Economic Co-operation and Development, United Nations, and World Bank. 2009. System of National Accounts 2008. New York, NY: United Nations.
Financial Accounting Standards Board. Accounting Standards Codification. Topics 350–20, 350–30, 350–40, 350–50, 730–10, 805–20, 805–30, 926–20,
928–340, 932–720, 985–20. Norwalk, CT: Financial Accounting Foundation.
Francis, Jennifer, and Katherine Schipper. 1999. “Have Financial Statements Lost Their Relevance?” Journal of Accounting Research 37, no. 2 (Autumn): 319–352.
Hulten, Charles R, and Xiaohui Hao. 2008. “What is a Company Really Worth? Intangible Capital and the ‘Market to Book Value’ Puzzle.” National Bureau of Economic Research (NBER) Working Paper 14548. Cambridge, MA: NBER.
Lev, Baruch, and Theodore Sougiannis. 1996. “The Capitalization, Amortization, and Value Relevance of R&D.” Journal of Accounting and Economics 21, no. 1 (February): 107–138.
Lev, Baruch, and Paul Zarowin. 1999. “The Bound aries of Financial Reporting and How to Extend Them.” Journal of Accounting Research 37, no. 2 (Au tumn): 353–385.
Li, Wendy C.Y. 2012. “Depreciation of Business R&D Capital.” Bureau of Economic Analysis (BEA)/ National Science Foundation R&D Satellite Account. Washington, DC: BEA, October; www.bea.gov under Papers by Topic.
Organisation for Economic Co-operation and De velopment. 2010. Handbook on Deriving Capital Mea sures of Intellectual Property Products. Paris.
Penman, Stephen H. 2009. “Accounting for Intangi ble Assets: There is Also an Income Statement.” Abacus 45, no. 3 (September): 358–371.
Rassier, Dylan G. 2013. “Accounting for Intellectual Property Products: International Guidelines for Na tional Economic Accounting and U.S. Rules for Finan cial Accounting.” Paper prepared for The National Intellectual Property Taskforce. New York, NY. No vember 19; www.bea.gov/papers/index.htm.
Robbins, Carol A., Olympia Belay, Matthew Do nahoe, and Jennifer Lee. 2012. “Industry-Level Output Price Indexes for R&D: An Input-Cost Approach With R&D Productivity Adjustment. BEA Working Paper WP2013–2. Washington, DC: BEA.
Robbins, Carol A., and Carol E. Moylan. 2007. “Re search and Development Satellite Account Update.” SURVEY OF CURRENT BUSINESS 87 (October): 49–64.
Smith, Shelly, and Alyssa E. Holdren. 2013. “Pre view of the 2013 Comprehensive Revision of the Na tional Income and Product Accounts: Changes in Definitions and Presentations.” SUR VEY OF CURRENT