Vanguard Research September 2014
Head
Vanguard Research April 2015
1 Throughout this paper, when we refer to indexing, we assume a strategy that is weighted according to market capitalisation. For an evaluation of indices and the strategies that seek to track those indices, refer to Philips et al. (2011) and Thomas & Bennyhoff (2012).
■
■
Index fund investing (indexing) refers to an investment methodology that attempts to track
a specific market index (either broad or narrow) as closely as possible. This paper explores
the theory behind indexing as an investment strategy and provides evidence to support its
use in investor portfolios.
1■
■
The theory behind indexing as an investment strategy focuses on the zero-sum game:
before costs, for every investment that outperforms the index of a chosen market, there
has to be another one that underperforms. But once costs are taken into account, more
than half of the investments underperform. This means that low-cost funds will have a
greater probability of outperforming higher-cost funds. The lower average cost of index
funds places them at an advantage in this regard.
■
■
We first compare the records of actively managed funds with those of various unmanaged
benchmarks. We demonstrate that after costs: (1) the average actively managed fund has
underperformed various benchmarks; (2) reported performance statistics can deteriorate
markedly once “survivorship bias” is accounted for (that is, once the results of funds that
were removed from the public record are included); and (3) persistence of performance
among past winners is no more predictable than a flip of a coin.
■
■
We then compare the performance of actively managed funds with passive – or indexed –
funds. We demonstrate that low-cost index funds have displayed a greater probability of
outperforming higher-cost actively managed funds, even though index funds generally
underperform their targeted benchmarks.
Peter Westaway, PhD, Todd Schlanger, CFA, Georgina Yarwood
The case for index
fund investing for
UK investors
3 2 Value weighting gives proportional weight to each holding, based on its market capitalisation. Compared to equal weighting, which helps ensure against any one fund dominating the results
but also implicitly makes relatively large bets on smaller constituents, value weighting more accurately reflects the aggregate equity and bond markets.
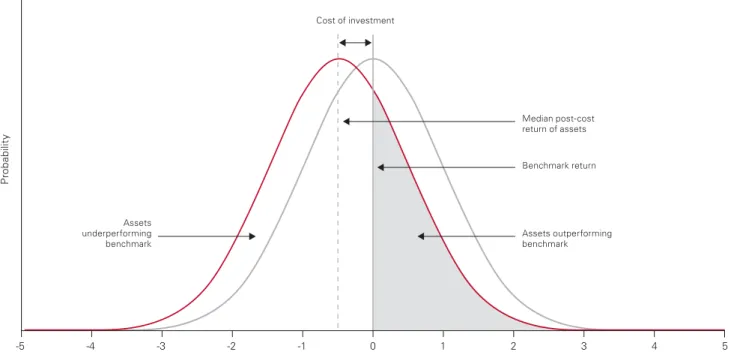
In reality, investors are exposed to costs such as commissions, management fees, bid-offer spreads, administrative costs and, where applicable, taxes – all of which combine to reduce investors’ realised returns over time. If these costs were to affect all investments equally, then the result would be to shift the investors’ curve to the left but to leave the shape of the bell curve unchanged. We represent this adjustment for costs with a red curve. Although a portion of the after-cost, value-weighted performance continues to lie to the right of the market return, represented by the grey shaded region in Figure 1, a much larger portion is now to the left of the market line, meaning that after costs, more than half of the value-weighted performance of investors falls short of the aggregate market return. The smaller these additional costs are, the less this aggregate underperformance will be. This simple theoretical result is powerful because it is just as relevant in all markets, even those often thought to be less efficient, such as small-cap or emerging market equities (Waring and Siegel, 2005).
The importance of the zero-sum game to the case for indexing
The zero-sum game is a theoretical concept that forms the foundation for why indexing can serve as an attractive investment strategy. The concept of a zero-sum game starts with the understanding that, at any given point in time, the holdings of all investors in a particular market aggregate to form that market (Sharpe, 1991). Because all investors’ holdings are represented, if one investor’s positions outperform the aggregate market over a particular time period, another investor’s positions must underperform, such that the value-weighted performance of all investors sums to equal the performance of the market.2 Of course, this holds for any market, such as
foreign stock and bond markets, or even specialised markets such as commodities or real estate. The aggregation of all investors’ returns can be thought of as a bell curve (see Figure 1), with the benchmark return as the mean. In Figure 1, the specific market is represented by the grey curve, with the market return as the vertical grey line.
Figure 1: The impact of costs on the zero-sum game?
P ro ba bil it y Assets underperforming benchmark
Expected return relative to benchmark (pp)
Median post-cost return of assets Benchmark return Assets outperforming benchmark Cost of investment
Source: The Vanguard Group, Inc.
One potential counter argument to this powerful result is that active mutual fund managers do not represent the totality of active investors in a given market; other investors include, but are not limited to, hedge funds, pension funds, separately managed account managers and holders of individual securities. So, if active fund managers were able to outperform systematically their benchmark before costs, then this might suffice to compensate for, or even outstrip, the harmful effects of higher costs on performance. Appendix A provides a stylised analysis of the return distributions of passively and actively managed funds which suggests that such an outcome is unlikely. But to understand what has
happened in practice, empirical evidence is required for the performance of active and passive funds. The rest of the paper examines the data and finds convincing evidence that the average active fund manager is unable to compensate for higher costs and as a consequence will still have a higher probability of underperforming relative to passively managed funds.
The performance record of actively managed mutual funds
Typically, the objective of an actively managed portfolio is to outperform a given benchmark. Depending on the active strategy, the target benchmark could be a
traditional broad market index such as the FTSE All Share Index or the Barclays Sterling Aggregate Bond Index – or an index with a narrower objective such as the FTSE Small-Cap Index. The objective could also be to generate an excess return relative to a short-term government debt instrument or to LIBOR (i.e. an absolute return strategy). Of course, every manager will go through periods where their investing style is out of favour, but over a reasonably long period of time, covering multiple market cycles and environments, a skilled active manager should be aiming to deliver positive excess returns versus their benchmark for the full time period. In fact, we will see that while the theory is appealing, the actual track record of actively managed funds is underwhelming, suggesting that an active manager with such skill is difficult to find.
Data
To examine how successful active managers have been in achieving these goals, we begin by examining the performance of a range of funds available to UK investors, focusing on a few broad investment categories; global, UK, European and emerging market equities and global, GBP-, euro- and dollar-denominated bonds. For all of our comparisons we use the open-ended fund universe provided by Morningstar. Fund classifications are provided by Morningstar, as are the ongoing charges figure (OCF), assets under management, inception date and termination date (if relevant). Fund returns are reported net of cost; however, front or back end loads and taxes are unaccounted for.
We exclude sector funds and specialist funds from our analysis. For our evaluation of index funds, we exclude ETFs because of the lack of adequately long backruns of data. However, we would expect the conclusions of our results using index funds to extend to ETFs because they operate with a similar objective. For funds that offer income and accumulation accounts, we use the returns for the accumulation account only except in those cases where only an income fund is listed. Similarly, for funds that include variants denominated in different currencies, we use the returns for the GBP-denominated fund except in those cases where only foreign currency funds are available (although the return is still reported in GBP).3
Otherwise, we use all share classes of funds in order to capture the broadest perspective of investor performance. This approach is taken to capture the influence of differential costs on returns on otherwise identical funds. Even so, it runs the risk of overweighting particular investment strategies. So, as a robustness check, we also provide an alternative version of the analysis in Appendix B, where we weight the returns on the fund by asset holdings, thereby providing the closest approximation possible of the average pound invested. Given the lesser availability of fund holdings, we have fewer results on this basis but we find the main conclusions from those results are largely unaltered.
3 The total returns on otherwise identical income and accumulation funds might be expected to be identical but differ slightly because of the way Morningstar choose to incorporate tax effects on dividend income. GBP returns on funds that are identical apart from their currency denomination differ because non-GBP returns are usually hedged, thus causing a difference with ex-post returns.
5 Primary findings
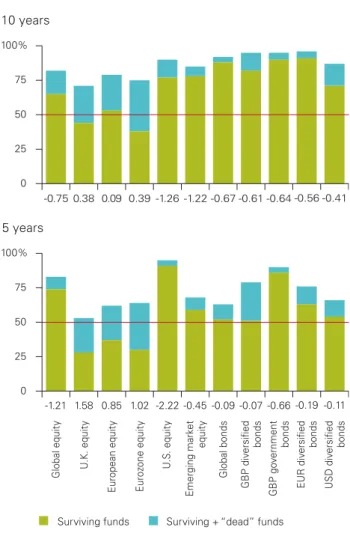
Figure 2 shows the relative performance of these different categories of actively managed mutual funds when evaluated over 15, 10 and 5 years versus a benchmark that is specified in the funds’ prospectus. The rationale for this evaluation is straightforward; comparing all funds versus a broad market benchmark results in a mismatch of market risk factors. A small-cap manager may outperform the broad market simply because small-cap stocks in general outperformed the broad market and not because of a specific skill or management technique. In our view, comparing a small-cap manager against a small-cap benchmark addresses this mismatch and thus permits a more reasonable evaluation of outperformance. In Figure 2, we display three key pieces of information:
1. The green bar represents the percentage of funds in each category that survived the time period but
underperformed their benchmark. Taking global equities over 15 years as an example, this share is 64%.
2. The blue bar represents the percentage of all funds that started the given period but dropped out of the sample. Adding up the green bar and the blue bar we obtain the percentage of funds that either underperformed or closed/merged (82% in the case of global equities over 15 years).
3. For surviving funds only, we display the annualised median excess return for each category (-0.69% for global equities over 15 years).
The dominant finding in Figure 2 is that active fund managers as a group have underperformed their
benchmarks across most of the fund categories and time periods considered. Indeed this underperformance tends to be even greater over longer investment periods, due to the compounding effects of costs and the difficulty of repeatedly outperforming the market, and once survivorship bias is taken into account.
10 years
5 years
5 years
Notes: Fund universe includes funds available for sale in the UK, filtered according to the description above, from the following Morningstar categories: UK equity – flex cap, large-cap blend, large-cap growth, large-cap value, mid-cap, small-cap; Europe equity – Europe OE: flex-cap, large-cap blend, large-cap growth, large-cap value, mid-cap, small-cap; Euro zone equity – flex-cap, large-cap, mid-cap, small-cap; Global – flex-cap, large-cap blend, large-cap growth, large-cap value, mid-cap, small-cap; US equity – flex-cap, large-cap blend, large-cap growth, large-cap value, mid-cap, small-cap; Emerging markets equity – emerging markets; Europe bond – EUR diversified; US bond – USD diversified; Global bond – global un-hedged bond; UK bonds – UK diversified, UK government. Performance is for periods ending on 31 December 2014. Performance is calculated relative to prospectus benchmark. Fund performance is shown in GBP terms, net of fees, gross of withholding tax, with income reinvested, based on closing NAV prices.
Sources: Vanguard calculations, using data from Morningstar, Inc.
Surviving funds Surviving + “dead” funds
Global equit y U .K. equit y European equit y Euroz one equit y U .S . equit y Global bonds GBP div ersified bonds Emerging mark et equit y GBP go vernment bonds EUR div ersified bonds USD div ersified bonds 100% 75 50 25 0 -0.75 0.38 0.09 0.39 -1.26 -1.22 -0.67 -0.61 -0.64 -0.56 -0.41 100% 75 50 25 0 -0.69 0.55 0.18 0.56 -0.29 -1.11 -0.39 -0.68 -0.87 -0.82 -0.75 100% 75 50 25 0 15 years
Figure 2: The percentage of underperforming actively managed funds (using prospectus benchmark).
of underperformance is increased across all categories.5
See Box A for more discussion around the performance of those funds that no longer report returns to the database.
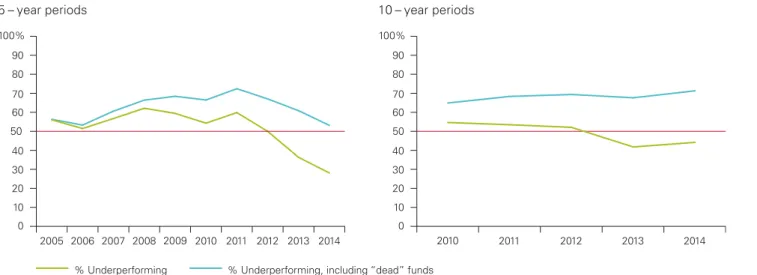
Of course, an obvious limitation of Figure 2 is that it represents a snapshot and, over time, the percentage of funds underperforming a particular index will vary. Some of this variation is often due to the cyclical nature of the financial markets. In other words, when one investment style comes into favour it can cause a disproportionate number of funds to out or underperform, regardless of the performance of the active manager. Another element is the sporadic and unpredictable nature of actively managed portfolios. To use UK active equity managers as an example, 2014 was a relatively flat year with 51% of surviving funds outperforming their prospectus
benchmarks, but this figure drops to 48% once survivorship bias is taken into account. In Figure 3, we examine performance cyclicality by displaying the performance of UK active equity funds over rolling 5 and 10-year periods.
We show annualised excess returns because to evaluate managers using solely the percentage of managers underperforming assumes that a manager who underperforms by 0.01% has achieved a result as significant as one who underperforms by 10%. Picking the example of global equities, at the ten year horizon the median return is 0.75% below the benchmark return. This median excess return is negative for 9 out of 11 of the broad asset categories considered at the ten and 15-year horizon.
We attempt to account for survivorship bias in Figure 2 by identifying those funds that were alive at the start of each year but dropped out of the database at some point along the way, usually on the grounds of underperformance. When underperforming funds drop out of the database, this will tend to exaggerate the degree to which active managers can outperform their chosen index. And this is exactly what the empirical results tend to suggest.4 For
example, in the case of global equities at the ten-year horizon, the adjustment for survivorship bias takes the proportion of underperforming funds from 64% to 82%. Indeed, after accounting for survivorship bias, the degree
% Underperforming % Underperforming, including “dead” funds 100% 2014 2013 2012 2011 2010 2009 2008 2007 2006 2005 60 70 80 90 0 10 20 30 40 100% 2014 2013 2012 2011 2010 50 60 70 80 90 0 10 20 30 40 50
Notes: Fund universe includes equity funds available for sale in the UK, filtered according to the description above, from the following Morningstar categories: UK equity – flex cap, large-cap blend, large-cap growth, large-cap value, mid-cap, small-cap; Europe equity – Europe OE: flex-cap, large-cap blend, large-cap growth, large-cap value, mid-cap, small-cap; Euro zone equity – flex-cap, large-cap, mid-cap, small-cap; Global – flex-cap, large-cap blend, large-cap growth, large-cap value, mid-cap, small-cap; US equity – flex-cap, large-cap blend, large-cap growth, large-cap value, mid-cap, small-cap; Emerging markets equity – emerging markets; Performance is for periods ending on 31 December 2014. Performance is calculated relative to prospectus benchmark. Fund performance is shown in GBP terms, net of fees, gross of withholding tax, with income reinvested, based on closing NAV prices.
Sources: Vanguard calculations, using data from Morningstar, Inc.
5 – year periods 10 – year periods
Figure 3: Percentage of UK active equity funds underperforming over rolling periods
4 Prior Vanguard research (see Schlanger, 2013) had found that while the overwhelming majority of mutual funds that were merged or liquidated had underperformed their benchmarks prior to being closed, some funds were merged into other, better performing funds. However, the research also found that on average, the act of merger did not lead to the fund outperforming over the full investment period. In some cases, this was because while the new fund was performing better, it was still underperforming the benchmark. In other cases, it was because the magnitude of outperformance post-merger was not enough to offset the magnitude of underperformance pre-merger.
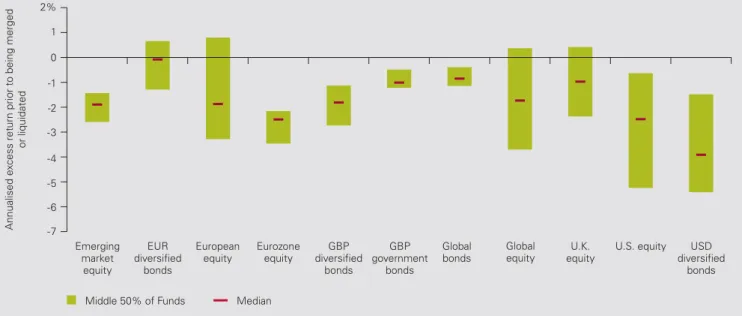
7 Sources: Vanguard calculations, based on data from Morningstar, Inc. and Thompson Reuters Datastream. Displays the cumulative annualised performance of those equity funds that were merged or liquidated within our sample, relative to a benchmark representative of that fund’s Morningstar Category. We measure performance from 1 January 2000 and continue each fund’s measurement period up until the month-end prior to it being merged or liquidated. Fund universe is as described in Figure 2, limited to those funds that were merged or liquidated from Jan 2000 to Dec 2014. Figure A-1 displays the middle 50% distribution of these funds’ returns prior to dying. Performance is measured in GBP terms, net of fees, gross of withholding tax, with income reinvested.
Middle 50% of Funds Median
Annualised
ex
cess ret
urn prior to being merged
or liquidated USD diversified bonds U.S. equity U.K. equity Global equity Global bonds Eurozone equity diversified GBP bonds GBP government bonds European equity EUR diversified bonds Emerging market equity 2% -4 -3 -5 -2 -1 0 1 -7 -6
Figure A-1: Excess return of dead funds over broad benchmark from 1 January 2000 to closing date
6 These results corroborate previous studies on the impact of survivorship bias. Brown and Goetzmann (1995) showed that funds tend to disappear owing to poor performance. In addition, Carhart et al. (2002) showed that the performance impact of dead funds increases as the sample period increases.
survivorship bias into account. Over the rolling 5 and 10-year periods covered in Figure 3, the percentage of funds underperforming has not fallen below 50 percent. So, while performance can be cyclical over time, investors should be mindful of the effects of survivorship bias, as we will talk about in the next section, and should place a greater weight on longer-term relationships that tend to be more stable.
From Figure 3, two key takeaways emerge. First, over more than half of the time periods the proportion of surviving funds underperforming their prospectus benchmark was greater than 50 percent over both 5 and 10-year horizons. We see a notable exception in more recent results that were heavily influenced by 2013, when active UK equity performance was particularly strong. Second, these results are even stronger once we take
Box A: The impact of survivorship bias on performance results
While the objective of active managers is outperformance, we have demonstrated that a majority may not deliver on that objective. However, an additional risk facing investors is that while there may be periods where a majority of actively managed funds outperform, an investor must still select, in advance, one of those outperforming funds and hold it for the entire period. It’s only in hindsight that one can determine if they were correct or not.
To test the assumption that closed funds
underperformed we evaluated the performance of all the funds identified by Morningstar as either being liquidated or merged into another fund. For this analysis we again looked at returns starting in January 2000. We measured the closed funds’ excess returns versus a broad market benchmark from January 2000 up until the month-end prior to the fund’s date of closure. The results are presented in Figure A-1. Clearly, given that in the majority of fund categories more than 75% of the funds trailed their benchmarks prior to being closed, a possible cause leading to the closure of these funds was relative underperformance.6
7 The risk-adjusted performance, defined here as the annualised return divided by annualised standard deviation, was roughly 0.3 for both portfolios.
Of course, when analysing all of the fund categories in Figure 4, we must remember that we are only looking at the funds with returns for the full 15-year period and that these results are likely impacted by survivorship bias. So, Figure 4 represents a more favourable outcome than could likely be achieved by the average investor. While the median fund and portfolio generally underperformed their indices, investors do have the opportunity to select a fund that ranks in the upper half of all managers. Indeed Figure 2 does indicate that there were actively managed funds that survived and outperformed their benchmark. Including such outperformers in a portfolio is the primary objective of investors who use actively managed funds. And if one were to recreate Figure 4 using top quartile funds, the results would shift in favour of the actively managed portfolios.
Implications for investors
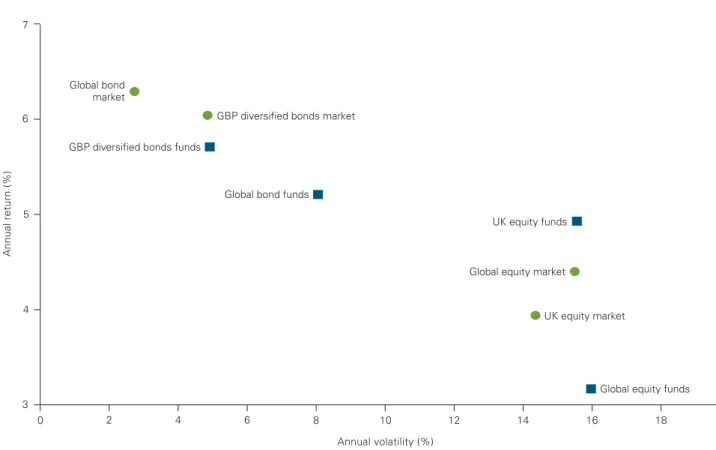
While we have demonstrated the challenges with respect to outperformance, performance in terms of a lower expected return may not be the only consideration. For example, in Figure 4, we show the average return and volatility of the median actively managed funds for four categories from Figure 2 over the 15 year period – Global equity funds, UK equity funds, global bond funds and UK bond funds.
In most cases, the median actively managed funds registered both a lower return and a higher level of volatility than the market benchmark. The one exception to this would be UK equity funds, where the median surviving fund produced a higher return. However, this result was also accompanied by a higher level of volatility. In other words, the active manager took on more risk and was rewarded with higher performance. Therefore, when we risk-adjust the performance, we see that both portfolios delivered similar results.7
0 2 4 6 8 10 12 14 16 18 20 7 3 5 4 6 Annual return (%) Annual volatility (%) Global bond market
Global equity funds GBP diversified bonds market
GBP diversified bonds funds
Global bond funds
Global equity market
UK equity market UK equity funds
Notes: Active funds are represented by square dots and are defined as in Figure 2. We take the median of all surviving funds’ returns and the median of all surviving funds’ standard deviation of monthly returns. Broad market benchmarks include: Global equity – MSCI All Country World IMI, UK equity – FTSE All Share Index, Global bonds – Barclays Global Aggregate Index, UK bonds – Barclays Sterling Aggregate Index. Performance covers the 15-year period ending 31 December 2014 and is expressed in GBP terms, net of fees, gross of withholding tax, with income reinvested based on closing NAV prices. Global bonds are hedged back to GBP.
Source: Vanguard calculations, based on data from Morningstar, Inc. and Thompson Reuters Datastream
9
The critical question for investors is: “Can I pick a winning portfolio in advance?” In other words, would an investor be able to select a winner from the past and expect them to continue to win in the future? For years, academics have studied whether past performance has any predictive power regarding future performance. Dating back to Sharpe (1966) and Jensen (1968), researchers have found limited or no persistence. Carhart (1997) reported no evidence of persistence in fund
outperformance after adjusting for the common Fama-French risk factors (the influence of the equity market, size and style) as well as for momentum. The Carhart study reinforced the importance of fund costs and highlighted how not accounting for survivorship bias can skew results of active/passive studies in favour of active managers. More recently, in 2009, Fama-French’s 22-year study suggested that it is extremely difficult for an actively managed investment fund to outperform its benchmark regularly.
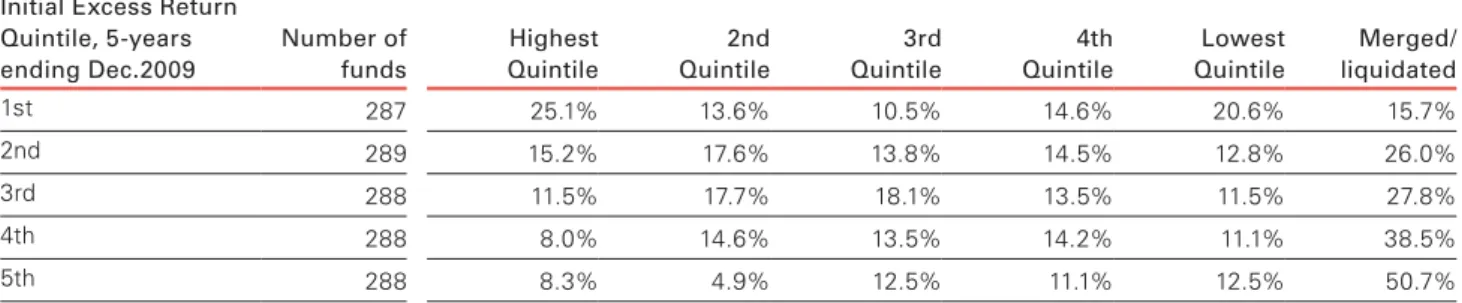
To examine the consistency within the actively managed fund sector, we performed an analysis that ranked all equity funds in terms of their excess returns for the five years ended 2009. We then divided the funds into quintiles, separating out the top 20% of funds, the next best performing 20% and so on. We then tracked their excess returns over the next five years (through to December 2014) to see how consistently they performed. If the funds in the top quintile displayed consistently superior returns, we would expect a significant majority to
remain in the top 20%. A random outcome would result in approximately 17% dispersed evenly across the six subsequent buckets (if we assume that the possibility of a fund closing down as a sixth option).
Figure 5 displays the results for active equity funds available for sale in the UK. Interestingly, the results appear relatively random. While around 25% of the top funds remained in the top quintile of funds over the subsequent five year period, an investor selecting a fund from the top 20% of all funds in 2009 stood a greater than 50% chance of falling into the bottom 40% of all funds or seeing their fund disappear along the way. Indeed, we find that the percentage of highest quintile active funds falling to the lowest quintile or closing (36.3%) exceeds the probability that they remain in the top quintile (25.1%). Stated another way, only 5% of the 1440 funds achieved top quintile excess returns over both the five-years ended 2009 and the five years ended 2014. It is also interesting to examine the subsequent
performance of those funds that were in the bottom quintile in 2009. Fully 50.7% were liquidated or closed by 2014 and 12.5% remained in the bottom quintile, while only 13.2% managed to ‘right the ship’ and rebound to either of the top two quintiles. Indeed, persistence has tended to be stronger for previous losers than previous winners, where ‘past performance has not been a strong indicator of future success’.
Figure 5: Performance consistency among actively managed equity funds
Notes: The far left column ranks all active equity funds based on their excess return over their respective prospectus benchmark return during the five-year period through 31 December 2009. The columns going across the right of the table rank these funds according to their subsequent excess returns over the five-year period through 31 December 2014. Random performance across the six subsequent possibilities (5 quintiles, plus funds that die) would infer a value of 16.67%. The fund universe includes all active equity funds available for sale in the UK, investing in the equity classes as defined in Figure 2. Returns are in GBP terms, calculated net of fees, gross of tax withholding, with income reinvested. Past performance is not a reliable indicator of future results.
Source: Vanguard calculations, based on data from Morningstar, Inc.
Subsequent 5-year excess return rank, to 31 December 2014 Initial Excess Return
Quintile, 5-years ending Dec.2009 Number of funds Highest Quintile 2nd Quintile 3rd Quintile 4th Quintile Lowest Quintile Merged/ liquidated 1st 287 25.1% 13.6% 10.5% 14.6% 20.6% 15.7% 2nd 289 15.2% 17.6% 13.8% 14.5% 12.8% 26.0% 3rd 288 11.5% 17.7% 18.1% 13.5% 11.5% 27.8% 4th 288 8.0% 14.6% 13.5% 14.2% 11.1% 38.5% 5th 288 8.3% 4.9% 12.5% 11.1% 12.5% 50.7%
In Figure 6, we drill down into one fund category to examine the results in more detail, using UK active equity as an example. Not surprisingly, we find a similar result: past performance has not been a strong indicator of future success and there is no systematic tendency for funds that start in the top quintile to remain there. Indeed, 36.5% of funds fell into the bottom two quartiles or were merged or liquidated in the second five-year period. This high turnover with respect to outperformance and market leadership is one reason why changing managers due to poor performance can lead to further
disappointment. For example, in a well reported 2008 study, authors Amit Goyal and Sunil Wahal found that the process of replacing underperforming managers with outperforming managers within US institutional pension plans resulted in performance results far different than expected. The authors evaluated the performance of both the hired and fired managers before and after the decision date. They found that, following termination, the fired managers actually outperformed the managers hired to replace them by 49 basis points in the first year, 88 basis points over the first two years and 103 basis points over the first three years.
Figure 6: Rank persistence of UK active equity funds
Notes: Fund sample includes those funds that were in the top quintile of performance in the five-year period ending 31 December 2009, with performance defined as the excess return over each fund’s prospectus benchmark. The Figure displays the rank of these funds’ subsequent excess returns over the five-year period through 31 December 2014. Random performance across the six subsequent possibilities (5 quintiles, plus funds that die) would deliver a value of 16.67%. The fund universe includes all UK active equity funds available for sale in the UK. Returns are in GBP, net of fees, gross of tax, with income reinvested.
Source: Vanguard calculations, based on data from Morningstar, Inc.
Highest
quintile quintile2nd quintile3rd quintile4th Lowest quintile liquidatedMerged/ 30% 25 20 15 10 5 0 Percent age of funds 27.1% 17.6% 18.8% 7.1% 16.5% 12.9%
11
Box B: Is indexing the only answer?
As we have discussed, there is strong theoretical and practical evidence that the majority of actively managed funds will underperform their benchmarks. We have also discussed how quantifiable inputs such as past
performance are not reliable indicators of future success. From an empirical perspective, this makes the use of active management seem like it has little chance of long-term success. And yet many investors remain drawn to the prospects of outperforming a benchmark with active management. This apparently counterintuitive situation leads some investors to wonder if there are any ways of increasing the probability of success with active
management.
The answer is yes, but there is no formula that will guarantee outperformance. Identifying a successful active manager requires up-front and ongoing due diligence on the investor’s part, making it a resource-intensive process. But once identified, a very talented active manager with a proven philosophy, discipline and process can provide an opportunity for outperformance. This will require finding a manager who can articulate, execute and adhere to prudent, rational strategies consistently and then ensuring that the manager’s strategy fits into the overall asset and
sub-asset allocations of the investor. Topping the list of considerations in active management is attaining talented managers at competitive costs, as cost is the only quantifiable factor we have found historically associated with higher average returns over time. Discipline in maintaining low investment costs, then – that is, administrative and advisory expenses plus costs due to turnover, commissions and execution – is also essential. And, on a forward looking basis, minimising costs will lower the hurdle required for the manager to deliver performance to the investor.
Finally, investors must realise that all active managers, no matter how skilful, will go through periods of
underperformance. So keeping a good manager, once one is found, rather than rapidly turning over the portfolio, is critical. Given the inherent volatility of any individual active fund, only those investors comfortable with what could be extensive periods of underperformance should consider actively managed funds. This requires filtering out noise – especially short-term measures of performance versus either benchmarks or peer groups. Following this process can provide investors with the opportunity, but not a guarantee, of outperformance.
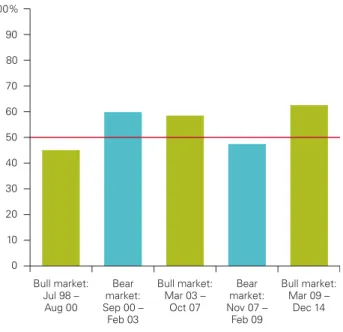
The impact of market cycles on the performance of actively managed funds
Over time and over alternative evaluation windows, the percentage of funds underperforming a particular index will vary. Much of this is due to the cyclical nature of the financial markets. To supplement our analysis in Figure 2, we show Figure 7, which breaks the time period into bull and bear market cycles. A common perception is that actively managed equity funds will outperform their benchmark in a bear market because, in theory, active managers can move into cash or rotate into defensive securities to avoid the worst of a given bear market. In reality, the probability that these managers will move fund assets to defensive stocks or cash at just the right time is low. Most events that result in major changes in market direction are unanticipated. To succeed, an active manager would not only have to time the market, but also do so at a cost that was less than the benefit provided. Figure 7 illustrates how active equity fund managers have performed relative to respective benchmarks across market cycles. The results clearly show that, although there are short periods where active equity managers have been able to outperform, in general there is no systematic tendency for them to do better at particular stages of the cycle. In order to win over time a manager must accurately time the start and end of the bear market and must accurately select winning stocks during each period. Combining these results with those from Figure 2 shows the challenges for long-term investors when electing to use active management.
Figure 7: Percentage of active managers
underperforming market during bull and bear cycles
Notes: Displays the percentage of surviving funds that underperform their prospectus benchmark over the time period shown. Bull and bear markets are the local peak or trough in the global equity market, defined as the MSCI All Country World IMI. The fund universe and categories are as defined in Figure 2. Returns are calculated in GBP net of fees, gross of tax, with income reinvested.
Sources: Vanguard calculations, based on data from Morningstar, Inc.
100% 90 80 70 60 50 40 30 20 10 0 Bull market: Jul 98 – Aug 00 Bear market: Sep 00 – Feb 03 Bull market: Mar 03 – Oct 07 Bear market: Nov 07 – Feb 09 Bull market: Mar 09 – Dec 14
13
Comparing the performance of passive and active funds
The results presented so far showing the average underperformance of actively managed funds would seem to be consistent with the theory of the zero-sum game explained earlier. Before costs, for every invested pound that outperforms the market there has to be a pound that underperforms. But once costs are taken into account, more funds will inevitably undershoot their desired benchmark than overshoot. Moreover, the evidence shows that the population of actively managed funds that we have examined is not able to outperform the rest of the population of investors (retail investors, etc.). The earlier theoretical discussion also suggested that passive funds ought to be able to outperform actively managed funds if (a) active funds are not able, on average, to outperform their chosen benchmarks after costs, and (b) passive funds have lower average costs. Having demonstrated (a), we now turn our discussion to (b).
There is already considerable evidence that the odds of achieving a return that outperforms a majority of similar investors is increased if investors simply aim to seek the lowest possible cost for a given strategy. For example, using evidence from US mutual funds, Financial Research Corporation evaluated the predictive value of different fund metrics, including a fund’s past performance, Morningstar rating, alpha and beta. In the study, a fund’s expense ratio was the most reliable predictor of its future performance, with low-cost funds delivering above-average performances in all of the periods examined. Similar research was conducted by Vanguard. Wallick et al (2011) evaluated a fund’s size, age, turnover and expense ratio, finding that the expense ratio was the only
significant factor in determining future alpha. Additionally, Philips & Kinniry (2010) showed that using a fund’s Morningstar star rating as a guide to future performance was less reliable than a fund’s expense ratio. Practically speaking, a fund’s expense ratio is a valuable guide (although not a sure thing) because the expense ratio is one of the few characteristics that is known in advance.
Category Active Index Difference
Global equity 1.31 0.23 1.08
U.K. equity 0.97 0.51 0.45
European equity 1.69 0.29 1.40
Eurozone equity 1.35 0.32 1.03
U.S. equity 1.31 0.21 1.10
Emerging market equity 1.34 0.26 1.08
Global bonds 0.86 0.19 0.66
GBP Diversified bonds 0.63 n/a n/a
GBP Government bonds 0.56 0.31 0.25
EUR Diversified bonds 0.80 0.65 0.15
USD Diversified bonds 0.90 0.65 0.25
Notes: The average expense ratio quoted for each category of funds represents the asset-weighted average expense ratio based on information in latest available annual report at 31 December 2014. Fund expenses are weighted by the share-class AUM, reflecting the typical investor’s experience in that fund. The fund universe is as described in Figure 2.
Source: Vanguard calculations, based on data from Morningstar, Inc. Data as of 31 December 2014.
Figure 8: Value-weighted OCFs of active and passive funds
Figure 8 shows the average value-weighted OCFs for both actively and passively managed equity funds. It shows clearly that index funds generally operate with lower costs than actively managed funds. Higher OCFs for actively managed funds often result from both the research process and the generally higher turnover associated with the attempt to outperform a benchmark.8
As at 31 December 2014, investors in actively managed global equity funds were paying an average of
approximately 1.31% annually versus 0.23% for index funds. A cost advantage was also seen for index funds in European equity (1.40%), euro zone equity (1.03%), US equity (1.10%), emerging market equity (1.07%) and global bonds (0.66%). The cost disadvantage for actively managed UK equity funds and the remaining bond fund categories is somewhat lower but still significant (the exception is in GBP government funds where the results for the active funds are dominated by one large low-cost active fund).
8 Turnover, or the buying and selling of securities within a fund, results in transaction costs such as commissions, bid-offer spreads, market impact and opportunity cost. These costs, although incurred by every fund, are generally higher for actively managed funds and are not factored into the expense ratios shown in Figure 8. All else being equal, the impact of turnover reduces the net returns realised by investors over time.
Figure 9 illustrates the importance of cost on a fund-by-fund basis, displaying scatter plots for each category of individual fund excess returns plotted against the ongoing charges figure of the fund. Our earlier stylised discussion, as captured in Figure 1 and Figure A-1 in Appendix A, suggested that there ought to be a negative correlation
between the excess return on a fund and the expense ratio associated with that fund. Figure 9 indeed confirms that there is a systematic tendency for funds with higher costs to suffer from lower excess returns.
European equity
Emerging market equity U.S. equity Global equity Eurozone equity 0 -10 -5 5 10 1 2 3 4 5 0 0 -10 -5 5 10 1 2 3 4 5 0 0 -10 -5 5 10 1 2 3 4 5 0 UK equity GBP government bonds GBP diversified bonds
USD diversified bonds Global bonds
EUR diversified bonds
10-year annualised excess returns (%)
Ongoing charges figure (%) 0 -10 -5 5 10 1 2 3 4 5 0 0 -10 -5 5 10 1 2 3 4 5 0 0 -10 -5 5 10 1 2 3 4 5 0 0 -10 -5 5 10 1 2 3 4 5 0 0 -10 -5 5 10 1 2 3 4 5 0 0 -10 -5 5 10 1 2 3 4 5 0 0 -10 -5 5 10 1 2 3 4 5 0 0 -10 -5 5 10 1 2 3 4 5 0 Equity
Figure 9: Scatter plot by fund category of excess annualised returns versus ongoing charges figure
Notes: Returns on the vertical axis are the 10-year annualised excess return over each fund’s prospectus benchmark, to 31 December 2014. Total expense ratio on the horizontal axis is from the latest available annual report as at 31 December 2014. Fund universe and categories are as defined in Figure2. Performance is shown in GBP, net of fees, gross of tax, with income reinvested.
Sources: Vanguard calculations, using data from Morningstar, Inc. Data as of 31 December 2014.
15
Several factors contribute to this wide performance distribution in addition to differences in cost and any skill the managers exhibit: the type of funds included, the benchmark used and the time period analysed can all affect the return distribution and the conclusions drawn. For example, if managers exhibit a style or size bias over a given five-year period, the relative performance of active managers in aggregate can change substantially,
depending on the relative performance of one or more market segments, such as small-cap equities. Similarly, to the extent that different benchmarks cover different groups of securities (even in the same region), the relative performance results can vary.
By contrast, the dispersion of the passive funds is unsurprisingly much narrower, since by construction, the managers of these funds are attempting to generate returns as close as possible to the chosen benchmark. Even so, it is too simplistic to assume that all index funds are created equal. Box C explains in more detail how the implementation of an index strategy is not as
straightforward as sometimes believed and that the deviation of the return of an index fund from its benchmark should be interpreted as a reflection of inefficient fund management. It also explains the
additional benefits to holding an index fund beyond simply hitting the benchmark at low cost, in the form of
diversification and style consistency. Figures 10(a) and (b) display the distribution of excess
returns for equity and fixed income funds relative to their prospectus benchmark index over the past 15-years ending 31 December 2014. Due to data limitations, we have combined all of the equity and bond fund categories into one distribution to increase our sample size for each asset class. We show both the actively managed funds already examined as well as the passively managed fund universe.
A number of striking results emerge from Figures 10(a) and (b). First, as suggested by the earlier results in Figure 2, more of the net returns of the actively managed fund universe are located to the left of the returns of their respective benchmark. Second, the wide distribution of fund returns for actively managed funds is noteworthy; so, for example, in equity funds as shown in Figure 10(a), 18% of the surviving active funds delivered returns more than 2% below their benchmark while only two index funds underperformed by that margin; on the other hand, around 16% of active funds also outperformed their benchmark by more than 2% (something none of the passive funds achieved).
Similarly, for bond funds in Figure 10(b), active funds tended to underperform their benchmark by a larger margin, with no passive funds deviating by more than 1%. For example, 27% of active funds underperformed by 1% or more, while no passive funds underperformed by more than 1%.
Figure 10a: The distribution of equity funds’ performance
Sources: Vanguard calculations, using data from Morningstar, Inc. Displays the distribution of fund excess returns, relative to their prospectus benchmark, for the 15-year period ending 31 December 2014. Fund universe is as defined in Figure 2. Performance is shown in GBP, net of fees, gross of tax, with income reinvested. Past performance is not a reliable indicator of future results.
80 60 40 20 450 400 120 100 500 Number of funds Excess return 0 M er ge d/ Li qu id at ed Active funds Index funds Between -7% and -6% Less than -7%
Between -6% and -5% Between -5% and -4% Between -4% and -3% Between -3% and -2% Between -2% and -1% Between -1% and 0% Between 0% and 1% Between 1% and 2% Between 2% and 3% Between 3% and 4% Between 4% and 5% Between 5% and 6% Between 6% and 7%
Greater than 7%
Prospectus benchmark
Figure 10b: The distribution of fixed income funds’ performance
Sources: Vanguard calculations, using data from Morningstar, Inc. Displays the distribution of fund excess returns, relative to their prospectus benchmark, for the 15-year period ending 31 December 2014. Fund universe is as defined in Figure 2. Performance is shown in GBP, net of fees, gross of tax, with income reinvested. Past performance is not a reliable indicator of future results.
40 30 10 20 80 70 60 50 90 100 Number of funds Excess return 0 M er ge d/ Li qu id at ed Active funds Index funds
Between -3% and -2% Between -2% and -1% Between -1% and 0% Between 0% and 1% Between 1% and 2% Between 2% and 3% Prospectus benchmark
17 9 There are a wide range of possible causes for tracking error with some the result of government regulations. For example, in very narrow indices such as a specific stock market sector or an
individual country, there may be position limits established by the relevant regulatory authorities (either the FCA in the UK or other national regulators in Europe) for how much of any one security can be represented in a portfolio. As such the index fund or ETF cannot replicate the targeted benchmark even if the desire is to do so. This will lead to unavoidable tracking error, but may not be indicative of a poorly managed strategy as the strategy may still reflect the most efficient investable vehicle available.
Box C: The benefits of indexation strategies While on the surface the theory and application of indexing seems straightforward, it’s not as simple as picking just any index fund. An indexed investment strategy – via a mutual fund or an exchange-traded fund (ETF), for example – seeks to track the returns of a particular market or market segment by assembling a portfolio that invests in the same group of securities, or a sampling of the securities, that comprise the market. Indexing strategies use quantitative risk control techniques that seek to replicate the benchmark’s return with minimal expected deviations (and, by extension, with no expected alpha, or excess return versus the benchmark).
However, the targeted benchmark incurs no expenses, inefficiencies or implementation costs, but the return an investor receives in an index fund will reflect those implementation costs, (transaction costs, and other operational or trading frictions). Therefore, a passive fund should provide investors with the best proxy for the achievable orinvestable index return. It is thus incumbent upon an investor seeking to capture the performance of a specific benchmark to identify and then invest in an appropriate product that seeks to track that index, acknowledging that not all indexed investment strategies are created equal.
Because the objective of an indexed strategy is to track a given benchmark as tightly as possible, any deviations from a benchmark’s return over time can be an indication of inefficient management.9 For index funds, one of the
key drivers of potential deviations is the expense incurred along the way to manage the portfolio. Beyond expense ratio, some other factors that might contribute to the effectiveness of tracking a targeted benchmark include the extent to which the index is replicated (which can be a function of the size of the portfolio and the number of securities in the benchmark), the liquidity of the targeted market (resulting in larger or smaller bid-offer spreads), the nature and size of the portfolio’s cash-flow profile and the fund provider’s portfolio and risk management processes. The net result of the factors discussed is that an ideal index fund or ETF would have low expenses, a greater level of index replication and an efficient and risk-controlled portfolio management process. Together, these factors would permit an index fund or ETF to deliver returns very close to, if not identical to, the targeted benchmark consistently over time.
Indexed investments can provide several benefits to investors:
• First, indexed strategies benchmarked to broad market indices can provide greater control of the risk
exposures in a portfolio. For example, filling a recommended equity allocation with an actively managed fund can result in meaningfully different risk and return characteristics than the broad market. This could expose the investor to greater (or less) risk than they targeted by way of their asset allocation decision. • Index funds are typically more diversified than actively managed funds, a by-product of the way indices are constructed. Except for index funds that track narrow market segments, most index funds must hold a broad range of securities to track their target benchmarks accurately, whether by replicating them outright or by a sampling method. The broad range of securities dampens the risk associated with specific securities and removes a component of return volatility. • An index fund maintains its portfolio consistency by
attempting to track the characteristics of the index closely over time. An investor who desires exposure to a particular market and selects an index fund that tracks that market is thus assured of a consistent allocation. On the other hand, an active manager with a broad mandate, such as global equity for example, may invest more or less in a particular country over time depending on her views regarding that country’s prospects, leading to varying risk exposure over time.
Conclusion
Since its beginnings in the early 1970s, indexing has grown rapidly because the strategy can provide a lower-cost investment option to gain exposure to a wide variety of market benchmarks. Of course, index funds are not all created equal, and an investor must not assume that all index funds will perform similarly. In addition, investors should not expect indexed strategies to outperform 100% of actively managed funds. Indeed, there will always be a segment of the investing community that outperforms a benchmark. However, as a result of the zero-sum game, costs and the general efficiency of the financial markets, consistent outperformance by active managers is a difficult prospect.
The results in this paper have demonstrated convincingly that actively managed funds have tended, on average, to underperform their benchmarks and to underperform relative to low-cost passive funds targeting the same benchmarks. For any period, there will inevitably be some active fund managers within the total distribution that are nevertheless able to outperform, but the challenge for investors is to pick those fund managers in advance. Our results suggest that a lack of persistence of performance by specific funds makes it difficult to use past
outperformance as a guide for future outperformance. To the extent that these managers can be identified in advance, this is a resource-intensive exercise requiring an understanding of their investment philosophy and their ability to follow a disciplined approach. Low cost is the one easily quantifiable characteristic that can help identify the better performers.
This paper has shown that there is a compelling case for investors to invest in passive funds on the grounds that they provide higher returns on average and at lower volatility. Also, when deciding between an indexed or actively managed strategy, we have explained why investors should not overlook the advantages in portfolio construction that well-managed indexed strategies bring to bear.
19
References:
Barber, Brad M., and Terrance Odean, 1999. The Courage of Misguided Convictions: The Trading Behavior of
Individual Investors. Financial Analysts Journal 55(6): 41–55. Baron, Jonathan, 2000. Thinking and Deciding. New York: Cambridge University Press.
Brown, Stephen J., and William N. Goetzmann, 1995. Performance Persistence. Journal ofFinance 50: 679–98. Carhart, Mark M., 1997. On Persistence in Mutual Fund Performance. Journal of Finance 52(1): 57–82.
Carhart, Mark M., Jennifer N. Carpenter, Anthony W. Lynch, and David K. Musto, 2002. Mutual Fund Survivorship. Review of Financial Studies 15(5): 1439–63.
Ennis, Richard M., and Michael D. Sebastian, 2002. The Small-Cap Alpha Myth. Journal of Portfolio Management 28(3): 11–16.
Evans, Richard E., and Burton G. Malkiel, 1999. Earn More (Sleep Better): The Index FundSolution. New York: Simon & Schuster.
Fama, Eugene F., and Kenneth R. French, 2010. Luck versus Skill in the Cross-Section of Mutual Fund Returns. Journal of Finance, 65 (5) 1915-1947.
Financial Research Corporation, 2002. Predicting Mutual Fund Performance II: After the Bear. Boston: Financial Research Corporation.
Goyal, Amit, and Sunil Wahal, 2008. The Selection and Termination of Investment Management Firms by Plan Sponsors. Journal of Finance 63(4): 1841, Table 10. Investment Company Institute, 2001. Frequently Asked Questions About Shareholder Response to Market Volatility. Washington, D.C.: Investment Company Institute, Sept. 18; http://www.ici.org.
Investment Company Institute, 2010. 2010 Investment Company Factbook, 50th ed. Washington, D.C.: Investment Company Institute
Jensen, Michael C., 1968. The Performance of Mutual Funds in the Period 1945–1964. Papersand Proceedings of the Twenty-Sixth AnnualMeeting of the American Finance Association,Washington, D.C., 28–30 December 1967. Also Journal of Finance 23(2): 389–416.
McGuigan, Thomas P., 2006. The Difficulty of Selecting Superior Mutual Fund Performance. Journal of Financial Planning 19(2).
Malkiel, Burton G., 2004. Can Predictable Patterns in Market Returns Be Exploited Using Real Money? Journal of Portfolio Management (30th Anniversary Issue): 131– 41. Malkiel, Burton G., 1995. Returns From Investing in Equity Mutual Funds, 1971 to 1991. Journal of
Finance 50 (2, June): 549–72.
Malkiel, Burton G., and Aleksander Radisich, 2001. The Growth of Index Funds and the Pricing of
Equity Securities. Journal of Portfolio Management 27(2): 9–21
Philips, Christopher B., 2010a. The Case for Indexing: European and Offshore-Domiciled Funds. Valley Forge, Pa.: The Vanguard Group.
Philips, Christopher B., 2010b. Determining the Appropriate Benchmark: A Review of Major Market Indexes. Valley Forge, Pa.: The VanguardGroup.
Philips, Christopher B., and Francis M. Kinniry Jr., 2009. The Active-Passive Debate: MarketCyclicality and Leadership Volatility. Valley Forge, Pa.: The Vanguard Group.
Philips, Christopher B., and Francis M. Kinniry Jr., 2010. Mutual fund ratings and future performance. Valley Forge, Pa.: The Vanguard Group.
Sauter, Gus, 2002. Index Rex: The Ideal Index Construction. Journal of Indexes, 2d. quarter; http://www.
journalofindexes.com/contentsphp?id=12.
Schlanger, Todd and Christopher B. Philips, 2013. The mutual fund graveyard: An analysis of dead funds. Valley Forge, Pa.: The Vanguard Group.
Sharpe, William F., 1966. Mutual Fund Performance. Journal of Business 39 (1, Part 2: Supplement on Security Prices): 119–38.
Sharpe, William F., 1991. The Arithmetic of Active Management. Financial Analysts Journal 47(1): 7–9. Wallick, Daniel W., Neeraj Bhatia, Andrew S. Clarke and Raphael A. Stern, 2011. Shopping foralpha: You get what you don’t pay for. Valley Forge, Pa.: The Vanguard Group. Waring, M. Barton, and Laurence B. Siegel, 2005.
Debunking Some Myths of Active Management. Journal of Investing (Summer): 20–28.
10 In Figure 2 in the main text it is also true that the proportion of active funds that outperform the benchmark is less than the proportion for passive funds. But in general that will not be the case; if the return distribution of passive funds is very tightly distributed around a return just less than the benchmark (by an amount attributable to costs), then they will all fall short of the benchmark (but not by much) while the high-end tail of the active distribution will still contain funds that outperform the index.
Appendix A: Analysis of the relative performance of passive and active funds
This paper has explained the simple theory of the zero-sum game. Before costs, for every investment that outperforms the index of a chosen market, there has to be another one that underperforms. But once costs are taken into account, it means that low-cost index funds will have a greater probability of outperforming higher cost actively managed funds. Since passively managed funds tend to incur much lower costs than actively managed funds, this would imply that the median actively managed fund will tend to underperform relative to the median passively managed fund.
One potential counter-argument to this powerful result is that active mutual fund managers do not represent the totality of active investors in a given market; other investors include, but are not limited to, hedge funds, pension funds, separately managed account managers and holders of individual securities. So, if active fund managers were able to outperform their benchmark systematically before costs, then this might suffice to compensate for, or even outstrip, the deleterious effects of higher costs on performance.
This argument can be clarified by using a more
complicated version of the simple zero-sum game chart from Figure 1. Let us make the assumptions that (a) passive funds are lower cost than actively managed funds; (b) the pre-cost returns on active and passive funds
equal those of the benchmark (consistent with the zero-sum game theory); and (c) the returns of passive funds are more tightly distributed around the mean benchmark return than those of active funds. The evidence provided in the main text suggests that these assumptions are realistic.
Figure 11 illustrates the respective distributions of pre-cost returns with a blue bell curve for passive funds and a green curve for active funds. Note that the distribution for the passive funds is taller around the benchmark return because there is a higher probability associated with achieving these returns with passive funds. By contrast, the tails of the active fund distribution are fatter at returns farther away from the benchmark. Figure 11 also
illustrates the respective post-cost returns by a corresponding blue-dashed line for passive funds and green-dashed line for the active funds. By assumption, the green-dashed curve representing the active-fund distribution is shifted further left than the blue-dashed passive distribution and remains more widely distributed. This chart yields a powerful conclusion under the maintained assumptions. The majority of actively managed funds underperform relative to the average return on passive funds (see the green shaded area, which comprises less than half of the total distribution of returns on active funds). This is because the return distribution of active funds has been pushed down more by costs than that of passive funds.10
21 P ro ba bil it y
Expected return relative to benchmark (pp) Cost of
passive investments
Source: The Vanguard Group, Inc.
-5 -4 -3 -2 -1 0 1 2 3 4 5
Median return of active assets
Cost of active assets
Median return of passive assets Benchmark return
Shaded area: % active assets beating median passive investments
Active assets, pre-costs Active assets, post-costs
Passive assets, pre-costs Passive assets, post-costs
fund by asset holdings, thereby only recording a return for each fund name once. Given the lesser availability of fund holdings, we have fewer results and only over a ten year time period on this basis, but we find the main
conclusions from those results are largely unaltered. For most equity categories, the asset-weighted average actively managed fund underperforms its relevant market benchmark. For fixed income funds, the results are similar, with the exception of global bond funds, where a mismatch between the funds and the bond market benchmark was an issue.
Appendix B: Robustness check using asset-weighted returns
In the main text, we show results where we use all share classes of funds in order to capture the broadest
perspective of investor performance. This approach is taken to capture the influence of differential costs on returns of otherwise identical funds. But it does run the risk of over-weighting particular investment strategies. So, as a robustness check, we also present results here on an alternative basis where we weight the returns on the
Figure 12: Asset-weighted excess returns
Notes: Displays the excess return over a broad market benchmark, as defined in Figure 3. We weight monthly returns of all share classes of all funds by their net assets on a monthly basis, and compound the asset-weighted monthly returns for each category. This corrects for “double-counting” of various share classes of a single fund, and gives a view of performance from the perspective of the average pound, as opposed to the average fund. Dead funds are included until they drop out of the dataset. Performance to 31 December 2014, measured in GBP terms, net of fees, gross of withholding tax, with income reinvested.
Source: Vanguard calculations, using data from Morningstar, Inc.
Global equity U.K. equity
European equity Eurozone equity
U.S. equity
Emerging market equity
Global bonds
GBP diversified bonds
GBP government bonds EUR diversified bonds USD diversified bonds
Annualised excess returns
-5 -4 -3 -2 -1 0.0 1.0 2%
VAM-2015-03-17-2445
Important information
This document is directed at professional investors in the UK only, and should not be distributed to or relied upon by retail investors. It is for educational purposes only and is not a recommendation or solicitation to buy or sell investments.
The information on this document does not constitute legal, tax or investment advice. You must not, therefore, rely on the content of this document when making any investment decisions.
The value of investments, and the income from them, may fall or rise and investors may get back less than they invested. Past performance is not a reliable indicator of future results.
Issued by Vanguard Asset Management, Limited which is authorised and regulated in the UK by the Financial Conduct Authority. © 2015 Vanguard Asset Management, Limited. All rights reserved.