TURNING DATA INTO INFORMATION FOR TRANSPORT
DECISION MAKING
Anita Vandervalk Cambridge Systematics, Inc.
ABSTRACT
Transport policy makers, planners and operators around the world are faced with declining budgets along with demanding customers expecting smoothly operating multimodal systems supported by real-time travel information. There continues to be an ever growing source of data and information regarding travel times, travel speeds, modal options, weather, incidents and asset conditions to support planning, modeling and operations of systems. However, high-level decision makers responsible for funding and project decisions do not always have the tools and resources they need to make optimal use of all the new data available to them.
This paper presents challenges, best case examples and provides ideas for the future of institutional and technical tools and processes for data to optimize transport systems through exploration of the following topics:
Common public and new private sector data sources for planning and policy Role of Data in Performance Management
Impetus for data integration and transformation to support decision making New paradigms for data acquisition
Technical challenges such as location referencing, ownership/cost of data or ensuring integrated data is relevant and useful
Data governance techniques to ensure data can be shared and integrated Integration/fusing/visualization tools
Opportunities to enhance data programs through technologies and collaborations Several examples of successful transport planning and operations data integration practice using a variety of tools and methods from around the United States are included.
European transport agencies will benefit from this paper by gaining insight into methods and ideas for integrating, collecting and harmonizing data. Discussion regarding sharing resources and research between Europe and North America to advance the state of the practice in turning data into information is certainly a benefit to all.
BACKGROUND
As public organizations, Departments of Transportation (DOTs) are information-intensive environments. DOTs are the places where thousands of transportation professionals need resources, capabilities, coordination, and knowledge to forge together large volumes of data from disparate sources with human insight and expertise to solve critical problems necessary to serve the public’s transportation needs. The public is demanding greater safety while traveling, requiring more research and development into safe driving, accident prevention measures, and homeland security protection. DOTs are delivering more services through open government initiatives on-line using Internet and mobile services to fulfill emerging strategies at the federal, state, and local levels increasing transparency, participation, collaboration, and innovation. Rapid changes in the Internet and computer technologies are enabling the delivery of government services.
As DOTs provide well-planned, safe, and secure transportation services, these activities generate an ever-growing collection of data. The data is translated into information daily, describing the movement of people and goods by land, sea, and air, the construction and maintenance of transportation infrastructures, and the economic vitality of transportation services. The full range of information produced by transport agencies – research studies, engineering diagrams, environmental reports, asset inventory databases, traffic data, geographic information systems (GIS) layers, and so on – is substantial.
The challenges DOTs face include aging infrastructure, evolving customer expectations, availability of new sources of data, rapid technology/innovation advances and outdated information technology (IT) strategies. They need a well-designed strategy for data, analytical tools and information technology to support and institutionalize new processes around economics, freight, and project selection. Some of the real time data sources that are the subject of this paper include:
Traveler information systems such as current traffic conditions (e.g., travel time, speed, level of congestion) and traffic incidents, work zone, and/or lane closures. Traffic control systems including time and location of traffic control actions (e.g.,
ramp metering, traffic signal control, lane control signals, message board content).
Incident and emergency management systems such as location, cause, extent, and time history of roadway incident/emergency detection and clearance, incident timeline.
Roadway infrastructure data such as roadway characteristics, intersection data, and traffic control data.
Vehicle probe data including recent real time speed and travel time such as historical speed and travel time; data quality measures – completeness, accuracy, latency; and validation.
State/local generated detector data including recent real time volume, occupancy, speed, travel times, vehicle type; and historical volume, occupancy, speed, travel times.
Weather data including date/time, roadways affected, type, intensity.
Advanced public transit systems including transit vehicle passenger boarding by time and location, vehicle trajectories, passenger origins, and destinations.
Network typology such as link capacity, free flow speed, number of lanes.
Origin/destination data in the form of surveys, travel diaries, or direct monitoring. Traffic monitoring and detection systems including vehicle volume, speed,
classification, weight, turning movements, and position trajectories.
In general, the information needs to be organized and fused for optimum decision making. This paper is organized in the following sections
Data, Information and Wisdom Types of Public Data and Decisions Private Sector New Data Sources
The Role of Data in Performance Management Data Management and Governance
Integration and Sharing Challenges Example Models and Tools
DATA, INFORMATION AND WISDOM
Figure 1 depicts a concept of how data evolves from information and eventually knowledge. In general, data can be turned into information and wisdom as connectedness and understanding grows.
Figure 1 – Path of Data, Information, Knowledge, and Wisdom
Source: http://www.systems-thinking.org/index.htm
The Systems Thinking organization defines data, information and knowledge as follows: Data are transactions that are recorded, classified, and stored, but not organized to convey any specific meaning. Data items are captured in the form of numbers, characters, images, or other outputs from devices that collect information. Data are often viewed as the lowest level of abstraction from which information and then knowledge are derived.
Information is data organized in a form useful for analysis and decision-making. Information is considered data that is organized to provide context and meaning to the end user. The user interprets the meaning and draws conclusions and implications from the information. Data items are processed into information by means of an application. For the purposes of this report and research, the terms “data” and “information” are used interchangeably.
Knowledge is information that has been combined with experience, context, and interpretation that make it possible to understand and draw implications from both data and information. Information and knowledge are closely related, but not the same. Knowledge consists of data and information that have been organized and processed to convey understanding, experience, accumulated learning, and expertise as they apply to a current problem or activity.
connectedness data understanding information knowledge wisdom understanding principles understanding patterns understanding relations
These terms are useful to apply to transport data and information in this paper.
TYPES OF PUBLIC DATA AND DECISIONS
The United States Department of Transportation (U.S. DOT), including the Federal Highway Administration (FHWA), Federal Transit Administration (FTA), among other agencies, collects a number of national transportation surveys, prepares state and regional guidance on how to collect these and other data, provides guidance on how state and regional agencies can use this data for localized planning, and uses this data to generate national reports on transportation. In the U.S., there is no single survey or database that is used to support all of the nation’s planning and policy needs; rather, the U.S. DOT collects a wide variety of surveys to meet their national planning needs.
Illustrative examples of the types of surveys and datasets that are sponsored, collected, and prepared by FHWA in partnership with the Bureau of Transportation Statistics (BTS) and other national agencies are listed below. The following examples represent only a snapshot of the types of surveys and data that are collected regularly for one agency.
FHWA designs, collects, and uses surveys to generate national statistics (e.g., accident casualties), identify trends (e.g., commodity flows by truck, rail, air, and seaport), and develop reports (e.g., highway statistics) about key national transportation impacts and trends. Not one data source is used to support these analyses; multiple data are collected. For example:
o FHWA and BTS periodically (no set timeline) collect the National Household Travel Survey (NHTS) (last collected in 2001-2002) to identify national, state, and regional travel demand trends of different parameters (mode choices, origins and destinations, auto usage, trip types, etc.). Agencies use this data to help develop state and regional travel demand models and support long-range transportation planning. Many state and regional agencies have also worked with FHWA/BTS to collect additional surveys to provide a more robust sample for their regions for purposes of model development.
o U.S. Census and BTS periodically (every 5 years) collect the Commodity Flow Survey (last collected in 2007) to identify information about goods movement in the United States (commodity types, value, weight, mode of transport, etc.). Agencies use this data to support the development of state and regional goods movement plans and demand models. This data is also used to help FHWA identify national goods movement trends.
FHWA prepares data collection frameworks, guidelines, and methods for all types of surveys for use by state and regional agencies for transportation planning, policy, and travel demand modeling. For example:
o FHWA developed the 1996 Travel Survey Manual (authored by Cambridge Systematics) for use by state, regional, and local planners. This manual is a
living document that has been updated periodically since 1996 and can be accessed on-line by state, regional, and local practitioners responsible for managing, designing, conducting, and using travel surveys of all types. Surveys documented in this manual include household travel, vehicle intercept, transit on-board, commercial vehicle, workplace/establishment, visitor, parking, state preference, longitudinal, and GPS surveys.
o FHWA created the Quick Response Freight Manual designed to assist state, regional, and local practitioners develop freight forecasts and analysis for state and regional goods movement planning. This manual provides information about data collection methods, sketch planning modeling methods, among other guidance for planners to develop freight forecasts.
FHWA is responsible for assuring that consistent and reasonable highway transportation data and systems performance information are available to support its national functions. In this case:
o FHWA initially developed the Highway Performance Monitoring System (HPMS) in 1978 as a national highway transportation system database. Currently, HPMS data are compiled from various sources and used to identify the conditions and performance estimates of expected future highway investment needs of the U.S. FHWA has prepared an HPMS Field Manual that provides states with detailed data collection and reporting requirements that is intended to guide the development of each state’s HPMS submittal to FHWA. Each state is required to submit their HPMS datasets annually. HPMS is the official national source of data on the extent, condition, performance, use, and operating characteristics of the nation's highways. States also use this information to support long-range transportation planning and policy.
In addition to these national data sources, many state and local planning agencies collect vast amounts of data related to performance of the system, traffic volumes, geometric features and asset conditions. In addition to traditional data, newer privatized sources such as probe data, cellular phone and Global Positioning System (GPS) data are becoming available. The challenge for transport agencies is to collect, assemble, integrate, analyze and visualize the data to make informed decisions regarding transport policies and projects
Figure 2 is a model of the components of data, information and decisions in state departments of transportation in the United States. Many tools such as forecasting and modeling are applied as data is turned into information. The business functions including collection, analysis, integration and visualization of data are shown at the bottom of the model. The types of decisions made based on the information include operations, planning, funding (i.e. which projects are funded), policy and programming. The outcome of the decision making process often results in a feedback to the types of data collected at the beginning of the model.
Figure 2 – Model of Data, Information and Decisions for Transportation Agencies in the U.S.
PRIVATE SECTOR NEW DATA SOURCES
In an ideal transportation planning world, an analyst has access to national data sources such as census and travel surveys; locally collected data such as traffic and pavement condition; and privately available (non-intrusive) data sources such as origin/destination from GPS or speeds for other probes such as cell phones.
Probe vehicle techniques involve direct measurement of travel time (along a route or point to point) using data from a portion of the vehicle stream. In the case of toll tag and Bluetooth, probe measure technology is based on collecting vehicle identification data and time stamps of vehicles passing a roadside reader device and checking against the last reader passed to determine the travel time between reader locations. Wireless (cellular) location technology, crowd-sourcing and private provider data are based on tracking vehicles either through cell phone triangulation using cell towers or through GPS location tracking technology. Both types of probe technologies provide direct travel time output. Speed can be estimated by knowing the distance between the detector (reader) locations. For the location tracking technologies, speed can be calculated by the change in location and time. Origin/destination data can also be obtained as direct input to travel demand modeling.
The following describes some of the newer data sources.
Toll Tag Readers - The toll tags typically used for electronic toll collection can be used by toll tag readers deployed at various points on a roadway network to obtain
average travel time and speed information. There are four components in a toll tag travel time system: electronic tags, antennas, readers, and a central computing and communication facility. As a vehicle with an electronic tag passes underneath a toll tag reader, the time and toll tag identification number are recorded. If the same vehicle passes the next reader location, the travel time and average speed between the two locations can be determined. The toll tag identification number can be encrypted to protect privacy.
Bluetooth Device Matching - Many computers, car radios, navigation devices, PDAs, cell phones, headsets, and other personal devices are Bluetooth enabled to allow wireless communication between devices. Generally, manufacturers assign unique Median Access Control (MAC) addresses to Bluetooth equipped devices. Bluetooth-based travel time measurement involves identifying and matching the MAC address of Bluetooth-enabled devices carried by motorists as they pass a detector location. Bluetooth device matching can be used to measure arterial travel time, average running speed, and origin-destination patterns of travelers. Because the MAC addresses are not tracked when the device is sold within the marketplace, the MAC addresses can be detected and matched without establishing a relationship to the device owner, therefore keeping the traveling public and their personal or sensitive information anonymous.
Wireless Location Technology - Wireless location technology (WLT) involves using signaling information from cell phones (such as cell tower handoffs) to anonymously track wireless devices as they traverse a roadway network. Cell tower handoffs refer to calls transferred from one tower to another, during which the cellular phone is assigned a new frequency. By tracking the handoffs between towers, it is possible to determine which road a vehicle is traveling on and derive average travel time and speed information for that roadway. Major vendors of the technology include Cellint (TrafficSense system), AirSage, and Delcan.
Crowd-Sourcing - Crowd-sourcing is the newest technology, which involves obtaining real-time traffic congestion information from drivers’ GPS-enabled mobile phones. Crowd-sourcing relies on a large number of users and is primarily to support personal navigation systems and mobile applications.
Private Data Providers - Private data providers combine information from multiple probe technologies such as cell phones, toll tags, crowd-sourcing, and fleet-based GPS probe vehicles, as well as data from existing fixed-sensor networks such as loop- or radar-based detection. The data is then fused to provide real-time travel time estimates and incident information. Private data sources include INRIX, Navteq Traffic, TomTom, Clear Channel’s Total Traffic Network and American Transportation Research Institute (ATRI).
There are many challenges associated with obtaining this private sector data. Issues include cost, limited availability with strict use policies and non-disclosure agreements, and privacy. Others include the ensuring the data is useable in terms of quality; including timelines, coverage, and accuracy.
THE ROLE OF DATA IN PERFORMANCE MANAGEMENT
In the United States, data plays a very important role in supporting performance management. Recent legislation passed in the summer of 2012 has the following provisions that relate directly to performance measures and data:
Establishes a new program, “the National Highway Performance Program” for addressing national goals on the National Highway System;
Identifies seven national goals areas, and potential measures for each;
Money will not be allocated based on targets, but if states underperform for two reporting periods they must describe the actions necessary to achieve their targets; and
Statewide and regional plans must use a performance-based approach to decision making that support the national goals. Measures and targets must be considered when developing policies, programs and investment priorities. Plans must include measures, targets, and a performance report comparing actual performance to target values.
The national goal areas: safety; infrastructure condition; congestion reductions; and system reliability.
Under the research area, the new legislation calls for enhanced research and development activities in several priority areas including:
Enhance mobility and productivity through improved traffic management, incident management, transit management, freight management, road weather management, toll collection, traveler information, or highway operations systems and remote sensing products; and
Use interdisciplinary approaches to develop traffic management strategies and tools to address multiple impacts of congestion concurrently.
Many state departments of transportation are already using a performance management framework to incorporate data into their planning and policy programs. Figure 3 is a framework that is recommended in a recently published Transportation Research Board report Target-Setting Methods and Data Management To Support Performance-Based Resource Allocation By Transportation Agencies.
Figure 3 - Performance Management Framework
The following describes the components of the figure.
Establish Goals and Objectives. Performance-based resource allocation decisions are anchored in a set of policy goals and objectives that identify an organization’s desired direction and reflect the environment within which its business is conducted. For example, many state DOTs have well-defined goals for the transportation system, including infrastructure condition, level of service and safety, as well as goals reflecting economic, environmental and community values. Likewise, the private sector frequently establishes policy goals to guide production of products and services while defining the environmental and community context for its investment decisions.
Select Performance Measures. Performance measures are a set of metrics used by organizations to monitor progress toward achieving a goal or objective. The criteria for selecting measures often include:
Feasibility;
Policy sensitivity;
Ease of understanding; and
Figure 1.1 Performance Management Framework
Goals/Objectives
Performance Measures
Target Setting
Evaluate Programs and Projects
Allocate Resources Budget and Staff
Measure and Report Results Actual Performance Achieved
Usefulness in actual decision-making.
Identify Targets. Targets are a quantifiable point in time at which an organization achieves all or a portion of its goals. These points set a performance level for each organizational measure, such as achieving a 25 percent reduction in highway fatalities by 2030. The methods used to set such a target include:
Establish performance management framework; Evaluate the factors influencing target-setting; Select the appropriate method(s) for target-setting; Establish methods for achieving targets;
Track progress towards targets; and Adjust targets over time.
Allocate Resources. The allocation of resources (time and money) is guided by the integration of the preceding steps into an organization’s planning, programming and project development process. To the extent possible, each investment category is linked to a goal/objective, a set of performance measures, and a target. Specific investment proposals are defined in relation to specific targets.
Measure and Record Results. The data for each performance measure must be regularly collected and periodically analyzed. The analysis should indicate how close the organization is to achieving its targets and identify the actions necessary to improve results. Many public and private sector organizations have tracking systems in place to monitor performance allowing senior staff to make periodic budget adjustments.
Create Data Management Systems. “Good” data is the foundation of performance
management. Effective decision-making in each element of the performance management framework requires that data be collected, cleaned, accessed, analyzed, and displayed.
There are many issues – both technical and institutional that must be dealt with to successfully integrate and maximize the utility of data from a variety of sources. Institutional challenges may include centralized policymaking, and decentralized execution of those policies; limited appreciation by decision makers of the role of data systems in supporting business operations; and lack of formal policies and standards to guide the collection, processing, and use of data within the organization. These issues are addressed in the following section (Data Management and Governance). The second key dimension centers on the technical challenges associated with data systems, including development and maintenance of hardware and software and the specifications for data collection, analysis, archiving, and reporting. These are discussed in the section titled Integration and Sharing Challenges.
DATA MANAGEMENT AND GOVERNANCE
It is very clear that quality, timely data is the backbone of the planning and policy processes in the U.S. Various data systems throughout the organization serve the needs of decision-makers in multiple business areas. Data are the basic pieces of information which, when processed through a system, are available for analysis. The core data pieces transform into information and decision-makers then use this information to manage business functions across the organization. The process for ensuring that data is of the highest quality possible is known as a data management process. Data management programs are used to manage the data systems within the organization.
Data management can be defined as the development, execution and oversight of architectures, policies, practices, and procedures to manage the information life-cycle needs of an enterprise in an effective manner as it pertains to data collection, storage, security, data inventory, analysis, quality control, reporting, and visualization. There are many ways to approach establishing a data management program, however, one of the most effective ways is to incorporate data management in concert with an overall data governance framework.
Data governance can be defined as the execution and enforcement of authority over the management of data assets and the performance of data functions. The implementation of data governance includes participants from many areas of the organization. These individuals are usually already performing many of the roles identified with data governance, but their job functions have not been aligned within a formal data governance structure. For instance, persons within a business unit who enter data into a system and are responsible for the quality of the data are referred to as data stewards within the data governance model.
The following steps outline how transportation agencies can use data management and governance to strengthen existing performance measurement and target-setting programs in the agency.
Step 1 – Establish the Need for Data Management/Governance. Define the important relationship between data management and performance measurement and provide a maturity model to assess the state of data governance at the organization.
Step 2 – Establish Goals for Data Management. Once an agency has committed to making improvements in their data management practices, a plan to achieve this should be developed. A strong data management program improves data quality and limits potential risks to the agency regarding loss of critical data and information. Step 3 – Assess Current State of Data Programs. There are tools and techniques available to assist the organization in assessing the current data practices and programs. These tools are known as business intelligence (BI) tools and this report
provides several examples of the use of BI tools in the case studies documented in Volume III.
Step 4 – Establish Data Governance Programs. The agency should develop and implement a data governance framework model that best meets the needs of the organization. There is not a one-size fits all data governance model. Figure 4 illustrates a generic data governance framework that includes all of the traditional participants in a data governance model.
Step 4.1 – Identify the business objectives of the agency.
Step 4.2 – Identify the business functions or services of the agency that support the business objectives.
Step 4.3 – Identify which business functions are supported by which data programs.
Step 4.4 – Establish policies, standards, and procedures that mandate how data is to be collected and used within the agency.
Step 4.5 – Establish Data Action plans on both a data program and enterprise level, to address needs and gaps in data and information across the agency. Step 4.6 – Establish a risk management plan for protecting data programs as
valuable assets of the agency.
Step 5 – Technology for Data Management. The agency should utilize the tools
available to support data management, including knowledge management systems, risk management systems, geographic information systems (GIS), and visualization tools, such as dashboards and scorecards.
Figure 4 - Standard Data Governance Model
Figure 3.2 Overview of a General Data Governance Framework
Strategic Vision, Mission, Goals for Data
Agency Data Programs
Data Governance
Board
Data Users and Stakeholders
Division(s) Mission(s) and Goals
Data Steward and Custodians
In the area of data governance, the Federal Highway Administration (FHWA) Office of Operations is currently developing a Data Business Plan. It focuses on travel mobility data and the connected vehicle data capture program and is based on the following goals and objectives:
GOAL 1. Improve the coordination and communication mechanism across U.S. DOT and FHWA offices involved with roadway travel mobility data to avoid investing resources in the same or similar types of data related programs.
Objective 1.1. Identify gaps and redundancies in roadway travel mobility data programs.
Objective 1.2. Devise “rules of engagement” regarding collaboration of the data functions for roadway travel mobility data.
GOAL 2. Improve the coordination of the connected vehicle data capture program with other related data programs within U.S. DOT and FHWA.
Objective 2.1. Identify how current and planned data from the connected vehicle initiative can support existing data programs.
Objective 2.2. Identify how data from other mobility related programs within U.S. DOT and FHWA can support the connected vehicle initiative.
Objective 2.3. Identify existing/future data inventory and data structures/ policies/governance practices that could be applicable to the Research Data Exchange.
INTEGRATION AND SHARING CHALLENGES
Some of the data issues that must be considered and addressed when sharing and integrating data include:
Data Integration.A broad range of transportation agency decision-making across both planning and operations functions can be captured through the integration of the data sources. Depending upon the selected data sources, partners, and analyses, a data hierarchy may need to be established to organize the data sources.
Data Resolution.Data resolution needs – both temporal and spatial – vary according to the application. Data resolution will need to be considered based upon the selected operational strategy(ies), performance measures, and analysis tools and methods for each iteration, keeping the subsequent framework builds under consideration.
Data Quality.Needs here include how to improve data quality at the source (if possible) and avoid “scrap and rework”; applying business rules (quality checks) to automate the identification of invalid data; making data quality results available to data and
information consumers; and considering the development of data quality standards to ensure a base level of quality.
Active versus Passive Archiving.Active archiving involves a higher level of data management methods and protocols.
Rigid Data Format Standards versus Flexible Formats with Metadata. This includes assessingto what degree the data should be archived in a universal or common data structure (e.g., a formal data dictionary). For example, is it sufficient to allow data to be stored in user-defined or native formats as long as detailed metadata describing it is supplied? Metadata is typically used to: determine the availability of certain data; determine the fitness of data for an intended use; determine the means of accessing data; and enhance data analysis and interpretation by better understanding the data collection and processing procedures.
Data Integration (Fusion) Issues. Using archived data requires a variety of data management and integration skills, particularly in cases where the data comes from more than one provider and includes more than one type of data. Some of the key data integration issues that need to be assessed include data types/sources, location
matching, version control, and integration with analysis methods/tools.
Data Transformation.Data transformation is the act of changing data and is quite common in archiving real-time traffic data in a data archive. Transformation can be as simple as aggregating data over time and space or as complicated as creating new metrics (e.g., travel-time based performance metrics from detector measurements).
EXAMPLE MODELS AND TOOLS
The issue becomes prioritizing the data sources, integrating them and making them useful for making decisions. This often necessitates the need for tools such as performance dashboards or tradeoff analysis tools. This section includes some examples of frameworks and tools currently in development in the United States to tackle the challenges discussed in this paper. The tools are not described in detail but will be discussed during the presentation.
Figure 5 shows an example framework for sharing a variety of real time data to support planning and operations functions for state or regional transport agencies. The focus is on clearly identifying all components including data types, sources, elements, and tools and applications. Identification and application of business rules such as metadata, definitions and formats are equally important in ensuring the success of a data sharing initiative.
Figure 5 – Example Real Time Data Sharing Model
Figure 6 is an example of a tool that can be used to integrate diverse transportation data streams in a hosted web application. The tool integrates volume and speed data from Intelligent Transportation System (ITS) detector networks, real-time and predicted speed from probe vehicles, incident characteristics and locations, operational data, and weather conditions. It enables DOTs to organize, visualize, interpret, and make productive, actionable use of these data.
Figure 6 – Example Real Time Data Integration Tool
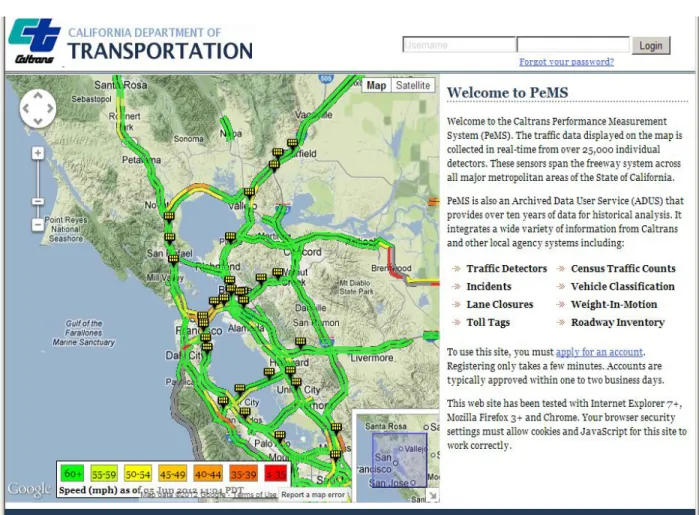
Figure 7 – California Performance Measurement System
Figure 8 is a regional transportation integrated information systems developed by the University of Maryland. It is currently in use in many states and successfully supports real time data integration and sharing.
Figure 8 – Regional Integrated Transportation Information System
CONCLUSION
This paper serves as a resource for transport agencies interested in organizing, integrating their data better to support policy, planning and operations of multimodal transportation systems in real time. This paper explores many of the challenges associated with organizing, integrating and sharing data and examines best practices for use of data in support of decision-making at transport agencies. Some examples of practical tools and technology are also presented to illustrate how these tools can be used to facilitate dissemination, integration, and sharing of data and information, ultimately resulting in sufficient knowledge for decision-making purposes.
BIBLIOGRAPHY
Cambridge Systematics, Inc. (2010) Target-Setting Methods and Data Management to Support Performance-Based Resource Allocation by Transportation Agencies, Volumes I and II, National Cooperative Highway Research Program (NCHRP) Transportation Research Board, Washington, D.C.
University of Illinois and Cambridge Systematics, Inc. (2011) Draft Technical Report in Information Management, Cambridge Systematics, Inc, Cambridge, MA.
Bellinger, G. (2004) http://www.systems-thinking.org/index.htm
Cambridge Systematics, Inc. for Florida Department of Transportation (2012) Travel Time Data Collection White Paper, Cambridge Systematics, Inc, Cambridge, MA.