EMPLOYMENT AND TRAINING
PAPERS
35
Options for human resources
development in Egypt:
The labour market context
Analysis of the findings from the Egypt survey of human
resources development
Chris Evans-Klock
Lin Leam Lim
Employment and Labour Market Policies Branch
Employment and Training Department International Labour Office Geneva ISBN 92-2-111410-4
ISSN 1020-5322 First published 1998
Publications of the International Labour Office enjoy copyright under Protocol 2 of the Universal Copyright Convention. Nevertheless, short excerpts from them may be reproduced without authorization, on condition that the source is indicated. For rights or reproduction, or translation, application should be made to the ILO Publications Bureau (Rights and Permissions), International Labour Office, CH-1211 Geneva 22,
Switzerland. The International Labour Office welcomes such applications.
Libraries, institutions and other users registered in the United Kingdom with the Copyright Licensing Agency, 90 Tottenham Court road, London W1P 9HE (Fax:+44 171 436 3986), in the United States with the Copyright Clearance Center, 222 Rosewood Drive, Danvers, MA 01923 (Fax:+ 1 508 750 4470), or in other countries with associated Reproduction Rights Organizations, may make photocopies in accordance with the licences issued to them for this purpose.
The designations employed in ILO publications, which are in conformity with United Nations practice, and the presentation of material therein do not imply the expression of any opinion whatsoever on the part of the International Labour Office concerning the legal status of any country, area or territory or of its authorities, or concerning the delimitation of its frontiers.
The responsibility for opinions expressed in signed articles, studies and other contributions rests solely with their authors, and publication does not constitute an endorsement by the International Labour Office of the opinions expressed in them.
Reference to names of firms and commercial products and processes does not imply their endorsement by the International Labour Office, and any failure to mention a particular firm, commercial product or process is not a sign of disapproval.
ILO publications can be obtained through major booksellers or ILO local offices in many countries, or direct from ILO Publications, International Labour Office, CH-1211 Geneva 22, Switzerland. Catalogues or lists of new publications are available free of charge from the above address.
This report is based on findings from the 1996 Egypt Human Resources Development Survey, which was carried out to document changes in labour demand and in the occupational distribution of employment and to take stock of the training needs and practices of both large state-owned enterprises and very small informal sector shops. The survey provides a wealth of information on human resources development practices and employment trends at a critical juncture in Egypt’s transition to a more open economy. These economic changes portend fundamental shifts in what kinds of jobs will be created (and lost) and substantial challenges for enterprises and government authorities in adjusting to these changes.
The survey findings are indicative of broad trends in labour market developments at the enterprise level and suggest areas in which resources devoted to human resources development would be most effective, for example targeting work skill development towards the types of enterprises that indicate the greatest need, such as firms facing import and export competition, and those where job creation potential is highest, such as enterprises that are investing in new technologies; emphasizing entrepreneurship development for workers in the informal sector and in large firms facing privatization; and improving the labour-matching services that public employment agencies are able to offer employers and job-seekers. The report illustrates the utility, and necessity, of basing such human resource policy decisions on analysis of appropriate labour market data.
This paper was originally submitted as part of the Study on Options in Human Resources Development for the Government of the Arab Republic of Egypt. Research on the demand side of the labour market was part of broader advisory services on human resources development provided to the Government by the Employment and Training Department of the ILO. This work was coordinated by Anthony Twigger of the Training Policies and Systems Branch.
The survey instrument was developed by Lin Lean Lim and Virginie Pérotin as part of the work on Labour Market Information Systems carried out by the Employment and Labour Market Policies Branch of the ILO. The survey was conducted by the Central Agency for Public Mobilization and Statistics (CAPMAS), under the direction of Mr. El Heneidy, CAPMAS consultant. Support for carrying out the survey was provided by the United Nations Development Programme and the Egypt Social Fund for Development.
Thanks are extended to the enumerators at CAPMAS, to all of the establishment managers that gave of their time to participate in the survey, and to Mr. El Farouk of the Egypt Social Fund for Development for his support in carrying out this work. Thanks are also due to Virginie Pérotin for her valuable comments on the report draft and to Smita Barbattini for managing the data files and preparing the graphics. The final document was prepared by Anne Drougard.
Gek-Boo Ng Chief
Employment and Labour Market Policies Branch Employment and Training Department
1. Introduction . . . 1
1.1. Organization of the report . . . 2
1.2. The Egypt human resource development survey . . . 3
1.3. The major challenges for human resources development . . . 4
2. Characteristics of the surveyed establishments . . . 6
2.1 Region and industrial sectors . . . 6
2.2. Size and ownership characteristics . . . 8
3. Establishment responses to external challenges: performance and problems . . . 11
3.1. Business performance: Sales, technology and markets . . . 12
3.2. Business problems . . . 15
3.3. Personnel problems . . . 19
4. Establishment responses: Labour market adjustments . . . 22
4.1. Current employment structure of the workforce . . . 22
4.2. Employment dynamics . . . 25
4.3. Recruitment preferences and practices . . . 30
4.4. Gender discrimination in the labour market . . . 32
4.5. Skills and training requirements: Is there a mismatch between labour demand and labour supply? . . . 35
5. Establishment responses: Training practices . . . 39
5.1 Who trains their workforce? . . . 39
5.2 Reasons given for lack of training activities . . . 42
5.3 How establishments train their workers . . . 44
5.4 Which workers receive training . . . 45
5.5 Participation in public training programmes . . . 47
6. Establishment responses: Other human resources development practices . . . 50
6.1 Wages and benefits . . . 50
6.2 Responses to having surplus workers . . . 54
6.3 Establishment management and governance . . . 59
7. Survey highlights and policy implications . . . 62
Appendix tables . . . 68
List of tables in text Table 1. Change in sales over previous year, by establishment size and ownership type . . . 12
Table 2. Main business problem, by establishment size and ownership type . . . 16
Table 3. Personnel problems, by size and type of establishment . . . 20
Table 4. Vacancies, recruitment and exits as a percentage of total employment . . . 27
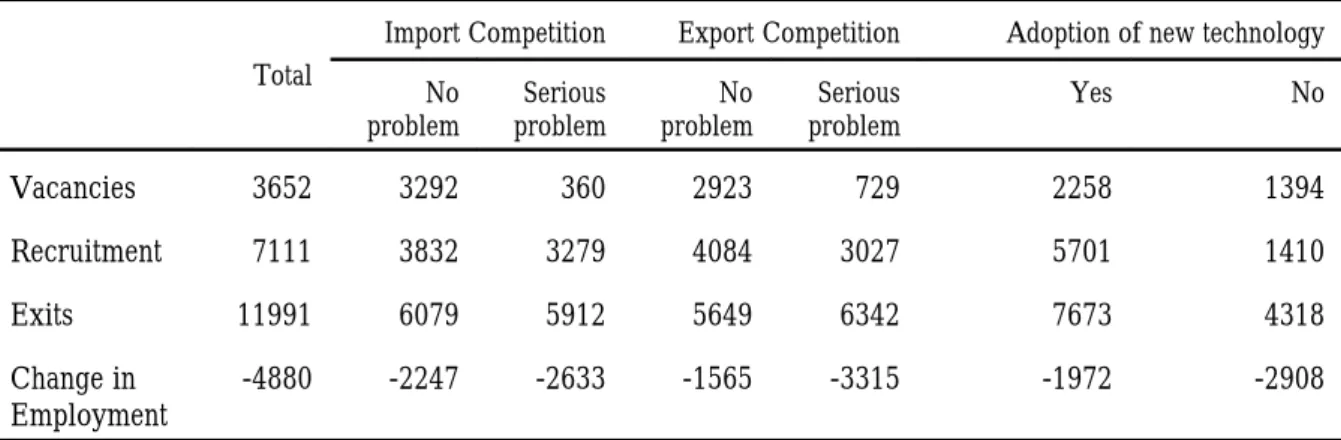
Table 5. Vacancies, recruitment and exits by import/export competitors andadoption of new technology . 28 Table 6. Gender preference in recruitment by import/export competitions and adoption of new technology 34 Table 7. Most difficult occupation to recruit workers for by import/export competition and adoption of new technology . . . 38
Table 8. Personnel problems and training activities . . . 44
Table 9. Training methods . . . 45
Table 10. Cooperation in DVTS . . . 48
Table 11. Benefit entitlements by size of establishment . . . 54
Table 12. Production capacity and redundant workers, by size of establishment . . . 56
List of figures in text
Figure 1. Establishments and employment by region . . . 7
Figure 2. Establishments and employment by industry . . . 7
Figure 3. Establishments and employment by size of establishment . . . 9
Figure 4. Establishments by legal form and size . . . 9
Figure 5. Establishments by industry and region . . . 10
Figure 6. Establishments and employment by state ownership . . . 11
Figure 7. Manufacturing technology by size of establishment . . . 13
Figure 8. Communications technology by size of establishment . . . 13
Figure 9. Types of new technology adopted . . . 14
Figure 10. Performance of export and import competitors . . . 15
Figure 11. Regulations managers would like to change . . . 17
Figure 12. Relative importance of factors to improve business performance . . . 18
Figure 13. Most important factor for improving business performance . . . 18
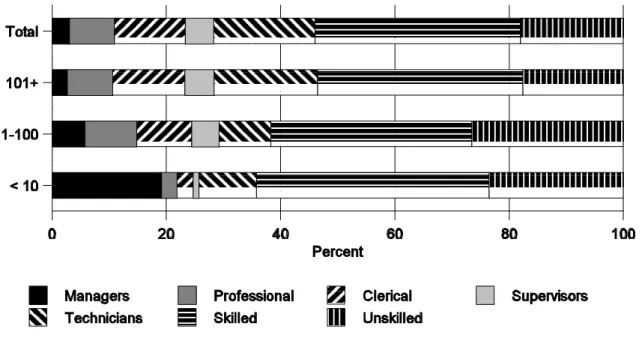
Figure 14. Establishments by size and occupational structure of workforce . . . 23
Figure 15. Establishments by import/export competition and adoption of new technology . . . 23
Figure 16. Establishments by size and employment status of the workforce . . . 24
Figure 17. Establishments by occupational share of vacancies and size . . . 25
Figure 18. Establishments by new hires and size . . . 26
Figure 19. Vacancies, recruitment and exits by type of ownership . . . 27
Figure 20. Total employment, exits, recruitments and vacancies by occupational structure . . . 29
Figure 21. Expected changes in employment over the next twelve months . . . 30
Figure 22. Recruitment preference by worker qualifications and establishment size . . . 31
Figure 23. Establishments by preference for type of training of workers . . . 32
Figure 24. Establishments by size and recruitment method . . . 32
Figure 25. Distribution of workforce by occupation and gender . . . 33
Figure 26. Distribution of workforce by employment status and gender . . . 33
Figure 27. Reasons for gender preference . . . 35
Figure 28. Establishments by educational qualifications of the workforce and type of ownership . . . 36
Figure 29. Establishments by occupational needs and type of training for occupations . . . 37
Figure 30. Establishments by occupation most difficult to recruit workers for and size of establishment . . . 37
Figure 31. Establishments by occupation most difficult to recruit workers for and location of establishment 38 Figure 32. Types of training provided, by size of establishment . . . 40
Figure 33. Types of training provided, by region . . . 40
Figure 34. Training activities by selected groups of establishments . . . 41
Figure 35. Explanations for not training recruits, by size of establishment . . . 42
Figure 36. Apprentices needed, by industry . . . 49
Figure 37. Wage rates by occupation and size of establishment . . . 51
Figure 38. Criteria to determine pay, by size of establishment . . . 52
Figure 39. Women’s pay relative to men’s in similar occupations . . . 53
Figure 40. Non-wage labour costs as per cent of total labour costs . . . 55
Figure 41. Redundant workers, by industry . . . 56
Figure 42. Management appointment by size and type of establishment . . . 60
The Labour Market Context
Analysis of Findings from the
Egypt Survey of Human Resources Development
1. Introduction
A broad perspective that links human resources development closely to labour market and other socio-economic developments has three main sets of related implications. Firstly, it implies that an analysis of the human resources development challenges and response measures should be based on a realistic assessment of the labour market situation. Such an assessment should not only shed light on the supply and demand sides of the labour market but should also identify the broader contextual factors that have affected and are likely to affect human resource mobilization, utilization and development. These contextual factors could include, for example, how enterprises are responding to economic reform or structural adjustment programmes, moves towards privatization, the opening up of markets to international competition, export-promotion drives, and so on. Secondly, emphasizing the importance of the “enabling environment” means that additional measures are needed to support an effective human resources development programme, such as the legal, institutional or taxation reforms which would encourage enterprises to provide training to workers, the labour market information requirements to better match the supply and demand for labour, human resources management to complement human resources development, measures to redeploy redundant workers especially those employed in state enterprises, etc. Thirdly, it means that to be effective, human resources development should focus not just on reform of the educational and vocational and skills training systems. It should include, for example, effective labour market policies and programmes, an efficient system of labour market information, measures to enhance entrepreneurship development and dynamic efficiency of those in small and medium size enterprises, and efforts to promote employee-friendly and family-friendly workplaces where the development and utilization of skills are likely to be more effective.
This report illustrates some of these linkages and issues for the case of Egypt. It is based mainly on the findings of a 1996 survey of 1,700 Egyptian establishments in the manufacturing and service sectors in three governorates. It focuses on how human resources development practices facilitate or hinder adjustment to the emerging challenges confronting Egyptian businesses. The survey findings highlight the role of enterprises – their demand for labour in terms of occupation mix and skills structure, the mismatch between labour demand and labour supply, etc., and how their labour market adjustments, training practices, etc. are enabling them to respond to external challenges. How successfully they respond to these challenges will determine their ability to create more good jobs for a growing population.
While the survey focuses on the enterprise level, it is important to stress the point from the outset that the implications for human resources development are much broader. In addition to training at the enterprise level and how employers view investment in improving the productivity of their workforce, there are important implications for the entire range of human resources development – for individuals investing in their own job skills; the need for better functioning labour market information systems that signal to individuals and public and private
training institutions what skills and occupations employers will need; the reform of education, training and retraining policies and programmes; and the role of public and private training institutions vis-a-vis the role of enterprise-based training.
1.1. Organization of the report
To define the scope and coverage of the information for this report and to set the overall context, the following two parts of this Introductory section describe the Egypt Human Resources Development Survey (EHRDS) and highlight the main challenges confronting enterprises in Egypt.
The main part of the report is based on data from the survey. Section 2 describes the characteristics of the surveyed establishments, distinguishing state-owned and privately-owned, large and small, rural- and urban-based establishments and summarizing their distribution by industrial sector. Sections 3 to 6 present the main findings, which are used to answer four basic questions:
C
How do business managers and owners perceive threats and opportunities to their future growth?C
How effective are their current labour market adjustments and training practices in enabling them to respond to external challenges?C
How extensive is their participation in existing training programmes, how do they evaluate their relevance and effectiveness, and what do they identify as priorities for public policy in the area of human resources development?C
Finally, what types of government support would be most effective to improve human resources development and thereby both encourage and enable establishments to provide more good jobs?The survey findings on human resource development practices and needs are analysed and contrasted for establishments in each of these principal groups: the informal sector (of small establishments), the state-owned sector, and rural establishments. Where interesting information is available, the report also discusses the experience of establishments which have recently adopted new technology or are attempting to compete with foreign firms in export/import markets. The current practices and future prospects of each group are analysed with the aim of ensuring that policy recommendations are appropriate to the particular needs of different types of enterprises.
Section 3 examines how establishments have fared in relation to recent economic trends and macroeconomic challenges. It documents the overall performance of establishments in each group, and highlights the challenges and problems managers and owners ranked as having the greatest impact on their performance and prospects. Section 4 describes establishment responses in terms of their labour market practices. It analyses labour demand in terms of the employment structure of the establishments, their hiring and firing practices, recruitment preferences, etc. It also assesses how well the labour market has been functioning in terms of matching job seekers and prospective employers. Section 5 examines establishment responses in terms of functional flexibility through human resources development, specifically in terms of training practices and the types of employees who are most likely to receive training. The section also examines the extent to which establishments participate in public training programmes, and their satisfaction with these programmes. In addition to training, establishments in Egypt also engage in other broader aspects of human resource development and management. Section 6 therefore looks at remuneration, terms of employment and
1 The design of the survey questionnaire was in a sense constrained because the original aim was to
ensure some comparability with other surveys. One survey was based on a questionnaire prepared by GTZ (Deutsche Gesellschaft für Technische Zusammenarbeit) which was interested in examining the implications of a cooperative (dual) vocational education and training system in Egypt which is partly supported by German technical assistance. It was also thought useful to have some comparability with enterprise labour flexibility surveys that the Employment and Training Department has conducted in a number of other countries.
2 The survey instrument was then modified slightly to clarify some questions and to resolve possible
ambiguities based on discussions with enumerators about their experience administering the questionnaire. working conditions, social benefits, etc. Section 7 summarizes the main findings in relation to the challenges and options for human resources development in Egypt.
1.2. The Egypt human resource development survey
The questionnaire for the Egypt Human Resource Development Survey (EHRDS) was developed by specialists in the Employment and Training Department (EMPFORM) of the International Labour Office, Geneva.1 A pilot test of the survey instrument was carried out in
the Alexandria Governorate for twenty public and private sector establishments.2 The survey
was conducted by the Central Agency for Public Mobilization and Statistics (CAPMAS) in the summer 1996. Interviewers were trained by officials from CAPMAS and EMPFORM. Coding and data entry were done by CAPMAS, which supplied EMPFORM with the data files for analysis. The survey itself was part of a study on human resources development funded by the United Nations Development Programme (UNDP) at the request of the national government, with additional funding provided by the Egypt Social Fund for Development.
The most recent census available for identifying establishments had been carried out in 1986. However, a later survey of manufacturers in 1992 showed significant changes within the private sector. It was therefore felt that the census would not provide an accurate listing of businesses from which to draw a random sample. Rather than stratifying on the basis of an obsolete sampling frame, it was decided to do area (random) samples for the private sector. The pilot survey was based on sampling areas within three selected governorates: Alexandria, Dakhalia and Assuit. About half of the administrative units or shiackhas, in each of the three governorates were included in the sample frame. All public and formal-sector, privately-owned establishments in the selected shiackhas were identified according to CAPMAS records and included in the survey. In addition, all informal sector establishments (those with ten or fewer employees) found in a sample of 200 buildings in each shiackha was also surveyed.
A particular advantage of this sampling framework was that the survey captured a sufficient number of establishments across industries, ranging from the smallest to largest firms, both private and government-owned, to permit adequate comparisons to be drawn. In order to document establishments’ training practices and needs, it was deemed important to include firms which were likely to provide worker training, as well as those which were not likely to provide training (such as establishments with few workers, single proprietorships, small trade activities). The survey thus served three purposes:
C
First, it allowed researchers to identify where training does not take place, and to analyse whether its absence constrains establishment productivity and growth.C
Second, it provided sufficient detail of information on firms which do provide training to permit analysis of the effectiveness of existing private and public training programmes.C
Third, it collected data on the specific types of skills sought by particular types of establishments.While the survey sample was representative for the three governorates covered, the survey results should not be considered representative of the national economy on the basis of industry sectors. Rather, analysis of the survey data provides indicators of human resources practices and needs across a wide variety of establishments and across formal and informal sectors, size and ownership characteristics. The survey results are presented and contrasted for major groupings of respondent establishments within the sample, without attempting to extrapolate survey responses to the entire population of Egyptian establishments.
All the data analysed in this report originate in the Egypt Human Resources Development Survey (EHRDS). The reference date for most of the data was January 1996, although some questions were answered on the basis of the situation at the time the survey was administered, August 1996.
1.3. The major challenges for human resources development
To set the context for the rest of the report, this sub-section highlights the main human resources development challenges and the related policy considerations in Egypt. Although the report based on the survey results obviously cannot shed light on or provide answers to all these challenges, it is worth drawing attention to them.
C
The Employment Challenge: What will be the main sources of productive employment in the future?Human resources development in Egypt has to be seen in a context where population and labour force growth are still rapid, there is growing unemployment and persistent under-employment and the potential for international labour emigration is expected to be more limited in the future. It is clearly important to have a handle on the demand for labour – the number and types of jobs, etc. in the Egyptian economy in the coming years. To date, the Egyptian economy has been dominated by the service sector which, including public administration, accounts for almost half of the GDP. In the future, however, the public sector cannot be expected to be the main job creator. Currently also, the informal sector (firms with fewer than ten workers) is estimated to account for as much as half of total employment activity, so a focus only on vocational and skills training for the formal sector will not be appropriate or adequate in the Egyptian context.
C
The Challenge of Entrepreneurship Development and the Informal Sector:A very high proportion of establishments are in the informal sector and small enterprises tend to dominate the economy. Almost 70 per cent of the establishments covered in the EHRDS are in the “informal” sector. These are very small businesses, most often owned and managed by individuals or families, typically but not exclusively engaged in providing consumer services, and which currently account for a relatively small share of total jobs. The capacity of this sector of the economy to contribute to employment, productivity and growth is obviously critical. Especially as large state-owned enterprises are restructured, the importance of small and medium size enterprises would grow, and the challenge is to support their development. It is important to determine, for instance, how the needs and problems of small enterprises in the informal sector, especially in relation to human resources development, differ from those of large state enterprises. It is important also to identify the main constraints establishments in the informal and small and medium size sectors face and to see how the government can assist them to overcome these constraints.
C
The Challenge of Economic Reforms, Exposure to International Competition and the Adoption of New Technologies:Export or import competition is currently not an overwhelming problem for establishments in Egypt; it was identified as a serious problem by less than ten per cent of the survey respondents. But it can be expected that as the economy moves towards trade liberalization and export promotion and becomes more open to foreign investments, Egyptian establishments will be under increasing pressure to be efficient and competitive. Firms attempting to enter foreign markets or firms finding their home market share increasingly threatened by foreign competition need to improve product quality and workplace productivity. Meeting this challenge rests in part on their ability to retrain existing workers and to hire new labour market entrants with the required skills.
The better enterprises are able to adopt new technologies and to ensure that their workforce have the necessary skills to operate the new technologies, the more economically efficient they would be. The survey found that one out of five establishments had adopted new technologies in order to improve their productivity or competitive position. These establishments may have the most obvious training needs. Their success or failure in upgrading skills of their employees or hiring new ones with the desired qualifications reveals strengths and weaknesses in the human resources development institutions and labour markets.
The success of businesses would also hinge on their ability to exploit international comparative advantage through export market identification and participation. Those producing for the domestic market also need to be able to better compete against imports. And the way in which enterprises adjust their internal and external labour markets would have major implications for employment and human resources development. The challenge to workers is that they need to be more productive and flexible, and this is clearly where skills training and upgrading assume greater significance.
C
The Challenge of Privatization:As part of the economic reforms in the country, there is an ongoing process of privatization. Approximately 10 per cent of the establishments covered in the survey were totally or partially state-owned but they accounted for some 80 per cent of total employment. The challenge is to determine how the shift from public to private ownership can be efficiently achieved, and also to identify and deal with the implications of privatization for workers. Other critical questions concern the effective mechanisms for privatization: Should there be an outright sale to the private sector, should shares be given to employees, should foreign partners be brought in, etc.? It is also important to have information on how state enterprises can be assisted to improve their productivity and cost-efficiency so that they can effectively compete in increasingly aggressive environments.
The survey revealed differences in human resources practices between state-owned and privately-owned establishments; and the analysis suggests how privatization may affect aggregate demand for labour and also the skill and occupation mix of the workforce. Understanding these differences will be helpful in devising policies to manage the human resources dimension of the privatization process. The implications of privatization are directly related to the problem of surplus workers. How can human resources development help in the redeployment of surplus workers from privatized enterprises, and what are the social safety net arrangements for retrenched workers?
C
The Challenge of Rural Establishments:The disparities between rural and urban areas represent a major challenge in the process of development and modernization. In the survey, about 10 per cent of the establishments were
located in the rural governorate of Assuit. Rural establishments may be particularly vulnerable to being excluded from modernization processes. Their viability as an important source of employment may also be threatened if they are unable to respond to external forces of change. Human resources development policies are part of the broader efforts to improve employment prospects and living standards outside the urban areas and to mitigate disparities in opportunities between urban and rural areas.
C
The Labour Market Information Challenge:For an economy in transition, there are clearly growing needs for labour market information that can help ensure better matching of supply and demand, and also smoother adjustments in the labour market. To improve labour market information, employment services could play an important role. But their role depends on how they are viewed by establishments – whether they are considered as providing useful services, whether establishments feel the need to report vacancies to them, etc. It would also be useful to see how training institutions determine training needs, do they involve the “end users” in identifying the needs and developing the training packages, and what can be done to encourage greater cooperation between training institutions and employers? Especially in the Egyptian context of small establishments which may rely more heavily on public training institutions for skilled workers, this linkage is important.
C
The Challenge posed by Vulnerable Groups:An important aim of human resources development should be to improve the position of vulnerable groups in the labour market. The special needs of vulnerable groups should be taken into account in designing human resources development policies and practices, so as to ensure that they are not further marginalized in the process of enterprise adjustment to competitive forces. It is important, for instance, to examine the position of women and men in the labour market and understand whether labour market trends imply more or fewer jobs for women, the extent of occupation segregation that exists, and the measures that can be taken to promote equality of opportunity and treatment. Human resources development should give attention not only to women but also to other disadvantaged or vulnerable groups, such as child labour or older workers.
2. Characteristics of the surveyed establishments
This section describes these 1,700 establishments covered in the survey in terms of their location, type of economic activity, size of work force, and type of ownership. These are the principal characteristics for which findings will be compared throughout the report.
2.1 Region and industrial sectors
Just over half of the establishments were located in Alexandria, but they accounted for 90 per cent of the 282,259 employees covered by the survey (Figure 1). A third of the establishments surveyed were in Dakahlia, and the final 11 per cent were in the rural governorate of Assuit.
Figure 1. Establishments and employment by region
The survey respondents were distributed almost evenly between manufacturing (47 per cent) and non-manufacturing (53 per cent). However, manufacturing accounted for twice the number of jobs as services, 65 per cent versus 35 per cent in services. For ease of contrast, branches of economic activity have been grouped into five manufacturing and four non-manufacturing sectors (Figure 2).
Figure 2. Establishments and employment by industry
The largest single sectors, in terms of employment, were clothing/textiles (22 per cent), construction (16 per cent), and food products (15 per cent). Because they accounted for relatively few of the establishments individually, the chemical, pharmaceutical, and building materials branches were combined together (along with other smaller industrial branches) and accounted for about 22 per cent of total employment. Machinery was also a broad category, encompassing metal works, engineering, automotive and electrical engineering and electronics,
3
Establishments were not asked in the survey whether they had registered with tax and social security agencies in order to reduce the risk that informal establishments would decline to participate.
but adding up to only 3 per cent of employment in 7 per cent of the establishments. (See Appendix Table 1 for more detailed employment data by industry.)
The single largest sector in terms of number of establishments was "maintenance", which was relabelled "repair shops" to more accurately reflect its small, independent nature. The repair and consumer services sectors together accounted for nearly half of all the surveyed establishments (21 per cent and 27 per cent, respectively) but even combined, their share of total employment was less than 10 per cent. By contrast, the other two principal service sectors, construction and trade/transport had relatively few, but large, firms; together they accounted for just 5 per cent of the establishments surveyed but 25 per cent of employment.
2.2. Size and ownership characteristics
Typically the informal sector is defined along three criteria: size, employing ten or fewer workers; property form, independent, single or family proprietorship not owned by larger enterprises; and legal status, not necessarily registered with the principal tax or social security agencies. In the EHRD Survey, information was collected on the first two of these criteria.3
On the basis of size alone, more than two-thirds of the establishments surveyed would be classified as informal. Some 1,200 establishments, or 71 per cent, employed ten or fewer persons (Figure 3). These smallest establishments employed on average only 4 workers. The non-agricultural sector of the Egyptian economy has been characterized elsewhere as many tiny establishments employing few people, and a few large enterprises employing most of the people, with relatively few medium-sized businesses. This characterization is corroborated in the survey sample, with only 20 per cent of establishments and less than five per cent of workers in the middle-size category, broadly defined from 11 to 100 employees.
The small establishments were either single proprietorships (68 per cent) or partnerships (29 per cent). Similarly, nearly all of the single proprietorships were small: 88 per cent employed ten or fewer workers and the rest employed fewer than 50 (Figure 4). Thus on the basis of size and ownership, over two-thirds of the surveyed establishments could be considered in the informal sector. Because of the overlap of establishments by these two criteria, analysis of "informal sector" businesses will refer to establishments with ten or fewer workers.
Figure 3. Establishments and employment by size of establishment
Figure 4. Establishments by legal form and size
The majority of establishments located in the most rural Governorate, Assuit, would be included in the category of informal establishments. This region had a small share of the surveyed establishments in construction (5 per cent) and machinery (4 per cent), which tended to have large establishments, and the highest proportion of the three regions in consumer services (33 per cent) repair shops (22 per cent), and clothing/textiles (15 per cent) which were typically small establishments (Figure 5). In fact, 85 per cent of the establishments located in Assuit in the EHRDS had at most 10 employees. By contrast, small establishments comprised 69 per cent of the sampled establishments in Alexandria and Dakahlia Governorates.
Figure 5. Distribution of establishments by industry and region
One tenth of the establishments were in the largest size class (over 100 employees), with an average size of nearly 600. Most of the large establishments remained state-owned, either fully (62 per cent) or partially (11 per cent). Average size in the construction industry was over 1000 employees; establishments in trade/transport and chemicals also tended to be large, with over 600 employees on average (see Appendix Table 1).
Although only 10 per cent of the EHRDS establishments were totally or partially owned by the State, these 174 establishments provided 80 per cent of the jobs documented in the survey (Figure 6). One half of the surveyed construction and trade establishments were state-owned, as were almost one fifth of the establishments in the food and chemical industries (Appendix Table 1). The survey indicated a slow pace of privatization: Only ten establishments supplied sufficient information to be able to determine that they planned to be privatized within the next several years. These also tended to be large (only one with fewer than 100 employees; 7 with more than 1,000 workers).
4
Due to the correspondence between size and ownership (most large establishments were state-owned and most state-owned enterprises were large) most of the survey findings are not reported separately for each group. Only where their survey responses differed notably, are results provided for both sets of respondents.
Figure 6. Establishments and employment by state ownership
Thus it should be noted from the outset, and the reader should be reminded throughout this report, that consideration of HRD practices and needs in the informal sector is deemed noteworthy because most employers were in fact very small. However, most workers were employed in large and state-owned establishments. The workplace practices and expectations of these relatively few employers are emphasized because, first, they affect the majority of workers and, second, HRD policy targeting these firms will have to be part and parcel of broader policies regarding state-sector management or privatization.4
3. Establishment responses to external challenges:
performance and problems
Human resource practices and needs must be analysed within the framework of the challenges and overall problems confronting establishments. Their adjustment strategies influence their aggregate and occupational demand for labour, and the success of these strategies relies in part on the productive management of human resources. In this section, several dimensions of economic performance will be compared for the principal groups identified above. Establishments which had introduced new technologies and those which identified themselves as being most concerned about international competition are also singled out. The business and personnel problems identified by surveyed establishments as most critical to their future performance are also analysed.
3.1. Business performance: Sales, technology and markets
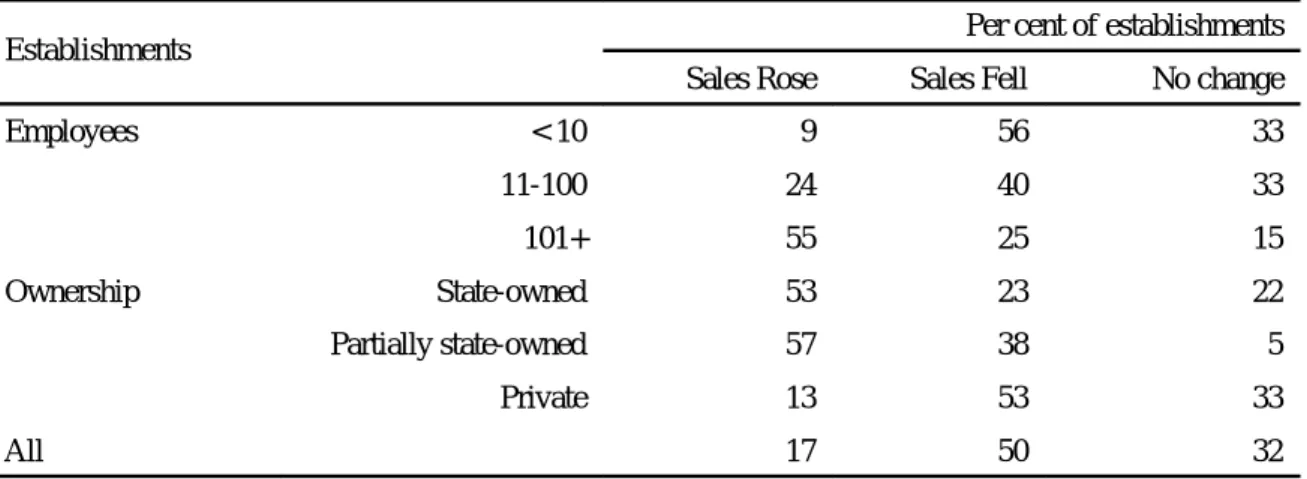
Measured by the crude indicator of whether sales had risen or fallen over the previous year, most establishments would not claim to be enjoying prosperous times. Exactly half of the establishments reported that their sales had fallen. One third said they had stayed the same and just under one fifth (17 per cent) reported a rise in sales. Smaller and non state-owned establishments were more likely to register poor sales performance than were larger or state-owned establishments.
Table 1. Change in sales over previous year, by establishment size and ownership type
Establishments Per cent of establishments
Sales Rose Sales Fell No change
Employees < 10 9 56 33 11-100 24 40 33 101+ 55 25 15 Ownership State-owned 53 23 22 Partially state-owned 57 38 5 Private 13 53 33 All 17 50 32
A second way to consider performance is the adoption rate of modern technology. Performance in terms of product quality is one aspect of competitiveness, which may require investment in new process equipment, computerization, or plant modernization. Of the large manufacturers in the survey, almost half had automated processing technology and a third had computer-based communication systems (Figures 7 and 8). These technologies were virtually unknown among the smallest establishments, and only one out of ten medium-sized establishments utilized computers.
Twenty per cent of the surveyed establishments had introduced new technology over the previous two years. Their employment and training practices are tracked throughout this report in order to draw lessons about training needs from their experience. These 309 establishments tended to be large and located in the urban area, and were fairly evenly distributed across manufacturing sectors (See Appendix Table 2). Only eight per cent of the establishments in the informal sector had adopted new technology, as opposed to two thirds of the establishments with more than 100 employees. Almost 60 per cent of the establishments with new technology were located in Alexandria and only 10 per cent were in the rural governorate of Assuit. Two thirds of the establishments with new technology were in manufacturing sectors, implying that the remaining third, in services, trade, and construction, had adopted new communication or design technologies, as opposed to processing technologies.
Figure 7. Manufacturing technology by size of establishment
Figure 8. Communications technology by size of establishment
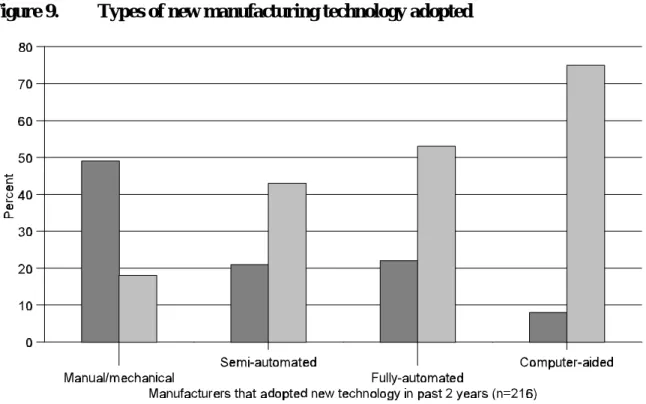
The principal reason these establishment gave for adapting new technology was to improve product quality (45 per cent); the second most frequent explanation was to increase quantity of output (25 per cent). Half of the establishments that adopted new manufacturing technology described it as manual or mechanical (Figure 9). Most of the rest had invested in automation and eight per cent had invested in computer-aided equipment. As also shown in Figure 9, fully 75 per cent of all the establishments surveyed that operate computer-aided equipment had acquired it over the previous two years, as had 50 per cent of all establishments with fully-automated equipment. Thus the findings indicate that while the pace of adopting high technology was increasing, most of the investment remained in manual and mechanical technologies.
5 Four out of five establishments described their market area as local and almost all of the rest described
it as national.
6 Of the 159 import competitors, 57 per cent were also export competitors. Of the 146 export
competitors, 62 per cent were also import competitors.
Figure 9. Types of new manufacturing technology adopted
A third way to consider performance is competitiveness, particularly how establishments perceived their efforts to deal with foreign competition at home or abroad. The survey is not representative of Egyptian exporters: only ten establishments reported that their principal market was foreign (about one half of one per cent of the total survey).5 But a significant number of
other establishments identified difficulties entering export markets and competing against imports in their home market as "serious" or "very serious" problems (elaborated in Section 3.2 below). These two groups of establishments, referred to as export competitors or import competitors, are also tracked throughout the report because their problems and human resources difficulties may be faced by growing numbers of establishments as trade barriers are lowered and Egyptian businesses increasingly seek growth opportunities abroad.
Overall, about one tenth of the establishments surveyed were export competitors (146 establishments), or import competitors (159 establishments).6 However, about one third of the large establishments and of the state-owned establishments were export competitors or import competitors (See Appendix Table 3). Although a much smaller portion of the informal sector establishments identified foreign competition as a serious problem (5 per cent), these small establishments accounted for a third or more of the total group of export or import competitors. It is evident, however, that most of the small establishments with this concern were located in Alexandria: only one per cent of the export competitors and seven per cent of the import competitors were in Assuit. The clothing and textile industry was the industry most concerned about foreign competition: one out of four establishments surveyed in this sector indicated concern about losing markets to imports and about one out of six was concerned about exporting.
The struggle to cope with increasing foreign competition was evident in the efforts of enterprises to improve the quality of their products. The proportion of the export and import competitors that had invested in new technology was two to three times higher than the proportion among other establishments (Figure 10). The survey findings also suggest that establishments’ efforts to meet the international challenge may be paying off: one third of the export and import competitors reported an increase in sales, twice the proportion reported by other establishments.
Figure 10. Performance of export and import competitors
Establishments with new technologies and export and import competitors are singled out because they can be identified as having directly encountered and responded to the fundamental challenges confronting Egyptian businesses – trade liberalization, privatization of some state-owned sectors, and improving product quality. Although these three challenges are intertwined (for example, investing in new technology can be a means to attain international quality standards and compete in export markets), the human resource development practices and needs of these groups of enterprises are highlighted throughout the report because their experiences may be particularly relevant for policy formation.
3.2. Business problems
The set of business problems identified as most serious varied substantially by type of establishment (Table 2). Taxes were the overwhelming complaint by small and by privately-owned establishments (selected by about two-thirds of each group). By contrast, taxes were selected as the most serious problem by only 9 per cent of large establishments, and ranked lower than foreign competition (15 per cent), lack of markets (15 per cent) and local competition (11 per cent). Customer debt and machinery breakdown were the most common “other” problems among large firms (selected as most serious by 9 per cent and 5 per cent respectively). The distribution of problems cited by state-owned establishments (not shown) was almost identical to that of large firms in general, with the exception that taxes were
selected by a smaller proportion of state-owned establishments (4 per cent, compared to 9 per cent of all large establishments).
Table 2. Main business problem (per cent of establishments)
Main Problem All
Size Special Groups
1-10 101 + Export
Competitor s
Import
Competitors Adopted newtechnology
Taxes 57 67 9 30 31 38
Government regulations 11 11 9 11 10 9
Local competition 7 6 11 11 13 8
Foreign competition 2 1 15 16 19 7
Lack of markets 4 2 15 8 7 9
Lack of skilled workers 7 7 7 8 4 8
Capital 2 1 7 5 6 4
Material inputs 3 2 7 6 4 5
Other 6 4 21 6 6 12
Total* 99% 101% 101% 101% 100% 100%
* In this and subsequent tables, totals may not equal 100% due to rounding.
By contrast, finding sufficient numbers of skilled workers was of nearly uniform difficulty across groups of establishments. Overall, seven per cent of respondents said this was their most serious problem, reported by equal proportions of small and large establishments. Interestingly, the incidence of skilled labour shortage was marginally higher in the state-owned establishments (10 per cent), the sector commonly believed to be able to attract preferred workers most easily.
Firms which had adopted new technology did not have an above-average tendency to select skilled labour shortages as their principal business problem. Following concern about taxes, lack of skilled workers ranked in the second tier of most-cited problems, along with competition, lack of markets and government regulations.
Import competitors were less likely to rate skilled labour as their most serious problem (4 per cent). One out of five of these establishments identified foreign competition as their number one problem, and the proportion was only slightly lower for export competitors. For both groups, taxes were the principal concern.
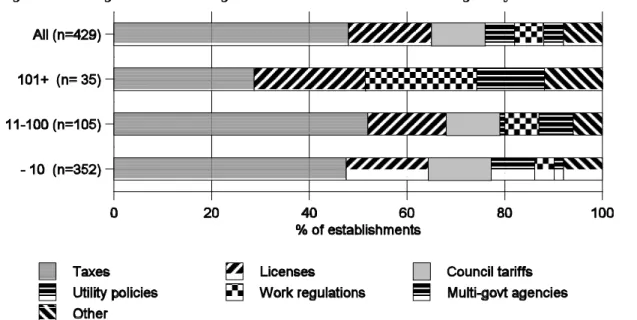
On average, one out of ten respondents identified government regulations as their main business problem. Almost 500 establishments went on to specify which regulations they would most like to see changed. The most marked finding is how different the responses were between large and small establishments (Figure 11). Taxation was the government “regulation” most firms wanted to change, but the proportion grew from 30 per cent of large establishments to 48 per cent of small ones. Business licenses ranked second, across all size classes. Two regulations that received almost ten per cent of the votes of the smallest establishments received no votes at all from large ones: local council tariffs and utility
policies. Most striking of all, however, is the different response to work regulations. Naturally these were considered more burdensome by establishments with large workforces, and were selected by almost one out of four large establishments as the regulation they would most like to see changed. (The survey did not go into details about specific work or employment regulations).
In a separate, but related question, survey respondents ranked various factors to improve business performance along a continuum from “not important” to “very important”. The relative importance of the five highest ranked factors is compared in Figure 12. Improving product quality was the overwhelming first choice, ranked most important by two-thirds of the respondents (combining responses of “important” and “ very important”). Hiring qualified workers and training for workers were the second and third most important factors. Over half of the respondents considered these factors most important (59 per cent for hiring qualified personnel, 53 per cent for training workers), ranking them as marginally more important than new technologies or new products (50 per cent and 45 per cent, respectively) and much more important than changing terms of employment: Introducing incentive-based pay systems was considered important to improving business performance by about one third of the respondents and extending working hours was deemed important by one fifth.
Figure 12. Relative importance of factors to improve business performance
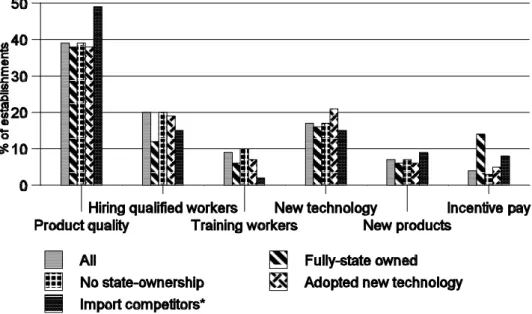
When limited to selecting the single most important factor, hiring qualified personnel received the second or third most votes across a wide variety of business types (Figure 13). Product quality was universally regarded as the one factor most likely to improve business prospects, selected by two out of every five respondents. On average, the ability to hire qualified workers was the second most important single factor to improve business performance. One out of five privately-owned establishments selected hiring qualified workers as the most important factor. The same proportion of responses was recorded for the informal-sector establishments, which, as documented earlier, were nearly the same sub-set of establishments as the privately-owned ones.
Figure 13. Most important factor for improving business performance
Overall, only 4 per cent of establishments selected incentive pay systems as the most crucial factor, but among the state-owned establishments this factor was considered the third most important (14 per cent), just behind new technology (16 per cent) and just ahead of skilled workers (12 per cent). This was probably indicative of an underlying problem in state-owned establishments that anticipated needing to change terms of employment away from long-term security to more performance-based wage and tenure systems.
Even among the 300 establishments that adopted new technology, the ability to hire qualified workers received only marginally fewer votes (19 per cent) than technology (21 per cent) as the most important factor. Nearly half of these establishments selected product quality as the single most important factor (compared to 39 per cent on average). Concern with product quality was highest among import and export competitors; about half of these establishments considered this the most important factor.
Worker training, however, typically was not selected as the most important factor, receiving on average just half as many votes as hiring qualified personnel. Among export and import competitors the margin of difference was most startling: 15 per cent selected hiring qualified personnel as the most important factor but only 2 per cent of import competitors and 4 per cent of export competitors selected worker training as most important. Among both state-owned and privately-state-owned establishments, worker training received half as many votes as hiring skilled workers. Had these two proffered factors been considered nearly identical, or interchangeable, by respondents, one would expect a small difference in the proportion of respondents selecting one or the other. Therefore, the evidence that hiring qualified workers was considered a more important factor than training workers may indicate that managers preferred to compete in the market for workers with desired skills rather than train current workers or newly hired ones. It may also indicate that general skills were in demand, versus industry or establishment-specific skills, which managers may have been reluctant to provide due to high turnover. Evidence on these questions will be examined in a later section of this report.
It is also important to note that while improving product quality was consistently regarded as the most important factor to improve business performance, the other factors can be considered as means to that end. Better trained personnel, more modern technology, replacing obsolescent products with new ones are all strategies, or parts of a holistic strategy, to improve the quality of the product or service offered on the market. Thus, rather than regard the ability to hire qualified workers as only the second or third-most important factor, the survey findings indicate that difficulties hiring skilled workers was a crucial element of most establishments’ responses to external challenges.
3.3. Personnel problems
The ability to hire workers qualified for openings was generally rated among the most important business problems and requirements for business success. Before turning to the findings on how businesses deal with this problem, it is helpful to put training problems in perspective, relative to a broad range of personnel problems that businesses must manage.
Across all categories of establishments, scarcity of skilled workers, or difficulties in recruiting or retaining them, topped the lists of personnel problems (Table 3). Overall, 43 per cent of managers interviewed cited lack of skilled workers as their number one personnel problem, 17 per cent complained of difficulties in retaining skilled workers and another 9 per cent cited difficulty retaining skilled workers. Summing across these three responses, we find that seven out of ten establishments reported finding, recruiting or retaining skilled workers as their main personnel problem. After skill levels, high turnover was selected as the next most serious personnel problem (by 14 per cent of establishments). Surplus workers, poorly motivated
workers and high absenteeism together were selected as most important by ten per cent of the respondents.
Almost as striking as the intensity of the response on the subject of trained personnel is the constancy with which this priority was registered across types of establishments. Skilled labour shortage was the most frequently selected personnel problem by large establishments (23 per cent), although the combined skilled labour responses (recruitment and retention) accounted for a significantly lower share of responses among large establishments (52 per cent) than among small establishments (73 per cent). The difference is largely explained by the problem of surplus labour, which was cited as the most serious personnel problem by 17 per cent of the large establishments and literally none of the smallest ones.
Table 3. Personnel problems, by size of establishment (per cent of responses)
Personnel problem All
Size Special Groups
1-10 101 + Export Competitors Import Competitors Adopted new technology
Too many employees 3 1 17 10 8 8
Lack of motivation 3 2 7 4 5 7
High absenteeism 5 4 6 2 2 6
High turnover 14 12 12 15 14 14
Lack of skilled workers 43 48 23 33 40 36
Difficulty recruiting skilled workers
17 17 16 22 22 16
Skilled workers leave 9 9 13 12 8 8
Other 7 8 7 1 1 6
Total 100% 100% 100% 99% 100% 101%
There were no significant differences in the responses by rural and urban establishments. The three problems dealing with skilled labour were identified as most important by 65 per cent of the establishments in Assuit versus 70 per cent of those in Alexandria. Seventy per cent of privately-owned establishments cited one of the skilled labour problems as being their most serious personnel problem, versus 56 per cent of fully state-owned establishments. Similar to large establishments in general, 17 per cent of state-owned establishments selected surplus workers as their most serious personnel problem.
A large portion of the establishments which had adopted new technology were concerned about the lack of skilled workers (36 per cent). Far more establishments with new technology were worried about finding or retaining sufficient numbers of qualified workers than believed that new technology would affect the quantity of labour they would need: only 15 per cent of establishments that had adopted new technology reported a decline in the level of employment, while 54 per cent reported an increased demand for technical expertise or qualifications (See Section 4). A large share of these establishments reported no change in either labour demand or skill requirements (61 per cent and 41 per cent, respectively).
Lack of skilled workers was also the single most important employment problem for both
export competitors (33 per cent) and import competitors (40 per cent). Difficulties in recruiting or retaining skilled workers were of the highest concern to another 33 per cent of export competitors and 30 per cent of the import competitors.
The depth of concern documented by the survey for the quantity of skilled workers available, and establishments' ability to attract and retain preferred workers, leads to questions about how well the labour market functions in matching employers and job-seekers with desired skill levels and about their own practices to develop skills among their employees – issues addressed in subsequent sections.
4. Establishment responses: Labour market adjustments
Establishments respond to external challenges through changes in both their external and internal labour markets. They can adjust their demand for labour in terms of the number and types of workers they hire or fire, their recruitment preferences and the types of employment contracts they offer (“external numerical flexibility”); and they can also adjust the quantity and timing of labour inputs through changes in part-time, overtime and shift work arrangements or greater flexibility for leave arrangements without altering the number of employees (“internal numerical flexibility”). They can also respond in terms of work reorganization and human resources development and management in their internal labour market (“functional flexibility”). This section examines the labour market adjustments, while Sections 5 and 6 deal with human resources development and management.
4.1. Current employment structure of the workforce
A total workforce of 282,259 persons was employed as of 1 January 1996 by the 1,700 establishments covered in the survey. The skill structure of the workforce was relatively high, only about 18 per cent were unskilled workers. These skills were, however, mainly aquired through on-the-job training; the formal educational structure of the workforce was, in fact, lower; as discussed in sub-section 4.4 below. Privately-owned establishments tended to have a slightly higher proportion of skilled workers and at the same time also a slightly higher proportion of unskilled workers (and consequently a smaller share of administrative personnel) than the state-owned establishments. The skill differentials were more striking by size of establishments (Figure 14). The small establishments had almost a fifth of their workforce listed as managers (because of the single proprietorship or partnership nature of these small establishments) and less than 3 per cent in professional occupations. Although more than half their workforce were listed as technicians or skilled workers, the small establishments still reported the scarcity of skilled workers as their principal personnel problem (as was discussed earlier). The large establishments had the smallest proportion of unskilled workers, but a much larger proportion (13 per cent) of their workforce was in clerical jobs compared to small firms (less than 3 per cent).
Figure 14. Establishments by size and occupational structure of workforce
Figure 15 shows that the import competitors and export competitors were more likely to have higher proportions of their workforce who were skilled workers and technicians (and conversely lower proportions of unskilled workers) than those not exposed to external competition. However, surprisingly, those firms that had adopted new technology in fact had a smaller proportion of skilled workers in their labour force than those that had not modernized.
Figure 15. Establishments by import/export competion and adoption of new technology and occupational structure of workforce
There appears to have been little flexibilization of the labour market insofar as more than 85 per cent of the total labour force were regular full-time workers. Since the private establishments hired almost 90 per cent of their workforce on a regular full-time basis, other more flexible statuses were relatively unimportant. State-owned establishments made some use of temporary and contract workers; in fact, about 94 per cent of all temporary and contract workers covered in the survey were employed by fully or partly state-owned enterprises. Related to type of ownership, the larger establishments were more likely to employ temporary and contract workers, while the small establishments tended to employ workers on a regular basis and to make more use of family workers (Figure 16). One implication of the finding could be that the larger, state-owned establishments hired temporary or contract workers to fill a specific labour demand or because their demand for labour tended to fluctuate more. For instance, among the firms hiring temporary workers only 35 per cent were looking for unskilled workers; the remainder required various types of skills and professions. Less than a quarter of the establishments hiring temporary workers cited cost reasons; the most important reasons were related to shortages of particular skills. Similarly, over two-thirds of the firms hiring contract workers did so to fill particular skills or because they felt such workers were more productive relative to costs.
Figure 16. Establishments by size and employment status of workforce
The survey found, however, that both import competitors and export competitors were about ten times less likely to make use of temporary workers and half as likely to make use of contract workers than those that did not consider external competition to be a problem. It would appear that exposure to external competition did not involve fluctuating demand for labour. On the other hand, firms that had adopted new technology were about four times more likely to make use of temporary workers than firms that had not modernized. Although, as discussed earlier, much of the new technology was in terms of automation, there was still a need for temporary workers.
4.2. Employment dynamics
The demand for labour can also be examined in terms of vacancies that the establishments were attempting to fill. The total number of vacancies reported by the 1,700 surveyed establishments represented only 1.3 per cent of total employment (3,652 out of 282,259), indicating a very low rate of employment creation. The dependence on employment creation by the state-owned establishments was obvious from the fact that they accounted for 84 per cent of total vacancies. Small firms accounted for less than 3 per cent of all reported vacancies. There were also significant differences in occupational structure of the vacancies. Of the vacancies reported by private firms, almost half were for skilled workers while another 29 per cent were for unskilled workers (Figure 17). Fully or partly state-owned establishments were more likely to be looking to hire workers with professional, administrative or technical qualifications. It is striking from Figure 17 that of the total vacancies in small firms, almost 58 per cent were for skilled workers and another 10 per cent were for technicians; whereas in large firms, the vacancies were more evenly spread among the various occupational groups.
Figure 17. Establishments by occupational share of vacancies and size
Establishments that had adopted new technology accounted for 62 per cent of all vacancies (although they represented only 20 per cent of all establishments surveyed). Of the vacancies, the establishments that had adopted new technology were more likely to demand skilled workers and professionals than those establishments that had not modernized (26 per cent as compared to 18 per cent for skilled workers, and 18 per cent as compared to 12 per cent for professionals).
Although import competitors accounted for less than 10 per cent of all vacancies, their vacancy structure showed a very strong demand for skilled workers and technicians (60 per cent of all vacancies as compared to 36 per cent of the vacancies in firms not competing with imports). Export competitors accounted for 20 per cent of all vacancies, and again they displayed a strong demand for skilled and technical workers (almost half of all vacancies as compared to 36 per cent in firms not competing in foreign markets).
Another indication of the limited employment creation was that the total number (7,111) of newly hired workers over the past year represented only 2.5 per cent of current employment. The private establishments accounted for 43 per cent of all new hires (compared to 16 per cent of vacancies). Most of the newly hired workers were, however, concentrated in large establishments (almost 90 per cent of all new hires). In terms of occupational groupings, skilled workers and technicians clearly accounted for the largest group of new hires across all establishments by both size and ownership. But among the new hires in small and medium size establishments, more than a third were unskilled workers (Figure 18).
The data in Table 4 suggest that there was a decline rather than increase in overall employment in the surveyed establishments, in that there was a larger number of “exits” than new hires or vacancies over the past year. Those who quit, retired or were retrenched, dismissed, transferred or seconded numbered 11,991 as compared to 7,111 new hires, meaning a net loss in total employment of some 4,880 jobs. The fully state-owned establishments accounted for 63 per cent of all employee separations, and correspondingly 94 per cent of all exits were from establishments with more than a hundred workers. The overall turnover rate (crudely calculated as total exits over past twelve months as a percentage of total employment on 1 January 1996) was 4.2 per cent. By occupation, the turnover rate was highest for managers, followed by supervisors and lowest for skilled workers.
Table 4. Vacancies, recruitments and exits as a percentage of total employment Occupation Total Vacancies Total New Hires Total Exits Total Employment Vacancies as % of Total Employment Hires as % of Total Employment Exits as % of Total Employment Managers 213 252 653 8643 2.4 2.9 7.6 Professionals 581 921 1158 22162 2.6 4.2 5.2 Clerical 368 796 1331 34949 1 2.3 3.8 Supervisors 304 313 785 14160 2.1 2.2 5.5 Technicians 597 1358 2020 50010 1.1 2.7 4 Skilled workers 829 2023 3603 101517 0.8 2 3.5 Unskilled workers 760 1448 2441 50818 1.4 2.8 4.8 Total 3652 7111 11991 282259 1.2 2.5 4.2
The picture that emerges from Figure 19 suggests that the role of state-owned establishments in employment creation may be changing, especially vis-a-vis the role of private establishments. While the fully state-owned establishments accounted for the largest proportion of exits and reported vacancies, it was the privately owned establishments that were responsible for the largest share of new hires. This may suggest that, especially with the trend towards privatization, greater attention should be given in the future to the labour demand of the privately owned establishments.