CREDIT DEFAULT SWAPS AND COUNTERPARTY RISK
CREDIT DEFAULT SWAPS
AND COUNTERPARTY RISK
A U G U S T 2 0 0 9
In 2009 all ECB publications feature a motif taken from the €200 banknote.
© European Central Bank, 2009 Address Kaiserstrasse 29 60311 Frankfurt am Main Germany Postal address Postfach 16 03 19 60066 Frankfurt am Main Germany Telephone +49 69 1344 0 Website http://www.ecb.europa.eu Fax +49 69 1344 6000
All rights reserved. Reproduction for educational and non-commercial purposes is permitted provided that the source is acknowledged.
C O N T E N T S
1 EXECUTIVE SUMMARY 4
2 INTRODUCTION 7
3 CDS MARKET OVERVIEW 9
3.1 What are CDSs and how are they
used? 9
3.2 Data sources 1 1
3.3 Market size and structure 1 4
3.4 CDS counterparty risk measures 1 5
3.5 Conclusions 1 7
4 COUNTERPARTY RISK AND ISSUES
FOR FINANCIAL STABILITY 2 0
4.1 Concentration 2 1
4.2 Interconnectedness 2 5
4.3 Liquidity 3 4
4.4 Conclusions 3 5
5 COUNTERPARTY RISK MANAGEMENT 3 6
5.1 Counterparty risk management
techniques 3 6
5.2 Calculating credit exposure 3 8
5.3 Bilateral netting 4 2
5.4 Multilateral termination 4 4
5.5 Collateralisation 4 4
5.6 Collateralisation practices:
a global assessment 4 8
5.7 Conclusions: a central clearing
counterparty for CDS 5 0
6 CDSs AND THE CREDIT CYCLE 5 4
6.1 CDS use by banks: hedging and
trading aspects 5 4
6.2 CDSs, impact on funding costs,
and market-implied ratings 5 9
6.3 CDS price transparency 6 2
6.4 CDSs, systemic risk indicators,
and cross-market linkages 6 4
6.5 Sovereign CDS developments 6 7
6.6 Conclusions 7 0
7 REGULATORY AND MARKET
INITIATIVES 7 4
7.1 CDS central counterparty clearing 7 6
7.2 Bilateral counterparty risk
management 7 9
7.3 Operational risk 8 0
7.4 CDS contract changes 8 1
7.5 Market developments: impact
of CDS contract changes 8 3
7.6 Market integrity 8 5
7.7 Capital requirements 8 7
7.8 Conclusions 8 8
LIST OF BOXES:
DTCC vs BIS OTC derivative survey 1
data – a comparison of coverage 1 8
Counterparty risk management and AIG
2 2 9
Market network structure
3 3 1
Lehman Brothers’ failure: an empirical 4
test of the CDS market 3 1
General capital requirements to cover 5
counterparty risk under Basel II 3 7
Potential future exposure: two examples
6 3 9
Application of capital requirements 7
to cover counterparty risk
under Basel II 4 1
The role of collateral
8 4 5
Effi ciency of CCPs
9 5 1
Treatment of CDSs as regards 10
banks’ regulatory capital 5 5
Corporate CDS market quotes – 11
research based on commercial
data providers 6 3
Decomposing banks’ CDS spreads
12 7 1
CDSs and the empty creditor problem
13 7 2
US Treasury proposals for a regulatory 14
framework for OTC derivatives 7 5
15 ESCB/CESR recommendations for securities settlement systems
and central counterparties 7 8
16 Big Bang Protocol and Auction
Supplement 8 2
17 Removal of the restructuring credit event from CDS contracts and possible
implications 8 3
Overview of the ISDA auction process
18 8 9
Insurance companies and CDS activity 19
in Europe 9 0
The standard North American contract
20 9 1
1 EXECUTIVE SUMMARY
The ongoing financial market turmoil has highlighted the importance of counterparty risk in the over-the-counter (OTC) derivative markets. The role played by credit default swaps (CDSs) has been the subject of lively debate, with some commentators claiming that the CDS market has increased fi nancial contagion or even proposing an outright ban on these instruments. CDSs are derivative instruments which enable market participants to transfer or redistribute credit risk. For example, a bank can buy CDS protection to protect itself against a default by a CDS reference entity. Given the relatively liquid nature of the CDS market, it is also a useful source of information on the price of credit under normal circumstances. However, to an outside observer, the size of the CDS market, combined with its structural opacity, concentration and interconnectedness, may be a sign that the CDS market also poses a systemic risk to fi nancial market stability. Given the international nature of the CDS market, these aspects could usefully be considered from a global perspective. This Banking Supervision Committee (BSC) report aims to provide an assessment, at the EU level, of the sources of counterparty risk and related challenges. Areas that deserve particular attention by public authorities and market participants will also be highlighted.
The CDS market is relatively small by comparison with other OTC instruments (accounting for less than 7% of the OTC market in terms of notional amounts), despite experiencing very considerable growth over the last few years. Recent BIS statistics place the notional value of CDS contracts outstanding in December 2008 at over USD 41 trillion. The net mark-to-market exposure, which represents the true counterparty risk in the CDS market (taking into account the netting of multiple trades between pairs of counterparties and the relevant collateralisation) is probably a fraction of this amount, but still diffi cult to quantify with available data.
Being an unregulated market, CDSs have always been opaque credit risk transfer instruments, and
their effective contribution to risk dispersion has always been diffi cult to measure and assess. Statistics on CDS volumes have recently improved following the release of more detailed statistics by a service provider in the CDS market in November 2008. However, the available data remain only loosely related to the actual credit risk and still do not provide any indication of individual counterparty risk exposures. Assessing CDS-related counterparty risk in the EU has therefore proved to be very challenging owing to the lack of information on the market value of CDS positions, on the identity of counterparties or on collateral practices (including the extent of collateralisation). In this regard, this report has benefi ted greatly from the availability of a unique set of data, in particular data made available by 31 of the largest European fi nancial institutions in response to an ad hoc qualitative and quantitative survey. Drawing on these data, the report sets out four main features of the CDS market in the EU that deserve attention for fi nancial stability purposes.
First, the CDS market remains highly •
concentrated in the hands of a small group of dealers, which is European banks’ main concern as regards CDS counterparty risk. In Europe, the top ten counterparts of each surveyed large bank account for 62-72% of its CDS exposures (when measured in terms of gross market value). In addition, the concentration of the CDS market is now higher than it was before the crisis, since some major players – for instance dealers (e.g. Bear Stearns, Lehman Brothers and Merrill Lynch), or counterparties that used to be sellers of protection, such as monolines, credit derivative product companies (CDPCs) and hedge funds – have exited the market. This concentration has increased the liquidity risk in the event of another dealer failure. Market participants have also indicated concerns regarding the relative scarcity of sellers.
Second, the interconnected nature of the •
S U M M A R Y
other through chains of OTC derivative contracts, results in increased contagion risk. In practice, the transfer of risk through CDS trades has proven to be limited, as the major players in the CDS market trade among themselves and increasingly guarantee risks for fi nancial reference entities.
Another fi nding is that, on the basis of the data provided by a CDS market provider, euro area banks are currently net sellers of CDSs, although the net amount of protection sold is relatively small and relates to the reference point in time for which this data was collected (April 2009). This contrasts with the traditional net buyer position indicated by BIS data.
The “risk circularity” within the CDS market may be a concern for fi nancial stability, as banks may be replacing one type of risk (i.e. credit risk) with another – counterparty risk.
Third, CDSs are widely – and increasingly – •
used as price indicators for other markets, including loan, credit and even equity markets. Thus, these instruments are playing a broader role in the determination of prices. On the loan market, CDSs may have an impact on access to credit and the cost of funding, as they are now widely used by larger banks for active credit portfolio management. Some fi nancial institutions have CDS premium-dependent pricing guidelines for new loans, while some credit rating agencies may place greater emphasis on the price discovery function of CDSs by actively offering market-implied ratings. In the cash bond market, investors are increasingly using CDSs as an indicator for their investment decisions.
The equity and CDS markets have also become more interlinked where CDS price movements have a feedback effect on the equity market. Indeed, a trading strategy commonly employed by banks and other market participants consists of selling a CDS on a reference entity and hedging the resulting credit exposure by shorting the stock. While linkages and circular feedback effects on the underlying reference entities cannot be ruled
out, comprehensive empirical studies have not yet been undertaken to determine the strength or otherwise of those links.
Although the CDS market may be a useful source of price information in normal market conditions, its reliability for pricing purposes in times of distress has recently been questioned. Given its properties as an OTC market, it is particularly diffi cult to conclusively assess the liquidity in the various CDS market segments.
Fourth and fi nally, the report also highlights •
the risk factors related to the signifi cant widening observed in sovereign CDS spreads in mid-March 2009. Given that sovereign CDS spreads are, in most circumstances, also viewed as lower limits for the corporations of those countries, further research is warranted to assess the causes of these developments. The potential policy implications in terms of the impact that these exceptional CDS spreads could have on the credit ratings of sovereign governments in illiquid environments and the possibility of negative feedback loops would thus seem to warrant further research for fi nancial stability monitoring purposes. This applies in particular to the liquidity of this market for the purpose of ensuring market integrity. The report also provides an overview of a number of regulatory and market initiatives that are under way with a view to addressing these weaknesses, including details of the latest EU consultation for OTC derivatives (including CDSs), and reviews the various initiatives to establish central counterparty clearing houses (CCPs) for CDSs. The potential systemic importance of CCPs was mentioned by the Governing Council of the ECB on 27 September 2001.1 The importance of CCPs was then confi rmed on 18 December 2008, when the Governing Council stated that there was a need for at least one European CCP for credit derivatives.2 http://www.ecb.int/press/pr/date/2001/html/pr010927_2.en.html 1 http://www.ecb.int/press/govcdec/otherdec/2008/html/ 2 gc081219.en.html
The importance of the CDS market and the related risks were also highlighted by the European Commission in a staff report published in July 2009.3
On the basis of these main fi ndings, the report highlights a number of areas that may need to be considered by the regulators. Above all, greater disclosure and transparency is required for the assessment of systemic risk. Aggregate data on market volumes have improved, mainly thanks to the release of CDS statistics by a market service provider. However, from a systemic risk management perspective, improvements would be desirable in a number of areas.
First, extended disclosure on counterparty •
risk would be useful, including indicators of counterparty concentration exposure, both for individual institutions and for the market as a whole.
Second, the differences between the major •
data sources in terms of their data coverage and methodologies should be bridged to allow market participants and regulators to obtain and benefi t from a broad and consistent market overview.
Third, improvements could also be made •
in terms of public disclosure. The most active institutions could regularly disclose their total gross notional amounts and gross market values for bought and sold CDS, as well as net market values for uncollateralised derivative transactions. That information could also be provided for these institutions’ largest counterparty positions and could be disclosed in their fi nancial statements.
Fourth, information regarding CDS prices •
remains a challenge for non-dealer market participants. Increased transparency with regard to turnover volumes for trades – for instance aggregated daily turnover volumes – is desirable for both non-dealer market participants and regulators.
Given the infl uence that CDS spreads may have on credit markets and equity markets, combined with the possibility of related negative feedback effects, further research is warranted for fi nancial stability monitoring purposes. This concerns a number of areas, such as the role of CDSs in the cost of fi rms’ funding and the role of CDSs in corporate and EU government bond markets, as well as the overall EU sovereign CDS market. Additional areas for further study include the linkages between the equity and credit markets before and during the crisis, the role played by CDSs in changes in credit ratings and the drivers of the recovery rates seen in ISDA auctions for European reference entities.
Finally, the establishment of CCPs for CDSs is now the focus of regulatory attention. Given the considerable extent to which counterparty risk is concentrated in CCPs and the importance of CCPs for fi nancial stability, it is vital that CCPs operate under appropriate supervisory oversight to ensure that they have sound corporate governance and robust risk management practices. On 16 July 2009 the Governing Council of the ECB also reaffi rmed the systemic importance of securities clearing and settlement systems and welcomed the progress made towards the introduction of central counterparty clearing facilities for OTC credit derivatives. In line with its decision of 18 December 2008 and its earlier statement of September 2001 on central counterparty clearing, the Governing Council also confi rmed the importance of having at least one CCP clearing facility for OTC credit derivatives located within the euro area. In this context, particular priority will be given to the use of euro area infrastructures for clearing credit default swaps denominated in euro, which will be closely monitored by the Eurosystem in the coming months.4
“Ensuring efficient, safe and sound derivatives markets”, 3
European Commission, COM (2009) 332, 3 July 2009. http://www.ecb.int/press/govcdec/otherdec/2009/html/ 4
2 INTRODUCTION
The ongoing financial market turmoil has highlighted the importance of counterparty risk in the over-the-counter (OTC) derivative markets, as shown by the acute diffi culties experienced by major dealers and other market participants, such as Bear Stearns, Lehman Brothers and AIG. These cases have highlighted the typically opaque linkages within the OTC markets, which have created a situation where market participants may be too big or interconnected to fail. In the light of these recent developments, this report aims to assess the counterparty risk and the main related risks faced by European market participants that are active within and exposed to the credit default swap (CDS) market.
This report will fi rst provide an overview of the various CDS markets, looking at: the main CDS products and their use; historical developments; the main players; and the structure of the market.
The second chapter will outline sources of counterparty risk for CDS instruments, discussing the following specifi c risks: wrong-way risk; jump-to-default risk; liquidity risk; concentration risk; and systemic risk. A broad assessment of current exposure to counterparty risk in Europe has been undertaken, building on data which have not been publicly available in the past. In addition, the materialisation of the various types of counterparty risk will be described in relation to the failures of AIG and Lehman Brothers.
The report will then assess the use of CDSs for hedging or trading purposes, before turning to the impact that CDSs have on the real economy via the cost of funding and access to credit. The use of CDSs as leading indicators during the current crisis will then be reviewed, since CDSs are frequently referred to as barometers for the pricing of risk and are increasingly having an impact on the fi nancing costs of both corporations and governments.
The report will conclude with a review of current market initiatives and regulatory initiatives for the CDS market following the outbreak of the crisis and the failure of Lehman Brothers in particular.
This report has been based on three datasets: national BIS data on credit derivatives; Depository Trust and Clearing Corporation (DTCC) data on CDSs taken from its Trade Information Warehouse (TIW); and a qualitative and quantitative survey of European banks active within the CDS market. Three workshops were also held in Frankfurt and London to collect the views of CDS dealer banks, various market providers, and the rating agencies Fitch, Standard & Poor’s and Moody’s, as well as the independent research company CreditSights and the legal fi rms Freshfi elds and Linklaters. Leading academic experts also contributed to this report with regard to various aspects of systemic risk within the CDS market.5 The workshops were complemented by a number of interviews with market participants on a bilateral basis.
The national BIS data analysed for this report were historical annual aggregated data on credit derivatives provided by fi ve countries (France, Germany, Italy, the Netherlands and the United Kingdom; henceforth the “EU5”) for the last fi ve years, as well as disaggregated BIS data compiled by individual institutions. This may be the fi rst time that these disaggregated BIS data have been used for a study of this market at EU level.6 The BIS data show notional fi gures and gross market values for bought, sold and outstanding amounts of CDSs, broken down by counterparty sector. This allowed an assessment of the market’s concentration, as well as a cross-country sectoral breakdown by counterpart (e.g. insurance companies or hedge funds).
Prof D. Duffi e (Stanford University), Prof R. Cont (Columbia 5
University).
See also http://www.ecb.int/pub/pdf/other/creditrisktransfer 6
The BIS Working Group on Credit Risk Transfer, of which the ECB is a member, was established in 2009 in order to look at how BIS data on CDSs – and credit risk transfer in general – collected under the auspices of the CGFS could be enhanced. One area in which the ECB has strived to improve the current data coverage has been the geographical coverage of risk. This allowed a customised set of euro area CDS statistics to be extracted from the DTCC’s Trade Information Warehouse database, providing a snapshot of the notional amounts of CDSs bought and sold by euro area entities, as well as details of gross and net notional outstanding amounts and the number of CDS contracts referencing euro area entities. In addition, for the purposes of this report, the DTCC measured the level of concentration among the top ten and the top fi ve dealers within the global CDS market and the amount of wrong-way risk. A quantitative and qualitative survey was also sent to 31 banks in seven countries (France, Belgium, Germany, Italy, the Netherlands, the United Kingdom and Spain). This measured – for the fi rst time – the amount of counterparty concentration at the level of individual banks, as well as the amount of collateralised OTC derivative exposures and notional amounts and market values for CDSs bought and sold as at the end of December 2008.
The qualitative questionnaire was also circulated to Fitch, Standard & Poor’s, Moody’s and CreditSights in order to obtain the views of banks and external credit analysts as regards the main concerns and issues in the CDS market.
O V E R V I E W 3 CDS MARKET OVERVIEW
3.1 WHAT ARE CDSS AND HOW ARE THEY USED?
CDSs are a product within the credit derivative asset class, constituting a type of OTC derivative. They are bilateral contracts in which a protection buyer agrees to pay a periodic fee (called a “premium”) and/or an upfront payment in exchange for a payment by the protection seller in the case of a credit event (such as a bankruptcy) affecting a reference entity or a portfolio of reference entities such as a CDS index (see Chart 3.1).7 The market price of the premium is therefore an indication of the perceived risk related to the reference entity. There are three main types of CDS (see Table 3.1). First, the “single-name CDS” offers protection for a single corporate or sovereign reference entity.
Second, CDS indices are contracts which consist of a pool of single-name CDSs, whereby each entity has an equal share of the notional amount within the index. The standardisation and transparency of indices has contributed strongly
to the growth of index contracts.8 In June 2009 this segment accounted for almost half of all CDS contracts in terms of notional outstanding amounts, compared with virtually nil in 2004. Liquidity for benchmark indices is enhanced by including only the most liquid single-name CDSs. Market participants have come to view the CDS indices as a key source of price
The ISDA 2003 defi nition of “credit event” covers “bankruptcy”, 7
“failure to pay”, “restructuring”, “obligation acceleration”, “obligation default” and “repudiation/moratorium”.
D. Duffi e, (2007), Innovations in credit risk transfer: Implications 8
for Financial Stability, Stanford University.
Chart 3.1 Basic CDS overview
Notional amount (After credit event)
Physical delivery of securities (After credit event)
Cash settlement (After credit event) CDS protection buyer CDS protection seller Payment of CDS premium
(No credit event)
Source:
Table 3.1 Three main types of CDS
Single Name The reference entity is an individual corporation, bank, or government.
Index CDS referring to multiple constitutent entities in the index with each entity having an equal share of the notional amount. The degree of standardisation is highest for these contracts. Basket CDS CDS with more than one reference entity
(typically between three and one hundred names). Specifi c types include fi rst-to-default CDS, full basket CDS, untranched basket and tranched basket known as a synthetic CDO.
information. Offi cial prices for these indices are collected by Markit and published on a daily basis. CDS indices do not cease to exist after credit events, instead continuing to trade with reduced notional amounts.
In addition, a market has also developed for CDS index tranches, whereby CDS contracts relate to specifi c tranches (also known as “synthetic CDOs”) within an established CDS index. Each tranche covers a certain segment of the losses distributed for the underlying CDS index as a result of credit events. For example, in the case of the iTraxx index, the lowest tranche – the equity tranche – absorbs the fi rst 3% of losses on the index. CDS index tranches are thus mainly instruments to trade the correlation between the default times of the constituent parts of the index. Third, basket CDSs are similar to indices, as they relate to portfolios of reference entities, which can comprise anything from 3 to 100 names. However, basket CDSs may be more tailored than index contracts and are more opaque in terms of their volumes and pricing. Basket CDSs, for example, include specifi c sub-categories such as fi rst-to-default CDSs (where investors are exposed to the fi rst default to occur within the basket of reference entities). In addition, derivative instruments such as CDS options (called “CDS swaptions”) are now also being traded. Holders of these instruments are entitled – but not obliged – to enter into forward-start CDS contracts to buy or sell protection. This type of instrument may benefi t from increased investor interest in the environment of increased transparency that may result from stronger migration of CDSs to CCPs. It is important to distinguish between standard single-name CDSs or index contracts and the more complex bespoke CDS contracts, as the latter can be very different (having, among other things, different degrees of liquidity and embedded leverage) and are frequently used for different purposes.
Although disentangling the various uses of CDSs is somewhat artifi cial, one approach has
been to distinguish between CDSs for hedging and trading purposes.9
In the fi rst category, CDSs can be used to hedge the credit risk of on-balance sheet assets (e.g. corporate bonds or asset-backed securities) by acquiring CDS protection on them. Such protection provides capital relief and insures the acquirer of protection against credit losses (assuming the terms of the CDS contract provide for perfect hedging). Commercial banks and other lenders are natural buyers of CDS protection for such purposes, while highly rated dealers, insurance companies, fi nancial guarantors and credit derivative product companies were the typical protection sellers prior to the fi nancial crisis.
A. Yavorsky, “Credit Default Swaps: Market, Systemic and 9
Individual Firm Risks in Practice”, Moody’s, October 2008.
Table 3.2 CDS Markit indices
CDX (US) Most liquid baskets of names covering North American Investment Grade, High Yield, and Emerging Markets single name credit default swaps.
ITraxx Most liquid baskets of names covering Europe, Asia, Australia and Japan.
LCDX (US) North American benchmark for fi rst lien leverage loan CDS. 100 reference entities, referencing 1st lien loans listed on the Syndicated Secured List.
LevX European benchmark for leveraged loans CDS. They are constructed from the universe of European corporates with leveraged loan exposures.
ABX (US) The 20 most liquid CDS on US home equity ABS. The ABX.HE index is used by banks and asset managers that want to hedge asset-backed exposure or take a position in this asset class.
CMBX (US) A synthetic index referencing 25 commercial mortgage-backed securities. The CMBX Indices were created in response to the rapid pace of growth in the CDS of CMBS market, providing investors with a standardized tool to gain exposure to this asset class.
MCDX (US) These indices refer to U.S. municipal credits covering revenue and general obligations. SovX Family of sovereign CDS indices covering
countries across the globe.
O V E R V I E W
They can also be used to hedge counterparty exposure. As part of their daily trading activities, dealers take on unsecured exposures to other financial institutions. Credit default swaps provide a mechanism for the hedging of such counterparty exposures and are highly sought after by market participants during periods of considerable market distress. They provide protection by producing a gain if credit spreads on their counterparties widen.
Derivatives can also be used as tradingtools, for speculating or arbitrage purposes. Speculators and arbitragists add liquidity to the market by “connecting” markets and eliminating pricing ineffi ciencies between them.
First, they allow a counterpart to acquire long exposure to credit assets in an unfunded (synthetic) form when selling CDS protection. The leverage embedded in credit default swaps (like that in other derivative instruments) offers a higher return on equity than acquiring the credit assets outright. In the presence of widening credit spreads, CDSs can offer equity-like returns and are therefore attractive to hedge funds, or even the more traditional bond funds. In addition, credit default swaps, by their very nature as OTC products, can be used to create bespoke exposures by enabling counterparties to choose either single-name or multi-name reference entities and by customising their pay-off triggers and amounts. These highly customised products are usually illiquid and consequently require a substantial amount of sophisticated modelling to estimate potential pay-off scenarios.
Second, CDSs also allow the acquisition of uncovered short exposure to credit assets when buying CDS protection. The acquirer of CDS protection effectively shorts the underlying reference asset(s). Shorting cash bonds is considerably more diffi cult because it requires the short-seller to borrow the assets, which is usually diffi cult to accomplish with fi xed income securities, particularly if the short-seller seeks to go short on a portfolio of assets. Hedge funds, or dealers with long CDS exposures,
which need to be hedged, are active acquirers of CDS protection.
To conclude, CDSs are not only risk management tools for banks but also contribute to the completeness of the market, by providing market participants with a possibility to take a view on the default risk of a reference entity, on a company or a sovereign borrower. Thereby and as shown during the crisis, derivatives allow for pricing of risk that might otherwise be diffi cult due to lack of liquidity in the underlying assets.
3.2 DATA SOURCES
Table 3.3 presents an overview of the public data sources currently available for CDS volumes. The most recent of these datasets is the DTCC’s statistics on CDS volumes. The DTCC estimates that it covers 90% of the credit derivative contracts worldwide, including over 95% of all inter-dealer CDS contracts measured in terms of the number of contracts (rather than notional amounts).The data are based on the DTCC’s TIW database. As the data are based on actual settlement instructions, this may currently be the most accurate data source available.10 DTCC data on net notional amounts (e.g. net notional outstanding amounts) also refl ect the effect of netting activities and are the most accurate source of reference for CDS-related credit risk posed by reference entities – as well as for traded amounts, which constitute a welcome improvement.
However, at this stage there are several ways in which DTCC data can be improved further in the interests of macro-prudential assessment. First, the DTCC does not provide retroactive information on trades, as its published CDS statistics only begin at the end of October 2008. One consequence of this is that the data do not cover the credit market developments during the
The availability of security-by-security data allows customised 10
data queries, which enabled the DTCC to respond to a range of special queries in support of this report.
period directly before and after the failure of Lehman Brothers.
Second, the counterparty breakdowns are not very detailed. They are currently limited to “dealers” versus “non-dealers”. In addition, the defi nitions of these categories are not consistent with those employed for previous market data collected by the BIS. Third, no information is provided on the market values of CDS contracts. Thus, new DTCC data are useful only in order
to assess credit risk, being of limited use for assessing counterparty risk.
Fourth and most importantly, the scope of its data coverage is far smaller than for BIS data (see Box 1 for fi gures).11 In terms of products, basket CDSs or bespoke CDSs are to a large extent not covered, since bespoke contracts are
Initiatives are currently under way within the DTCC to make its 11
coverage more comprehensive.
Table 3.3 Data source overview
Dataset Description Frequency Starts Last available
DTCC The Depository Trust and Clearing Corporation (DTCC) started to release weekly statistics regarding the gross, net and bought or sold notional amounts in CDS market in November 2008 (referencing end-October 2008). The data was augmented with weekly transaction volume data in January 2009.
Weekly October 08 2009
ISDA Market Survey
The ISDA publishes a semi-annual market survey which in addition to other OTC derivatives since December 1995 includes the notional amounts bought and sold of credit default swaps based on voluntary responses from approximately 60 institutions.
Semi-annual 1995 2008
Semi-annual OTC derivatives statistics
The Bank of International Settlements (BIS) undertakes a semi-annual voluntary CDS survey covering approximately 80 institutions within the G10 countries and Switzerland on credit default swaps (CDS). The survey results including notional amounts outstanding and gross market values for single- and multi-name instruments bought and sold by survey respondents. Additionally information on CDS by counterparty, sector and rating has been made available as of December 2005.
Semi-annual End-2004 End-2008
Fitch Ratings Credit Derivatives Survey
Fitch Ratings has conducted an annual credit derivatives survey for the reference years of 2003 to 2009 encompassing the amount bought and sold by industry sectors, broken down by main instrument types and the reference credit ratings. This survey was not conducted for 2007. Compared to other data sources, the Fitch survey highlighted the net selling positions of hedge funds and insurance companies, notably AIG, including as well named rankings of the largest players and the sector net positions in 2006. The survey was based on 26 institutions in 2009 (86 institutions in 2006).
Annual 1996 2006
British Bankers Association Credit Derivatives Survey
The British Bankers Association (BBA) undertakes a bi-annual survey regarding credit derivatives since 1996, covering signifi cant players in the international credit derivatives market. The survey participants provide estimates for the growth of the CDs market broken down by type of institution, geographical area and instrument types including the ratings of the reference asset. This survey was not undertaken for the reference year of 2008.
Bi-annual 1996 2006
BIS Tri-annual OTC derivatives statistics
The BIS also collected CDS data within its Tri-annual survey for the fi rst time in December 2007, referencing approximately 1,500 banks from 54 countries as per end-June 2007. Each participating central bank collects data voluntarily reported by banks and dealers in its jurisdiction and calculates aggregate national data. These are provided to the BIS on a anonymous basis, which compiles global aggregates.
Tri-annual End-2007 End-2007
O V E R V I E W
not yet cleared by the DTCC. Its data coverage relates primarily to single-name, index and index tranche CDSs. A particularly pertinent example concerns American International Group Financial Products, the monolines and the CDPCs. These three types of CDS sellers are not respondents to the BIS survey and so are not captured by traditional reporting methods, which are tailored mainly to banks. However, the DTCC data would not have enabled this gap to be bridged, as those entities typically sold protection via bespoke contracts.
In addition, the coverage of medium-sized and smaller banks is better in the BIS data, whereas the DTCC data are based solely on the trades included in the TIW, which is primarily a service for inter-dealer and dealer-to-client trades. This may cause the DTCC statistics to be biased towards representing large banks’ transactions. Most European banks now disclose basic information about their CDS exposures to investors, although details of credit reference assets’ credit ratings, counterparty concentration in terms of gross notional amounts as well as market values of CDS bought and sold, and collateralisation levels are not typically disclosed. Some European banks only disclose the aggregate notional amount of CDSs bought and sold. Overall, the information provided in public accounting statements varies across institutions, given that disclosure requirements are not harmonised across the EU. The ultimate level of disclosure does not, therefore, enable investors to evaluate different institutions’ level of involvement in the credit market on a harmonised basis as net sellers or buyers, or their actual exposures to risk, although the overall size of their notional or gross market value exposures is indicative of their relative activity within the CDS market.
The most recent version of the Guidelines on Financial Reporting (FINREP) developed by the Committee of European Banking Supervisors (CEBS) includes as part of its core template a requirement for banks to report notional outstanding amounts for credit derivatives
bought and sold. The CEBS has recast this template, which now includes the fair value of such derivatives, and the recast version is currently undergoing a general consultation with market participants. This is expected to conclude in 2009. However, the concentration level for major counterparties, levels of collateralisation and credit ratings of underlying assets are not currently addressed in this version. In some countries, however, regulators have collected considerable amounts of data. For instance, the US Offi ce of the Comptroller of the Currency (OCC) collects a markedly wider range of data in its quarterly report on banks’ derivative activities – including notional and gross market values for CDS reference entities broken down by credit derivative instrument type, by maturity, and into investment-grade and non-investment-grade derivatives. In addition, the level of collateralisation for net OTC derivative exposures will be published as of the second quarter of 2009, with that fi rst data release envisaged in September 2009.12 These data should, in principle, also be available for affi liates of European banks regulated by the Federal Deposit and Insurance Corporation, which collects the call reports used to produce the OCC derivative report.
The various data sources now provide a good overview of the aggregate market size, although there is currently a high degree of opacity both at the aggregate level and at the fi rm level as regards banks’ exposures to bespoke CDSs and some other market segments. The differences in terms of data coverage emphasise the need to bridge the various data sources. Although aggregate data on market volumes have improved, regular fi rm-level data disclosed to regulators with regard to their OTC derivative exposures and counterparty concentration still need to be enhanced.
http://www.occ.treas.gov/deriv/deriv.htm 12
3.3 MARKET SIZE AND STRUCTURE
According to the half-yearly BIS OTC derivative statistics, credit derivatives accounted for 7% of total outstanding OTC derivatives at the end of December 2008 in terms of nominal amounts (the equivalent of USD 42 trillion; see Chart 3.2). The gross notional value of contracts bought and sold is currently the preferred indicator when assessing the size of the CDS market. However, this is only very loosely related to risk, and even with these basic data, different sources give very different estimates of the size of the CDS market, although trends regarding market volumes are similar across data sources (see Chart 3.3).
In terms of gross market value, which is a more closely correlated measure of the magnitude of risks embedded in the OTC market, the CDS market increased from USD 133 billion in December 2004 to USD 5.7 trillion in December 2008 and constitutes the second largest market in terms of gross market value after interest rate contracts (see Chart 3.4). The increase in gross market values in 2007 and 2008 mainly refl ected increased volatility and the repricing of credit risk in the market during this period.
The credit derivative market has grown much faster than other derivative markets, and the gross notional amount of outstanding CDS protection bought and sold at the end of 2008 was seven times that of end-2004.
One factor contributing to this growth is the OTC nature of CDS contracts, as offsetting trades are often used instead of the termination
Chart 3.2 Notional amounts outstanding for OTC derivatives
(USD trillions; December 2004 – December 2008)
0 100 200 300 400 500 600 700 0 100 200 300 400 500 600 700 credit default swaps
commodity contracts equity-linked contracts interest rate contracts foreign exchange contracts
USD 41.9 trillion in December 2008
2005 2006 2007 2008
Dec. June Dec. June Dec. June Dec. June Dec.
Source: BIS.
Chart 3.3 Notional amounts outstanding for credit derivatives
(USD trillions; December 2004 – December 2008)
0 10 20 30 40 50 60 70 0 10 20 30 40 50 60 70
Dec. June Dec. June Dec. June Dec. June Dec. 62.2 54.6 29.2 38.541.9 ISDA BIS DTCC 2005 2004 2006 2007 2008
Sources: BIS, DTCC and ISDA.
Chart 3.4 Gross market values for OTC derivatives
(USD trillions; December 2004 – June 2008)
0 5 10 15 20 25 30 35 0 5 10 15 20 25 30 35
Dec. June Dec. June Dec. June Dec. June credit default swaps
commodity contracts equity-linked contracts interest rate contracts foreign exchange contracts
USD 5.7 trillion in December 2008
2005
2004 2006 2007 2008
O V E R V I E W
or replacement of former contracts. Instead, a chain of linked exposures arises, in which market participants know their direct counterparties but not the parties further down the chain.
By contrast, in the second half of 2008 the size of the CDS market shrank signifi cantly. In addition to decreasing volumes of new trades as a result of the declining number of participants following the failure of Lehman Brothers, a signifi cant factor contributing to this reduction was banks’ active participation in “termination cycles” (see Chart 3.5), leading to the compression of redundant positions, mainly in CDS indices, through multilateral terminations.
Following these multilateral termination efforts, notional amounts of outstanding CDS contracts declined by 25% between June and December 2008 in the EU5. This reduction is similar to the overall decline in notional amounts of outstanding CDSs (see Chart 3.6).
Exchange rate movements may also have played a part in this decline. EU banks report their notional positions to the BIS in US dollar equivalents, and the euro and the pound sterling depreciated by 30% and 12% respectively against the US dollar during that period. The exposures of European banks should decline by
between 4% and 25% if notional outstanding amounts are adjusted for currency movements, although more precise estimates cannot be made, as currency breakdowns for the underlying notional amounts are not available.
At the end of December 2008 the EU5 accounted for 40% of total outstanding CDSs in terms of notional amounts (in US dollar-equivalent terms). Interestingly, the EU5 banks’ holdings of multi-name products are substantial, accounting for 45% of the total market for CDS indices, compared with 37% for single-name CDS contracts.13
3.4 CDS COUNTERPARTY RISK MEASURES
This section will review various measures of counterparty risk (see Chart 3.7) and specifi c attributes of each such measure.
GROSS NOTIONAL AMOUNTS
The notional amount of a credit default swap refers to the nominal amount of protection bought or sold on the underlying bond or loan.
The gross notional amount of USD 42 trillion reported by the 13
BIS refers to the total amount of protection bought and sold worldwide. EU dealers’ share in that global total cannot, however, be calculated accurately, since CDSs sold by one EU dealer and bought by another would be counted twice: once as a sold CDS and once as a bought CDS.
Chart 3.5 Outstanding credit derivatives and multilateral terminations
(December 2004 – December 2008) 13.9 28.7 57.9 1.3 3.7 10 30.229.2 10 20 30 40 50 60 10 20 30 40 50 60 BIS gross notional outstanding
TriOptima terminations DTCC gross notional outstanding
41.9
0 0
2005 2006 2007 2008
Sources: TriOptima and ECB calculations.
Chart 3.6 Notional amounts of CDS contracts bought and sold
(December 2004 – December 2008) 0 2 4 6 8 10 12 14 16 total bought total sold 18 0 2 4 6 8 10 12 14 16 18 2005 2006 2007 2008
June Dec. June Dec. June Dec. June Dec.
Notional amounts are the basis on which cash fl ow payments are calculated.
The gross notional amount reported by the BIS is the total of the notional amounts of all transactions that have not yet matured, prior to taking into account all offsetting transactions between pairs of counterparties. As outlined above, gross notional amounts thus represent a cumulative total of past transactions. Using gross notional amounts as an indicator of counterparty risk may be misleading, as many trades are concluded with a single counterparty.
Once negotiated, CDSs bind both counterparties until the agreed maturity. Market participants basically have three choices when increasing or reducing their CDS exposures.
First, they can terminate the contract, provided the counterparty agrees to the early termination. Second, they can fi nd a third party to replace them in the contract, provided the counterparty consents to the transfer of obligations (“novation”). As a third option, dealers that want to unwind or hedge their positions
can also enter into offsetting transactions, sometimes (though not necessarily) negotiated with the same counterparty as the hedged deal. The third solution is used extensively, and so the number of trades has surged, resulting in an increase in total gross notional amounts. Indeed, this technique, by contrast with the other two, does not eliminate previous deals and instead adds them together. The end result is that external market commentators tend to pay too much attention to the gross market values in relation to other measures of the real economy such as GDP, whereas net notional amounts, where accounted for, may be downplayed or perceived as being very low or moderate in relative terms given the huge gross notional amounts outstanding.
NET NOTIONAL AMOUNTS
Having taken into account all offsetting transactions between pairs of counterparties (i.e. outstanding transactions relating to exactly the same reference entity – whether a specifi c borrower, a CDS index or a tranche of a CDS index), the net notional amount is the basis for calculating the net payment obligation in a credit event. In the event of a default, the payment made (under cash settlement) by the protection seller is equal to:
Net notional value × (1-recovery rate (%) of a reference obligation).
The net notional value is thus a proxy for the contribution made by CDSs to an institution’s risk exposure, as it represents the maximum amount of funds that could theoretically be transferred from the seller of protection to the buyer, assuming a zero recovery rate following a default by the reference entity.
In the case of CDSs which reference an index tranche, the net notional value represents the maximum amount of money that the seller of protection could be asked to transfer, assuming losses exceed the tranche’s attachment point. The DTCC provides aggregate net notional data for single reference entities. These comprise the Chart 3.7 Counterparty risk measures
(USD billions; 31 December 2008)
41,868
29,158
1,478 5,652
X gross notional amount
gross notional amount
net notional amount gross market value net market value
remaining exposure, net of collateral
BIS DTCC DTCC BIS Unknown Counterparty risk Notional amounts Market value
X (1-66%)
O V E R V I E W
sum of net protection bought (or sold) across all counterparties (see Table 3.4).
MARKET VALUES
The mark-to-market value of a CDS on a given reporting date is the cost of replacing the transaction on that date. The market value of a CDS is equal to the discounted value of all cash fl ows expected in the default leg (i.e. the payment to be made by the protection seller in the event that the reference entity defaults) and the fee leg (i.e. the agreed spread that the protection buyer has to pay every quarter), taking into account the probability of the reference entity defaulting. If that entity does indeed default, the market value should be equal to the notional value of the CDS, less the expected recovery value.
The BIS, in its derivative statistics, defi nes “gross market value” as the value of all open contracts before counterparty or other netting. Thus, the gross positive market value of a fi rm’s outstanding contracts is the sum of all the positive replacement values of a fi rm’s contracts. Similarly, the gross negative market value is the sum of all the negative values of a fi rm’s contracts.
Gross market value is not an accurate measure of counterparty risk, as it does not take into account the effect of netting for each pair of counterparties. However, this measure refl ects the changes that take place in trades’ market values between the inception date and the reporting date.
NET MARKET VALUE/GROSS COUNTERPARTY EXPOSURE
The net market value is not calculated solely for dealers’ CDS positions, but across all of their OTC derivative positions. Thus, this measure of gross counterparty risk is not available for CDSs alone, as dealers do not manage their counterparty risk exposure by asset class.
The net market value across counterparties is also referred to as “gross credit exposure”. Counterparty risk refl ects the risk of being forced to replace positions in the market were a counterparty to default, and net market values would therefore be a measure of counterparty risk, assuming there was no collateralisation. Unfortunately, however, neither gross nor net market values for CDS contracts are currently available from the DTCC.
NET COUNTERPARTY EXPOSURE
The counterparty exposure that remains after collateralisation represents genuine counterparty risk. However, it remains very diffi cult to quantify this counterparty risk given the nature of the data available.
3.5 CONCLUSIONS
The most common concern reported by EU banks in response to the survey was counterparty risk.
Three conclusions can be drawn. First, large concentrated pockets of counterparty risk within the fi nancial system cannot be assessed using aggregate data, since the data available are not broken down to the level of specifi c counterparts. Additional disclosures by individual institutions on their largest exposures – in terms of counterparties and instruments, and for amounts both bought and sold – would be necessary in order to carry out such analysis.
Second, the data published by the BIS and the DTCC are not in line, which could impair their use as an effective regulatory tool. Indeed, Table 3.4 Actual risk exposure (net notional
amounts before collateralisation)
(USD billions; December 2008)
Gross notional amounts Net notional amounts Ratio (net/gross) Single-name CDS contracts 14,830 1,477 10% CDS indices/CDS index tranches 14,328 1,276 9% Source: DTCC.
more work could be carried out with regard to methodology and metadata to allow the linking of the reporting frameworks. This would make it easier to cross-check statistical aggregates for the entire CDS market, as well as improving the quality and scope of the data.
Third, another area for possible improvement is enhanced public disclosure. The most active
institutions could regularly disclose their total gross notional amounts and gross market values for bought and sold CDSs, as well as net market values for uncollateralised derivative transactions. This information could also be provided for those institutions’ largest counterparty positions and could be disclosed to regulators or included in the institutions’ public fi nancial statements.
Box 1
DTCC VS BIS OTC DERIVATIVE SURVEY DATA – A COMPARISON OF COVERAGE
The sources of the data provided by the BIS and the DTCC are quite distinct. The BIS data are taken from a voluntary survey, whereas the DTCC’s data are derived from the repository system where its information on deals between counterparties are reconciled and subsequently stored. This determines to some extent the frequency of the data. While the DTCC publishes its statistics once a week, the BIS conducts its survey biannually. In May 2009, when the BIS published its end-2008 fi gures, the data from the two sources could be compared for the fi rst time. The BIS survey participation is voluntary, whereas DTCC data is based on actual CDS settlement instructions, which in theory would imply that the latter data source should have a higher coverage and demonstrate higher CDS contract volumes.
According to the BIS, the value of outstanding credit default swaps was USD 41.9 trillion, whereas the DTCC reported USD 29.2 trillion. This difference was mostly due to the more limited coverage of CDS contracts entered into by non-dealers within DTCC data. The DTCC repository contained details of 98% of the CDS contract volumes between dealers reported in the BIS survey.1 However, in volume terms, only 29% of the CDS contract volumes between non-dealers covered by the BIS survey were reported to the DTCC trade information warehouse. The lower coverage in DTCC data seems to mainly be due to a lower coverage of single name CDS contracts in DTCC data entered into by non-dealers, constituting 27% of the volumes within BIS statistics.
The BIS survey seemed to cover more single-name CDS contracts and fewer multi-name contracts than the DTCC. The BIS has investigated this issue and found that one potential reason for this discrepancy is the fact that some of the dealers reporting information in the OTC derivative survey may have reported credit default tranches as single-name instruments.
All in all, the two sources of data tend to be complementary rather than substitutes, given the differences between them in terms of their coverage, the scope of the breakdowns reported, the frequency of publication and the delays in the publication of the data. In principle, the main gap appears to be the limited coverage of single-name CDS contracts entered into by non-dealers within the DTCC statistics. The current lack of coverage of bespoke CDS contracts is another
O V E R V I E W
area where the DTCC data are lacking. However, the DTCC is currently working on broadening its coverage of non-dealer activity in the CDS market. Once these data have been made public, they could be used for an up-to-date in-depth analysis of the entire CDS market, since an in-depth analysis is currently possible only for CDS dealers.
The BIS may for the time being remain the benchmark when it comes to assessing the size of the CDS market and its ranking as regards the other OTC derivative markets. However to portray an area which could be improved, it can be noted that the BIS and the DTCC defi ne “dealers” in different ways. Traditionally, a dealer is a commercial bank that underwrites and trades in bonds and other debt securities. The BIS classifi es all survey respondents as dealers in its OTC derivative statistics, whereas the DTCC classifi es all banks and non-banks (as well as their affi liates) that are in the business of making markets or dealing in credit derivative products as dealers. Non-dealers comprise smaller banks, hedge funds, fund managers and insurance fi rms. There are no retail participants in the CDS market. BIS and DTCC would thus have to be bridged in order to give regulators and market participants a comprehensive overview of developments in the market.
Outstanding amounts of credit default swaps
(USD trillions; as at end-2008)
Dealers Non-dealers
DTCC (A) BIS (B) Ratio (A/B) 1) DTCC (A) BIS (B) Ratio (A/B) 1)
Single-name instruments 12.2 15.8 77 2.6 9.9 27
Multi-name instruments 2) 12.2 9.2 133 2.2 6.9 33
Total contracts 24.4 25.0 98 4.9 16.8 29
Sources: BIS and DTCC. 1) In percent.
4 COUNTERPARTY RISK AND ISSUES FOR FINANCIAL STABILITY
This section will review the transmission channels through which CDSs may have contributed to increases in systemic risk. CDS contracts are commonly regarded as a zero-sum game within the fi nancial system, as there is always a buyer for each seller of CDS contracts, as with all other OTC derivative contracts. The fi nancial turmoil has shown, however, that both buyers and sellers of CDSs may suffer losses if counterparty risks materialise.
Indeed, with CDSs, both parties are exposed to credit risk derived from the counterparty (or “counterparty risk”), which refl ects the potential for the counterparty to fail to meet its payment obligations. In other words, counterparty risk refl ects the risk of being forced to replace positions in the market, were a counterparty to default.
The replacement cost is of the same magnitude for the two counterparties concerned, but with a different sign. For instance, if there is a deterioration in the creditworthiness of the underlying reference entity (i.e. spreads widen), a trade will have a positive value for the protection buyer (i.e. that buyer is “in the money”), as the protection it already has is now worth more.
This positive value is the additional cost of conducting exactly the same trade with the original spread. Thus, a value of USD 10 billion would mean that it was necessary for a buyer to pay an additional USD 10 million to persuade a seller to take on the trade at the lower spread. Equally, a seller of CDS protection is “out of the money” by USD 10 million, as that party would now require USD 10 million to take on the original trade at the lower spread. If the seller were to then default, the buyer would be entitled to claim from the seller the cost of replacing the trade: USD 10 million. Equally, if the buyer were to default, the seller would
still be required to pay USD 10 million to the buyer.
This requirement to pay even if the money is owed to the defaulting party is a legally binding obligation under the ISDA Master Agreement. Dealers hedge market risk exposures resulting from a CDS by means of offsetting transactions with another party. If the second party is also a dealer undertaking additional hedging transactions, a chain of linked exposures will arise in which the market participants know their direct counterparties, but not the parties further along the chain.
A number of structural features in the CDS market have helped to transform counterparty risk into systemic risk.
First, the majority of the CDS market remains concentrated in a small group of dealers. Second, the case of Lehman Brothers has shown that the interconnected nature of this dealer-based market can result in large trade replacement costs for market participants in the event of dealer failures. Third, as regards the euro area banking sector, euro area banks appear to have become net sellers of standard single-name and index CDS contracts (although for limited amounts), which would imply exposure to market risk if there is a general increase in CDS spreads – for instance in the event of a dealer failing within the CDS market. Given the limited net values, this could change in the coming months, although the net position of euro area banks remained negative at the end of June 2009. In addition to the shift from those institutions’ historically net positive positions (i.e. as net purchasers), it should also be noted that banks seem to have been net sellers of protection for sovereign CDSs, which may in some cases constitute wrong-way risk. Finally, the low levels of liquidity resulting from the crisis and the current high levels of concentration in the market have both increased trade replacement costs and resulted in signifi cant bid-ask spreads for market participants, particularly for non-dealers.
R I S K A N D I S S U E S F O R F I N A N C I A L
S T A B I L I T Y 4.1 CONCENTRATION
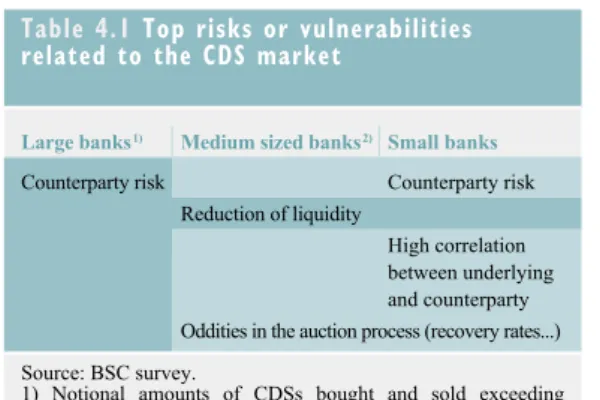
The results of interviews and the survey responses of market participants indicate possible over-concentration in the sense of a scarcity of sellers. This, together with liquidity risk, is the main concern of European banks as regards CDS-related counterparty risk (see Table 4.1). A reduced number of counterparties results in increased concentration risk and, consequently, greater systemic risk.
In the CDS market, as in other OTC markets, the major banks (i.e. dealers) trade actively among themselves and account for a large share of the daily turnover in these markets.
Indeed, the CDS market is concentrated around a few large players. In 2008 the fi ve largest CDS dealers were JPMorgan, the Goldman Sachs Group, Morgan Stanley, Deutsche Bank and the Barclays Group (see Table 4.2). This ranking has been calculated on the basis of public fi lings and seems to be comparable to that listed in Fitch’s 2009 derivative survey.14
A recent survey of U.S fi rms by Fitch also indicate that 96% of credit derivatives exposures at the end of Q1 2009 of one hundred surveyed fi rms was concentrated to JP Morgan, Goldman Sachs, Citigroup, and Morgan Stanley and Bank of America.15
According to DTCC data, the fi ve largest CDS dealers were counterparties to almost half of the total outstanding notional amounts as at
17 April 2009 and the ten largest CDS dealers were counterparties to 72% of the trades (see Chart 4.1).16
As regards BIS data, the market share of major players seems to be larger in Europe than it is for the total global market. This, however, is explained by the difference between the BIS and DTCC data in terms of scope (see Chart 4.2). The quantitative survey included details of the percentage of trades that the largest dealers conducted with their ten largest clients. The results of that survey, which are similar to the DTCC data, showed a high level of concentration in the CDS market when looking at individual
See also “Global Credit Derivatives Survey: Surprises, 14
Challenges and the Future”, Fitch, 20 August 2009.
See also “Derivatives: A Closer Look at What New Disclosures 15
in the U.S. Reveal”, Fitch, July 2009.
These proportions are also valid for the gross notional amounts 16
bought and sold.
Table 4.1 Top risks or vulnerabilities related to the CDS market
Large banks 1) Medium sized banks 2) Small banks
Counterparty risk Counterparty risk Reduction of liquidity
High correlation between underlying and counterparty Oddities in the auction process (recovery rates...)
Source: BSC survey.
1) Notional amounts of CDSs bought and sold exceeding €500 billion.
2) Notional amounts of CDSs bought and sold exceeding €200 billion.
Table 4.2 Top five CDS dealers
(USD billions; 31 March 2009)
Institution Bought Sold
Notional Gross Market value Notional Gross Market value
JPMorgan 3,834 514 3,668 479
Goldman Sachs Group 3,430 N/A 3,170 392
Morgan Stanley 3,200 432 3,093 399
Deutsche Bank 1) 6,191 2) 411 N/A 363
Barclays Group 1) 6,033 2) 269 N/A 248
Sources: 10-Q SEC regulatory fi lings and annual reports. 1) Data as at 31 December 2008.
CDS-dealing banks. The survey collected both notional outstanding amounts and positive market value positions. In principle, the latter measure is a better proxy for counterparty risk than notional amounts, as refl ects the costs that may arise if trades with counterparties need to be replaced. The survey concluded that 62-72% of the largest EU banks’ CDS exposures (measured in terms of
gross market value) were against those banks’ ten largest counterparts (see Chart 4.3).
Exposure relative to bank capital is higher for the largest EU banks, for which gross positive market values account for more than 350% of their tier 1 capital, compared with 125% for the average bank in the sample (see Chart 4.4).
Chart 4.2 Total CDS protection bought worldwide (percentages; December 2008) 1% 74% 17% 1% 7% with reporting dealers with banks and securities firms
with insurance firms
with other financial institutions (SPV, SPE, Hedge Funds...)
with non financial customers
Source: BIS.
Chart 4.4 Gross positive market values relative to assets and capital
(percentages; December 2008) GPMV/Total assets GPMV/Total equity GPMV/Tier 1 0 50 100 150 200 250 300 350 400 0 50 100 150 200 250 300 350 400 rank 01-10 (top10) rank 11-20 rank 21-30 full sample Source: BSC survey.
Chart 4.3 Shares of individual banks’ ten largest counterparties in gross positive market values (percentages; December 2008) 37 100 65 65 62 72 0 20 40 60 80 100 120 0 20 40 60 80 100 120
rank 01-10 (Top10) full sample weighted average
minimum maximum
Source: BSC survey.
Chart 4.1 Total notional amounts of outstanding CDSs sold by dealers worldwide, broken down by ranking
(USD billions; percentages of total; 17 April 2009)
0 2,000 4,000 6,000 8,000 10,000 12,000 14,000 16,000 0 2,000 4,000 6,000 8,000 10,000 12,000 14,000 16,000
top 10 dealers other other dealers 1-5, dealers 6-10, 28% 49% 23% Source: DTCC.
R I S K A N D I S S U E S F O R F I N A N C I A L
S T A B I L I T Y
It should, however, be noted that this indicator does not take into account the collateral underlying these exposures.
The current high levels of concentration in the CDS market probably exceed those observed before the crisis, as the market has seen the exits of the independent CDS dealers Bear Stearns, Lehman Brothers and Merrill Lynch. This has also coincided with the reduction of proprietary trading activities by several European banks and reduced amounts of CDSs sold by hedge funds and exits from the market by large CDS sellers such as AIG, the monolines and the CDPCs. It is diffi cult to demonstrate an increase in concentration using the CDS data provided by the DTCC, as these statistics were fi rst published in November 2008, showing the outstanding amounts of CDS at the end of October 2008, after Lehman Brothers’ failure. This report has therefore used the only existing historical series available – the BIS data – to demonstrate this reconcentration of the market and to illustrate non-bank players’ retreat from the market since the crisis began.
First, BIS data show that non-bank players have retreated from the CDS market since the crisis began.
At the global level, from 2005 to 2007 non-bank fi nancial institutions accounted for 12% of sales of protection to BIS dealers. This share was 10% in June 2008 and only 7% in December 2008 (see Chart 4.5).
One possible explanation is that, post-crisis, signifi cant losses have eroded capital and the institutions’ appetite for the selling of protection. In the non-bank sector, there are fewer active pure protection sellers. Hedge funds, fi nancial guarantors, credit derivative product companies, and synthetic CDOs and SIVs are all examples of net sellers of CDSs prior to the onset of the crisis. In addition, according to some market participants, the market has experienced a
fl ight-to-quality effect, which has benefi ted the sounder large institutions and may have been detrimental to the non-bank sector.17
Market participants have indicated that a number of hedge funds were increasingly pursuing credit-oriented strategies in the run up to the fi nancial crisis, and that these players accounted for signifi cant daily CDS trading volumes. This was also the fi nding of a Fitch survey in 2006. The level of CDS trading activity has, however, fallen sharply in conjunction with fi nancial deleveraging and fund closures. A record number of hedge funds were levered less than once during the months of September and October 2008 in the face of investor redemption requests, losses, aggressive deleveraging and – potentially – reduced credit lines extended by prime brokers and increased margin calls. This, in combination with bilateral collateral management procedures, may have prevented considerable concentration risk from materialising within the hedge fund community in relation to the CDS market. In the absence of detailed CDS-specifi c corporate disclosures by institutions, it is not possible to
“Institutional Investors See Counterparty Risk As Growing Threat 17
To Global Markets”, Greenwich Associates, 12 August 2008.
Chart 4.5 Notional outstanding amounts of CDS protection bought by BIS dealers worldwide (USD billions) 0 10,000 20,000 30,000 40,000 50,000 0 10,000 20,000 30,000 40,000 50,000
June Dec. June Dec. June Dec. June Dec. with non financial customers
with other financial institutions (SPV, SPE, Hedge Funds...) with insurance firms with banks and securities firms (reporting and non reporting)
2006 2007 2008 2005