What's the Difference? Measures of Racial Disparity in Rates of a Sexually Transmitted Disease
By
Julia C. Dombrowski
A Master's Paper submitted to the faculty of The University of North Carolina at Chapel Hill
In partial fulfillment of the requirements for The degree of Master of Public Health in
The Public Health Leadership Program
Chapel Hill
2002
L
E
I
F
ABSTRACT
Background: Elimination of racial disparities in health is a national health priority, yet little attention has been devoted to the choice of measures used to quantifY disparity. Community-level risk factors for racial disparity in STDs are largely unstudied.
Goal: To determine whether ten county-level demographic variables were associated with black-white disparity in gonorrhea incidence rates in North Carolina and to investigate how the association between the variables and racial disparity varied depending upon the measure of disparity used [incidence rate ratio (RR) vs. incidence rate difference (RD)].
Methods: We examined the relationships between the demographic variables and 5-year county average black-white RR and RD in gonorrhea in NC using simple linear regression, scatter plots, and Pearson's correlations.
Results: All variables except sex ratio were more strongly correlated with RD than with RR. RD was strongly positively correlated with the incidence rate of
gonorrhea among blacks (>0.99) and RR was less so (0.30).
Conclusions: Several county-level variables are associated with additive racial disparity in gonorrhea in NC. This is likely due to the fact that RD is highly correlated with gonorrhea rates in the black population, and correlation of the variables with RD essentially reflects correlation with gonorrhea rates in the black population. Public health interventions aimed at reducing racial disparity in gonorrhea in NC should primarily aim to reduce absolute disparities.
INTRODUCTION
Elimination of health disparities is a central public health goal at present [1, 2], yet the issues surrounding measures used to quantify these disparities have not been adequately addressed. Incidence rate ratio (RR) and incidence rate difference (RD) are the two measures most commonly used for this purpose. While the RR conveys information about the relative difference in disease rates between two populations, the RD quantifies the absolute magnitude of difference.
The importance of measure of effect selection in epidemiologic studies has been established for a number of health conditions. Stevens and colleagues
demonstrated the impact of using different effect measures when evaluating the
I
relationship between obesity and mortality across age groups [3]. They reportedthat the mortality rate difference between obese and non-obese groups increased
F
with age, but that the mortality rate ratio decreased. This is due to the fact thatoverall mortality increases dramatically with age, thereby decreasing the relative effect of obesity on mortality in older age groups. Opposing trends in absolute vs. relative measures over age groups have also been demonstrated in the effect of tobacco smoking on risk of death from lung cancer [4], systolic blood pressure on risk of death [5], and risk of cardiovascular death in women taking oral
contraceptives [ 6].
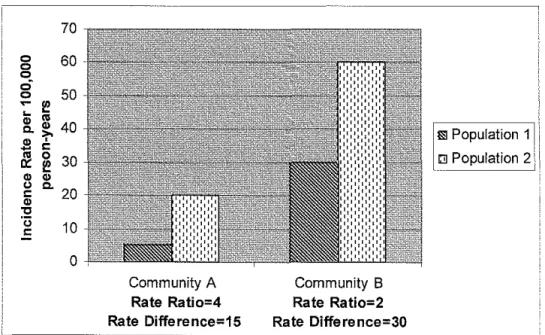
the same year (comparison across geography) or the racial disparities in one county from one year to the next (comparison across time). In either situation, the measure used has a critical impact upon the conclusions drawn from the data. Figure I provides an example of this.
Figure 1. Comparison of Disparities in Disease Rates Between Two Communities.
0
0 0
0
0
70
60
50
0
[ _ _ _ _ _
Community A
Rate Ratio=4 Rate Difference=15
Community B
Rate Ratio=2 Rate Difference=30
Ill Population 1
c;~ Population 2'
Although Community A has a greater ratio of disease rates than
Community B, the absolute difference in rates is lower in Community A than in Community B. Which community has a greater level of inequality between the two populations depends upon the perspective used to view the data.
Relative and absolute dimensions of disparity both portray important aspects of the disparity problem. Nonetheless, public health personnel often focus upon one measure when selecting communities for interventions aimed at
3
I
L
reducing racial disparities or when evaluating outcomes of such programs. Currently, disparities are most commonly illustrated with relative measures. A report recently released from the NC Office of Minority Health [7] focused solely
I
upon the ratios of age-adjusted death rates between racial/ethnic minorities and ~ whites. A study of racial disparities in Chicago over 20 years concluded, basedentirely on trends in black-white rate ratios of disease, that Healthy People 2010 measures implemented in that city were not effective in reducing racial disparities
[8]. The 2001 State Health Rankings Report of the United Health Foundation
t
r
i
ranked states in the area of racial disparities in health outcomes based only upon
I
the rate ratios of potential years oflife lost between racial/ethnic minorities and whites [9]. None of these reports fully explained the methodological decision to
examine only relative measures. l
Relative and absolute measures each have advantages and disadvantages. The major advantage of the RR is that it provides information about rates of a disease in comparison to a reference population in a form that is simple to
Racial Disparity in Sexually Transmitted Diseases
In the United States (US), African American populations bear a vastly
disproportionate burden of sexually transmitted disease morbidity compared to
any other racial or ethnic group. Incidence rates of gonorrhea in African
Americans are typically 20-35 times those in white populations [10]. In North
l
Carolina (NC) during the year 2000, 829 more cases per 100,000 population were
reported in African Americans than whites [11]. African Americans constitute
approximately 22% of the population in the state, but 82% of gonorrhea cases in
the year 2000 were reported in this group [11].
Although the existing literature regarding racial disparities in STD rates is
I
'still relatively sparse, several studies have examined the relationship between
community-level sociodemographic factors and gonorrhea incidence rates in the
US [12-18]. Such studies have consistently demonstrated gonorrhea incidence
rates to be correlated with black race [12-14, 17]. Race is often described as a
"risk marker" which correlates with other variables that affect STD rates, such as
poverty, access to quality health care, illicit drug use and living in communities
with high prevalence of STDs [1 0]. However, the correlation between race and
STD incidence rates often persists after accounting for socioeconomic status [ 16].
l
The causes behind this association remain unclear. Reporting bias, a resultof the fact that African Americans are more likely than whites to seek care in
publicly funded clinics which more thoroughly report STDs than private providers
[19], may account for a small proportion of this disparity. This factor alone,
however, is insufficient to account for the level of racial disparity in gonorrhea
observed in NC and throughout the US. A recent study by Gaffield and Thomas [ 15] found that interracial dynamics, rather than race itself, are associated with gonorrhea rates in a community. Their analysis included county-level measures of racial residential isolation (a measure of segregation) and income inequality. When these factors were accounted for in multivariable analysis, the proportion of the population in a county that was black was no longer an independent predictor of endemically high gonorrhea rates in the county.
Present Study
We hypothesized that county-level variables shown to be associated with gonorrhea rates would also be associated with black-white disparity in gonorrhea incidence rates in NC. This was based on the observation that STD rates in many US cities and counties are dependent upon the size of and rates of disease in the black population of the area. We selected the state ofNC for a study of black-white disparity in gonorrhea because it has relatively high rates of gonorrhea, has a sizeable black population, and has reported gonorrhea rates by race on the county level for more than a decade. We chose to examine racial disparity between blacks and whites because these are the two largest racial groups in NC and because blacks are so disproportionately affected by gonorrhea. The Latino population in North Carolina grew rapidly during the 1990s. However, we did not examine the disparities affecting this population in the present study.
The purpose of this study was two-fold: I) to determine whether I 0 demographic variables associated with gonorrhea rates at the community level
I
rr
i
were also associated with black-white disparity in gonorrhea incidence rates in North Carolina and 2) to investigate how the strength of association between the demographic variables and racial disparity in gonorrhea varied by the measure of disparity (RR vs. RD) used. [Note that in the remainder of this report the terms
black and white are used to correspond to the categories used in data from the NC Division of Public Health.]
7
t
L
METHODS
Data Collection
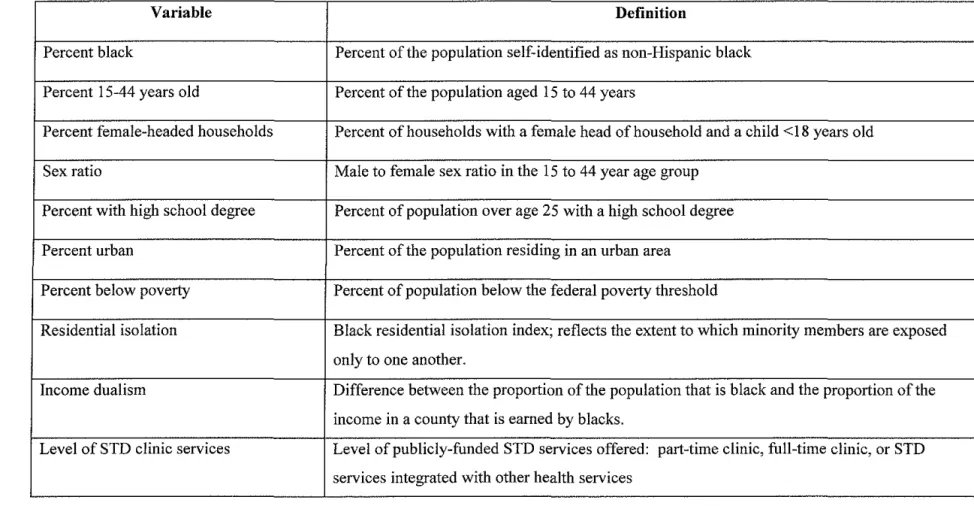
Independent variables (Table I) were selected on the basis of previously demonstrated association with gonorrhea incidence rates in multivariable analysis [12-18]. Reports of gonorrhea cases stratified by race in the I 00 counties of North Carolina during the 5-year period of 1990 to 1994 were obtained from the NC Division of Public Health. Three counties with black or white populations of fewer than 100 were excluded from the analysis to avoid problems of rate
instability. Estimates of each county's black and white populations for each year during the same time period were obtained from the NC State Demographic Center [20]. Annual gonorrhea incidence rates (IR) were calculated by dividing the number of cases in each race by the population estimate for that race in the same year. The result was then multiplied by I 00,000 to represent the gonorrhea incidence rate per 100,000 person-years. Five year averages in black to white incidence rate ratio of gonorrhea were calculated by dividing the five year sum of gonorrhea IRs for blacks by the five year sum ofiRs for whites and dividing by 5. The RD was calculated by subtracting the five-year sum ofiR in whites by the five-year sum IR in blacks and dividing by 5.
Data on the following measures were obtained from the 1990 Decennial Census [21] for each county: percent of the population classified as non-Hispanic black, percent 15 and 44 years old, sex ratio in the 15 to 44 year age group,
L
l
f j
F
Table 1. Definitions of Study Variables
Variable Definition
Percent black Percent of the population self-identified as non-Hispanic black
Percent 15-44 years old Percent of the population aged 15 to 44 years
Percent female-headed households Percent of households with a female head of household and a child <18 years old
Sex ratio Male to female sex ratio in the 15 to 44 year age group
Percent with high school degree Percent of population over age 25 with a high school degree
Percent urban Percent of the population residing in an urban area
Percent below poverty Percent of population below the federal poverty threshold
Residential isolation Black residential isolation index; reflects the extent to which minority members are exposed
only to one another.
Income dualism Difference between the proportion of the population that is black and the proportion of the
income in a county that is earned by blacks.
Level of STD clinic services Level of publicly-funded STD services offered: part-time clinic, full-time clinic, or STD
services integrated with other health services
9
, -··"""'~·
0
·~·-~'"'"''lll""""'n:i'fnlll'lll'rtT'I''F'-''"''''~---percent female-headed households, ·~·-~'"'"''lll""""'n:i'fnlll'lll'rtT'I''F'-''"''''~---percent with a high school degree, ·~·-~'"'"''lll""""'n:i'fnlll'lll'rtT'I''F'-''"''''~---percent urban, and percent below poverty.
Two indices of interracial dynamics, residential black isolation and
black-white income dualism, were derived from 1990 Census data. The isolation index
L
is a measure of de facto segregation and reflects the extent to which minority jF
members are exposed only to one another [22]. This index can be practically interpreted as the chance that a randomly drawn member from the minority population shares a residential area with another individual of the same minority group. The index varies between 0 and 1, with higher values denoting greater isolation. The computation of this index is described fully elsewhere [22].
Income dualism is a measure of the inequality generated by the difference
I
!in average incomes of black and white households (defined by the reported race of the household head) [23]. It is the difference between the proportion of the
county population that is black and the cumulative share of income in the county that blacks receive. Greater values of income dualism represent greater levels of income disparity.
Information on availability of publicly funded STD services in each county was obtained from the state STD Manager. The level of service was categorized as a full-time dedicated STD clinic, a part-time clinic for STD care, or STD services integrated with other public health services.
Statistical Analysis
The two outcome measures, 5-year average black-white gonorrhea
incidence rate ratio (RR) and 5-year incidence rate difference (RD) were analyzed as continuous variables. Univariable analyses ensured that no substantial gaps existed in the data and determined whether the distribution of any variables was notably skewed. The RR was transformed to a logarithmic measure to normalize the distribution of this variable for the remaining analyses.
In bivariable analysis, we used simple linear regression to examine the correlation between each independent variable and each outcome measure. Pearson's correlations were calculated to quantifY the strength of association of each variable with the outcome. We performed Spearman's rank correlations with non-transformed RR and RD as outcomes, but the results of these did not differ substantially from the results of the Pearson's correlations.
The mean RR and RD in counties with each of the three levels of STD services were examined. Correlations among the independent variables were analyzed to determine the direction and strength of correlation between each variable with the other, if any. Relationships between the outcome measures and 5-year average incidence rates among blacks, among whites, and overall rates in the population were also examined.
One county was a notable outlier in both the RD and RR measures. This county had a relatively small total population ( 11 ,268 persons), a small black population (170 persons), and, according to census data, no black females resided there in 1990. The bivariable results differed substantially with this county
included. In order to make our results more stable and generalizable, we excluded it from our analyses.
Multivariable regression modeling of these data would be difficult because
several of the independent variables were highly intercorrelated (Pearson's
L
correlation coefficients >0.6). The interpretation of such a model would beproblematic and would have questionable applicability to public health decision-making. Therefore, we chose to focus this study on bivariable analyses.
All analyses were performed using Stata version 7.0 statistical software (Stata Corporation, College Station, Texas). The Institutional Review Boards of the University ofNorth Carolina School of Public Health and Duke University
I
Medical Center approved this study.
RESULTS
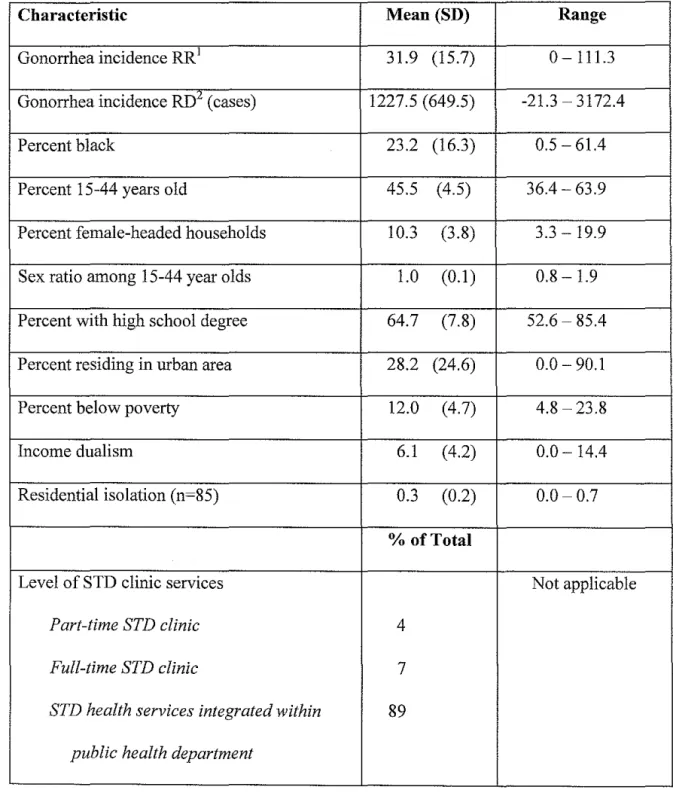
Data collection on all measures except residential isolation (n=85) was complete in all counties (Table 2). One county had a rate of 0 cases per I 00,000 person-years among whites and therefore had missing data for the RR measure.
The counties demonstrated high mean values and a wide range of 5-year averages in black-white gonorrhea RR (0--111.3; mean 31.9, median 30.1) and RD (-21.3- 3172.4 gonorrhea cases; mean 1277.5 cases). The percent of the
population that was black also varied widely across counties (0.5-61.4; mean 23.2), as did the percent below poverty level (4.8-23.8; mean 12.0), percent female-headed households (3.3-19.9; mean 10.3), and percent residing in an urban area (0-90.3). The majority of counties (89%) offered STD services integrated with other public health department services.
With the exception of male-to-female sex ratio, all variables were correlated more strongly with rate difference than with logarithmically transformed rate ratio (using log base e22). Eight of the 10 variables were
associated with gonorrhea incidence RD at a correlation coefficient of 0.2 or greater while none of the 1 0 were associated with RR at a correlation coefficient of greater than 0.16 (Table 3). The variable most strongly positively correlated with risk difference was percent residing in an urban area (Pearson's correlation coefficient = 0.65) [Figure 2]. Of the 10 variables, male to female sex ratio was most strongly correlated with RR (-0.16). Scatterplots did not suggest any non-linear correlations between the predictor variables and the outcome measures.
13
L
i '
r
L
j
i
¥
i
Table 2. County Sociodemographic Characteristics (n = 96)
Characteristic Mean (SD) Range
Gonorrhea incidence RR1 31.9 (15.7) 0-111.3
Gonorrhea incidence RD2 (cases) 1227.5 (649.5) -21.3-3172.4
Percent black 23.2 (16.3) 0.5-61.4
Percent 15-44 years old 45.5 (4.5) 36.4-63.9
Percent female-headed households 10.3 (3.8) 3.3-19.9 Sex ratio among 15-44 year olds 1.0 (0.1) 0.8- 1.9 Percent with high school degree 64.7 (7.8) 52.6-85.4 Percent residing in urban area 28.2 (24.6) 0.0-90.1
Percent below poverty 12.0 (4.7) 4.8-23.8
Income dualism 6.1 (4.2) 0.0- 14.4
Residential isolation (n=85) 0.3 (0.2) 0.0-0.7
%of Total
Level of STD clinic services Not applicable
Part-time STD clinic 4
Full-time STD clinic 7
STD health services integrated within 89 public health department
Table 3. Bivariable Associations Between County Characteristics and Black-White Disparity in Gonorrhea
Log-transformed
Rate Ratio Rate Difference
Characteristic Correlation Correlation
Coefficiene Coefficient
Percent Black -0.02 0.12
Percent 15-44 years old -0.10 0.32
Percent f-h households -0.04 0.33
Sex ratio -0.16 -0.04
Percent with high school degree 0.12 0.29
Percent urban 0.06 0.65
Percent below poverty -0.15 -0.24
Income dualism 0.03 0.23
Residential isolation -0.02 0.41
1. Pearson's correlation coefficients
15
I
~--L
f
b
Figure 2. Correlation of percent urban with black-white gonorrhea
incidence rate ratio (top) and with incidence rate difference (bottom), North Carolina, 1990-1994.
L
f--!nrrgc = 3.347 + 0.001 urban
f.-r• = 0.003 RMSE = 0.449 n = 95 ;=
5
0 0
a 0 0
i
4 0 0
r
0 oo 0 0 0
8 0
0 0 0 0 0 0
~
g' 8 00 'bo a 0 0
0 0 0 0 0 0 oo 0
"'
§, 0 0 0 Oo 0 0 0 0 0 0 0 0 lil' 00 0 0 0 0 0 0
0 0
3 0 oo
0
Oo 0 0
0 0
I
0 0
0 0
0
2 0
F
0 50 100
urban rdgc = 741.045 + 17.120 urban
r' = 0.429 RMSE = 493.194 n = 96
0
3000
~
-0 0 0
0
0 0 0
0
2000 co 0 0
0 0 0 0 0 0
0 0 0
0 0
"' 0 0 0 oo
0 0 0
"'
0 00 0 0 00 0o 0 0 0
0 0 0 0 0 0 0
1000 0 00 0
0 0 0
"'
0 0 0 0 0 0
g @@
0 0 0 0 oo 0 0 0
0
0 0
0 50 100
The RD varied by level of publicly supported STD services offered in a
county. The lowest mean RD was found in counties that provided STD services
integrated with other public health services (RD = I, 114 cases) as compared to
those with full-time (1,897 cases) and part-time STD clinics (2,464 cases). The
~-RR did not vary as widely as RD with the level of services offered (38.5, 33.1, and 31.5, respectively).
The RD was highly correlated with IR of gonorrhea among blacks (>0.99),
but RR was less so (0.30) (Figure 3).
The county 5-year average incidence rates of gonorrhea among whites fell
in a narrower range [(6.21- 145.0 cases/100,000 person-years (p-y)] and were
substantially lower than (mean= 44.4) average rates among blacks (range
0-3252.8; mean= 1271.9; median= 1263.4 cases/100,000 p-y). The overall 5-year
average incidence rates ranged from I 0.6- 1531.4 with a mean of 327.9 and a median of293.3 cases/100,000 p-y.
Further, we observed that RR was not appreciably correlated with overall rates, but RD was positively correlated with overall rates (Figure 4).
I
Figure 3. Correlation of gonorrhea incidence rate among blacks with black-white
gonorrhea incidence rate ratio (top) and with incidence rate difference (bottom),
5 4 0 rn
"
"
3 2 3000 2000 1000 0North Carolina, 1990 -1994.
lnrrgc = 3.116 + 0.000 blackgc
r" = 0.089 RMSE= 0.430 n = 95
0 0 0 0
B 0 0
0 0 0 d'o o 0
0 0 0 Q,O 0 0 0 8
00 • 0 0
8 o0 o oo'"c, 0
""
0 0 0 0
00
0
0
0 0
0 1000
rdgc = -10.095 + 0.973 blackgc
r"-=0.999 RMSE=19.117 n=96
0 1000
0 0 & 0 0 0 0 0 0 0 0
0 0 0 0 0 0 2000 blackgc 2000 blackgc 0 0 0 0 0
0 0
3000 4000
3000 4000
I
r---L
~
~
i
ll!l!"
I
Figure 4. Correlation of overall gonorrhea incidence rates with black-white
gonorrhea incidence rate ratio (top) and with incidence rate difference (bottom), North Carolina, 1990 -1994.
~-lnrrgc = 3.352 + 0.000 overallgc
r' = 0.002 RMSE = 0.450 n = 95
51
0 0
0 0 0 0 0
4 0 0
ooo 0 0 0
"'
0 0"
0 0 0"' 0 0 0"' ® 0 0 0 0 0
~ @ 0 0 0
oo
~ 0 o 0
o
-"
0 !Jo'Bo 0 O'W 0 0 0 0 0 0 0 0
oO 0 0 0
3 0 0 0 0
8 0 0
00 0
0 0 0
0
0 2
0 500 1000 1500
overallgc
.
rdgc = 672.223 + 1.596 overallgc !
r' = 0.469 RMSE = 475.804 n = 96
L
~~
0 r
'
3000
0 0
0
0 0 0 0
0
2000 0 0 o o
oO 0 o o
0 0
"
0 0"'
0 0 d' 00 0 0
0:: 0
0 0 0 0 0
0 0
"'
0 00 0 0 0
0 "/, 0
1000 0 0 0 oo '6
oo 0
0 0 0 0 0 0 Oo 0 o
0o od?o 0 0 0 0
&0 0 o o 0
0 0 I ..
0 500 1000 1500
overallgc
b
DISCUSSION
L
The main finding of this study is that several community-level variables were correlated with absolute racial disparity (RD ), but not with relative disparity (RR), in gonorrhea in NC during 1990-1994. This is likely due to the fact that the RD was almost completely dependent upon the rates of gonorrhea in the black population, and correlation between the variables and RD was indicative of correlation between the variables and gonorrhea rates in the black population. These findings have implications for the design and evaluation of public health interventions aimed at reducing racial disparity in STDs.
As we expected, our results demonstrated profound racial disparity in
~
gonorrhea incidence rates inNC during the first half of the 1990's. Wei
hypothesized that several of the variables we examined would be correlated with ! disparity in gonorrhea, and with regard to RD, that was the case. With the
exception of male-to-female sex ratio, all variables were correlated more strongly with RD than with RR: eight of them with correlation coefficients of 0.2 or greater.
The explanation for this observation appears to lie almost entirely in the observation that RD was nearly perfectly positively correlated (>0.99) with gonorrhea incidence rates among blacks. This indicates that the rates among whites I) varied little between counties compared to black rates and 2) in comparison to black rates, these rates were essentially negligible. Because the
and had a substantially greater range than rates among whites, the rates among
blacks had a much greater impact on RD than rates among whites.
It is not clear, however, why the rates among blacks were more strongly
correlated with RD than log-transformed RR. The log transformation ofRR using
log base e22 (In) converts the multiplicative measure to an arithmetic one. Further
explanation of these data and similar sets will be needed to more fully understand
this relationship.
Methodological Implications
Focusing on one measure of disparity to the exclusion of the other when
evaluating racial disparities can create an incomplete picture of the nature of
disparity. Rate and risk ratios tend to be favored among medical and public health
personnel when comparing disease rates between two populations, but it must be
recognized that seemingly immense values of these multiplicative measures can
arise from modest differences in disease rates. As Walter noted, it may be useful
to differentiate between the choice of measure used for purposes of analysis as
compared to the choice of measure used to communicate risk [24]. We focus here
on the choice of measure for analysis purposes.
The results of the present study support the argument that RD should be
the focus of public health work aimed at reducing racial disparities in gonorrhea in
NC. A number of authors have reasoned that absolute measures of effect are more
important than relative measures in clinical and public health decision-making [5,
25-28). They argue that an absolute measure such as RD is a more meaningful
measure of risk since it represents the actual additional probability of disease due to the risk factor and indicates what proportion of cases can be reduced by
targeting the risk factor. Measures of disparity differ from measures of effect in
that there is no assumption that the factor of interest, race in this study, is an .__ L etiologic factor in the disease.
The primary goal of disparities work is to reduce the rates of disease in the disproportionately affected population to the point that they are equal to those in the reference population. We have shown that, in a situation where racial disparity in rates of a disease is substantial, the RD is more reflective of what is occurring in the disproportionately affected population than the RR.
Emphasizing reduction in absolute measures of disparity, rather than relative ones, may better serve the goals of reducing disparities.
Policy Implications
In order to effectively decrease county gonorrhea rates in NC, we must aim to reduce rates in the black population. Our results indicate that reduction of rates in the black population and concurrent reductions in overall disease rates are
likely to result in decreased absolute disparities. When selecting counties for
f
implementation of interventions aimed at reducing racial disparities in gonorrheat
and other STDs, researchers and other public health workers should primarilyFormer US Surgeon General David Satcher and others promote the idea of targeting the health needs of the most vulnerable populations [2]. Working to reduce disparities necessitates improvement of the public health system to deliver services to disproportionately affected populations. Such improvements generally benefit the health of the entire population.
Public health resources would be targeted differently depending upon whether RD or RR was the measure used in designing interventions to reduce racial disparity in gonorrhea in NC. A rank ordering ofNC counties on the basis of RR and RD reveals that only 8 counties rank in the top quartile (24 counties) for both measures. Thirteen counties in the top quartile for RD are among the top quartile for overall rates of gonorrhea, whereas only 7 in the top quartile for RR are. All of the top 5 counties rank ordered by RD are among the top quartile for overall rates while none of the top 5 RR counties are. All of the top counties for RD rank in the top quartile for rates among blacks, compared to 8 of the top RR counties. Similarly, 15 of the RD counties rank amongst the highest rates among whites whereas only 2 of the RR counties do.
Clearly, if our aim is to reduce racial disparities in gonorrhea in NC, we should first focus upon the eight counties that rank in the top quartile for both measures. Beyond those eight, our resources would be better devoted toward reducing disparities and overall rates of disease in the counties in the top quartile for RD, because these counties have higher overall rates and higher rates among blacks.
23
L
I
t
r
L
.
r:-b
!
!
Context of Previous Work
~-The question of this study was different than previous studies of disparity and studies of community-level predictors for STDs. We studied potential
predictors of disparity. To our knowledge, this issue has not been addressed ~-previously. Our results showed that the predictors of disparity in our study were
most likely such because they were predictors of high rates in the disparately affected population.
Our findings regarding predictors for high population rates of gonorrhea supported the work of several others [12-18]. The results showing positive correlations between increasing black residential isolation and increasing income dualism and population rates of gonorrhea lend further support to the work of Gaffield and Thomas [15].
Urban residence is a known risk factor for sexually transmitted diseases. One possible reason behind this association is higher concentration of poverty in urban areas. Low income blacks are more likely to be concentrated into urban high poverty neighborhoods than are poor whites, and, in turn, in areas of lower education and higher drug use (29). This may explain in part the relationship between increasing urbanization and racial disparity in gonorrhea in NC counties. Youthful age composition and sex ratio of less than one are two factors known to increase the incidence of certain STDs, and both are seen to a greater extent among blacks than among other minorities and whites (30).
unequal access to education, job opportunities, and health services. Sexual networks tend to be relatively homogenous in terms of race and socioeconomic status, and residential segregation may enhance the separation of black and white sexual networks. When prevalence of an STD is higher one sexual network compared to another, incidence will be higher in the population with higher disease prevalence as a result. Income dualism may be correlated with disparity in gonorrhea in a similar fashion because it leads to increased economic/class separation of black and white sexual networks.
The relationship we observed between the level of publicly funded SID services and racial disparity in gonorrhea is unlikely to be causal. It may be explained by a combination of several factors. First, personnel in full-time and part-time clinics may be more likely to report diagnosed cases of gonorrhea than personnel whose services are not dedicated entirely to STD care. Second, large counties with stable, high rates of gonorrhea and other STDs may be more likely to establish dedicated SID clinics than counties with lower rates. However, one causal explanation of the observed relationship is a stigma resulting from SID clinics noticeably separated from other health department services. Patients may be less likely to seek care when they perceive an increased likelihood of being identified to others around them as patients in the SID clinics, and this is more likely for patients of a STD clinic that is separated from other public health services. Black individuals are more likely than whites to delay care seeking for STDs and to self-treat SID symptoms [31]. This, exacerbated by stigma of a
25
'
I
L
b
~--i
f
'
I
F f
distinctive STD clinic, could potentially translate into greater racial disparity in gonorrhea in counties with full-time and part-time STD clinics.
Two unexpected findings we encountered in this study were that 1) counties with greater proportion of the population with a high school degree tended to have higher RD and RR and 2) that increased percent living below poverty was correlated with decreases in both measures. These variables were not examined in race-specific terms, (i.e. we did not look at the percent of the black population with high school degrees or living below poverty). Race-specific values of these measures may have been differently associated with disparity, particularly if those differed substantially from the values in the general
population. If that were the case, information may have been obscured by looking only at overall county values of these variables.
Challenges
These results may support conclusions other than those we have described here. One challenge to these data is that the labels of"black" and "white" may be essentially useless, serving only as proxies for another more important, yet
unknown variable that we did not measure. Clearly, the relationship between race and disease is infinitely more complex than what has been touched upon herein. With this study we intended to use the race measures as a fairly crude way of beginning to generate information about racial disparities in gonorrhea rates.
We chose not to weight the analyses despite wide variation in population sizes across NC counties. When using ecological data collected from populations
1--L
'
l
r
b
F
I
I
of different sizes, researchers often weight the analyses by populations of those areas with the implicit assumption that more populous areas contribute more information about the relationship of interest than less populous ones. However, less populated counties do not necessarily contribute less information than more populated counties about the relationships between demographic variables and racial disparity in STDs. There is no reason to assume, a priori, that larger counties offer more worthy information that more closely approximates hypothetically "true" relationships in North Carolina. Another argument for weighting is based on the representativeness of the sample. When an analysis is based on an entire population, this argument is less relevant. This analysis was focused on a disease with mandated reporting. Therefore, the rates we analyzed are the best estimates for the entire population rather than a sample of a larger population.
Frohlich and colleagues analyzed the effects of weighting on conclusions regarding entitlements to primary physician services in Manitoba, Canada [32]. They demonstrated that weighting the analysis biased entitlements toward the more advantaged and populous regions. The authors outlined criteria under which unweighted analyses may be more appropriate. Two primary situations in which unweighted analyses may be more appropriates are 1) when one is interested in ecological relationships and not interested in making individual level inferences and 2) when the units of aggregation "make sense" as units.
Several of our variables, such as disparity and income dualism, cannot be logically described at the individual level. Though the boundaries of counties can
be somewhat arbitrary, they do have characteristics that can affect STD outcomes. For instance, publicly funded STD services are delivered by county health
departments. This is a common issue encountered in ecological analysis, as the sociological meaning of census blocks, tracts, counties and states can be
debatable.
Initiatives aimed primarily at reducing disparities are not without their critics. Scanlan has written several articles arguing against focusing resources primarily on reducing disparities, which he believes reflects a fundamental misunderstanding of a statistical reality [33-35]. He emphasizes the following principle: "whenever two groups differ in their susceptibility to some condition, the less prevalent the condition, the greater will tend to be the disparity in rates of experiencing this condition." Scanlan makes the point that disparity tends to increase with decreasing overall rates of disease. The less prevalent a condition becomes, the larger proportion of the affected population will be comprised by the more susceptible group. However, he uses the term "disparity" synonomously with disparity quantified by relative measures [33]. He does not address the use of absolute differences as a target for disparities reduction programs.
that counties with low rates of gonorrhea in the black population tended to have low overall rates of gonorrhea.
Limitations and Suggestions for Future Work
Many of the relationships we found in the present study are worthy of further investigation. This was a retrospective, cross-sectional analysis, and as such, we are somewhat limited in my interpretation of the results arising from it. Larger studies of community-level predictors for disparity, such as one involving the entire southeastern United States, should be completed. Nonetheless, this study provides preliminary information about the nature of disparity in gonorrhea inNC.
The results of this study have limited generalizability to other health conditions with racial disparity in diseases rates. Incidence rates of gonorrhea are extremely low in whites compared to blacks. Diseases such as diabetes, cardiac disease, and hypertension, on the other hand, are common in white and minority populations. The strong correlation between incidence rates of gonorrhea among blacks in NC and RD may not be reproduced with diseases more commonly affecting whites. The methodology of this study could be applied to other diseases with racial disparity in incidence rates. Analysis of disparity in diseases with higher incidence and prevalence rates than the STDs, such as hypertension, diabetes and cardiac disease, would provide more stable rates of disease for study.
This was a cross-sectional study and we did not examine trends in the relationships between the predictor variables and gonorrhea disparity over time.
Our study question related only to a specific point in time. Several questions
worthy of further analysis arise from this study, such as whether the relationships
we found exist with other diseases, whether these correlation are also valid for NC
during the latter half of the 1990s, or whether they apply in other geographical
areas. The relationships between measures of interracial dynamics, such as
income duality and residential isolation, on disparity in STDs other than
gonorrhea, as well as non-infectious diseases deserve further study.
Summary
Our results demonstrate that several county-level demographic variables
are associated with absolute disparity in gonorrhea incidence between blacks and
whites as measured by incidence rate difference. These correlations are largely
explained by the observation that incidence rates of gonorrhea among the black
population are almost perfectly correlated with rate difference. Placing emphasis
upon absolute measures of disparity, rather than relative ones, in planning and
evaluation of interventions aimed at reducing racial disparities may better serve
ACKNOWLEDGEMENTS
I gratefully acknowledge James C. Thomas, Ph.D., for many hours spent mentoring me in this work, Jay Kaufman, Ph.D. for his insight and contributions in interpreting my results, Joanne Garrett, Ph.D. and Charles Poole, M.P .H, Sc.D. for statistical input, MaryLyn Gaffield, Ph.D. and Sara Stratton for provision of data on gonorrhea rates, level of STD services, and residential isolation, and Francois Nielsen, Ph.D. for calculation of the income dualism measure.
REFERENCES
1. US Department of Health and Human Services. Healthy People 2010: Understanding and Improving Health. Washington, DC: US Department of Health and Human Services; 2000.
2. Mitka M. US Surgeon General David Satcher, MD, PhD. JAMA, 1998; 280:590-1.
3. Stevens J, Cai J, Juhaeri, eta!. Consequences of the use of different measures of effect to determine the impact of age on the association between obesity and mortality. Am J Epidemiol, 1999; 150:399-407.
4. Hennekens C, Mayrent S, Buring J. Epidemiological aspects of aging, mortality and smoking. In: Bosse R, Rose C, editors. Smoking and aging. Lexington, MA: Lexington Books; 1984. p. 117-29.
5. Rose G. Strategy of prevention: lessons from cardiovascular disease. BMJ 1981; 282:1847-51.
6. Mann JI. Oral contraceptives and the cardiovascular risk. In: Oliver MF, editor. Coronary heart disease in young women. Edinburgh: Churchill Livingstone; 1978. p.184-94.
7. Office of Minority Health. Assessment of State Minority Health Infrastructure and Capacity to Address Issues of Health Disparity. Washington, DC: U.S. Department of Health and Human Services; 200 I.
9. United Health Foundation. America's Health: United Health Foundation State Health Rankings, 200 I. Available on:
http://www. unitedhealthfoundation.org/rankings200 I /index.html. I 0. CDC, Division of STD Prevention. Sexually Transmitted Disease
Surveillance, 1999. Atlanta: U.S. Department of Health and Human Services; 2000.
II. HIV/STD Prevention and Care Branch, Division of Public Health. North Carolina 2000 STD Surveillance Report. Raleigh: N.C. Department of Health and Human Services; 2001.
12. Cohen D, SpearS, Scribner R, eta!. "Broken Windows" and the risk of gonorrhea. Am J Public Health 2000; 90:230-236.
13. Ellen J, Hessol N, Kohn R, et a!. An investigation of geographic clustering of repeat cases of gonorrhea and chlamydia! infection in San Francisco, 1989-1993: evidence for core groups. J Infect Dis, 1997; 175:1519-1522.
14. Fox KK, Whittington WL, Levine WC, eta!. Gonorrhea in the United States, 1981-1996: demographic and geographic trends. Sex Transm Dis 1998; 386-392.
15. Gaffield ME, Thomas JC. Community characteristics and gonorrhea rates in the southeastern United States. Ethnicity and Health 2001, in press.
16. Laumann EO, Y oum Y. Racial/ethnic group differences in the prevalence of sexually transmitted diseases in the United States: A network explanation. Sex Transm Dis 1999; 26:250-261.
17. Rice RJ, Roberts PL, Handsfield HH, eta!. Sociodemographic distribution of gonorrhea incidence: implications for prevention and behavioral research. Am J Public Health 1991; 81(10):1252-1258.
18. Thomas JC, Shoenbach VJ, Weiner DH, et al. Rural gonorrhea in the southeastern United States: a neglected epidemic? Am J Epidemiol 1996, 143(3):269-76.
19. Lansky A, Thomas JC, Earp JA. Diagnosis and reporting of sexually transmitted disease in Durham County, North Carolina. NC Med J, 1992; 53:427-30.
20. NC State Demographics Center, LINC (Log Into North Carolina) web resource. Available on: http://linc.state.nc.us/.
21. US Bureau of the Census. Census of Population and Housing, 1990: Summary Tape File 3 [Access tool available at
http://homer.ssd.census.gov/cdrom/lookup]. Washington, DC: Bureau of the Census, 1991.
22. Massey DS, Denton NA. The dimensions of residential segregation. Social Forces, 1988; 67:281-315.
23. Nielsen, Fran9ois and Charles S. Warren. Patterns oflncome Inequality in North Carolina, 1980. Sociological Analysis, 1998; 1(3):87-112.
25. Fletcher, RH. Comparing risks. In: Fletcher RH, Fletcher SW, Wagner EH,
editors. Clinical epidemiology: the essentials. 2"ct ed. Williams & Wilkins: Baltimore; 1996. p. 101-105.
26. Malenka DJ, Baron JA. Cholesterol and coronary heart disease: the
importance of patient-specific attributable risk. Arch Intern Med, 1988;
148:2247-2252.
27. Sackett DL. Deciding on best therapy. In: Sackett, DL, Haynes RB, Tugwell
P, Guyatt GH, editors. Clinical epidemiology: a basic science for clinical
medicine. Boston: Little, Brown and Company; 2000. p. 198-206.
28. Valanis B. Measures of risk. In: Valanis B, editor. Epidemiology in Health
Care. 3'ct ed. Portland, OR: Prentice Hall; 1999. p. 72-74.
29. Williams DR, Collins C. Racial residential segregation: a fundamental cause
of racial disparities in health. Public Health Rep, 2001; 116:404-416.
30. Aral SO, Wasserheit JN. Interactions among HIV, other sexually transmitted
diseases, socioeconomic status, and poverty in women. In: 0 'Leary A,
Jemmott LS, editors. Women at Risk: Issues in the Primary Prevention of
AIDS. New York: Plenum Press; 1995. p. 13-40.
31. Irwin DE, Thomas JC, Spitters, CE, eta!. Self-treatment patterns among
clients attending sexually transmitted disease clinics and the effects of
self-treatment on STD symptom duration. Sex Transm Dis 1997; 24:327-329.
32. Frohlich N, Carriere KC, Potvin L, eta!. Assessing socioeconomic effects on
different sized populations: to weight or not to weight? J Epidemiol
Community Health, 2001; 55:913-920.
33. Scanlan JP. Race and mortality. Society, 2000(January/February): p. 1-10. 34. Scanlan JP. Divining difference. Chance, 1994; 4:38-39.
3 5. Scanlan JP. The perils of provocative statistics. The Public Interest, 1991; I 02:3-14.
L t