Sharif University of Technology
Scientia IranicaTransactions A: Civil Engineering http://scientiairanica.sharif.edu
Choice of optimum combination of construction
machinery using modied advanced programmatic risk
analysis and management model
M. Zeynalian
and I. Kalantari Dehaghi
Department of Civil Engineering, University of Isfahan, Isfahan, 81746-73441, Iran.
Received 24 November 2015; received in revised form 2 November 2016; accepted 19 December 2016
KEYWORDS Risk management; Construction management; Machinery combination; Subway project; Environmental impacts.
Abstract. Since the proper use of construction machinery in infrastructure projects is important, it is essential to employ an optimum selection of machinery in these projects. Advanced Programmatic Risk Analysis and Management model (APRAM) is one of the recently developed methods that can be used for risk analysis and management purposes considering schedule, cost, and quality, simultaneously. In this paper, the APRAM method is rst introduced and then modied in order to consider environmental risks. This method can consider potential risks that might occur over the entire life cycle of the project, and can be employed as an ecient decision-support tool for construction managers selecting machinery for an infrastructure project where various alternatives might be technically feasible. A case study of 3 possible combinations of excavation machines is then discussed. All project risks related to cost, time, quality, and environment are identied considering the capital costs which should be spent on each combination. Finally, some graphs, which are derived from the method, are taken into account in order to decrease the risks of each combination and optimize the selection of excavating machinery. The outcomes highlight the eciency of the APRAM model for the optimal selection of machinery in construction projects.
© 2018 Sharif University of Technology. All rights reserved.
1. Introduction
Construction machinery plays a signicant role in the choice of construction style, and in the overall cost and time of a project. Hence, an optimum selection of machinery is a matter of great importance. Construc-tion machines bear several risks and it is essential to apply risk management techniques for their optimized selection. Taking into account the various conditions of a construction project, such as economic issues, *. Corresponding author.
E-mail addresses: [email protected] (M. Zeynalian); [email protected] (I. Kalantari Dehaghi)
doi: 10.24200/sci.2017.4197
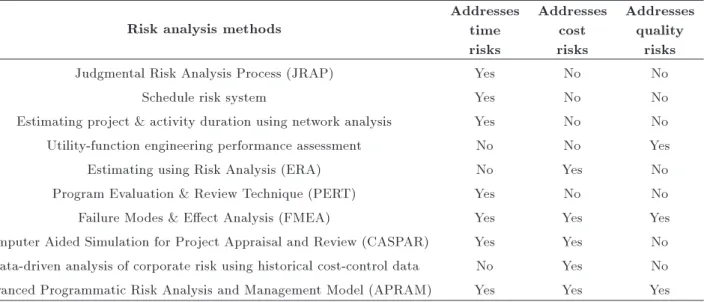
managing policies, etc., and investigating the plausible risks (which are mostly a matter of time, costs, and quality) are of fundamental importance. Therefore, having an appropriate technique for risk analysis and management that can cover dierent combinations of risks in construction, while simultaneously minimizing the risks of project failure, is quite necessary consider-ing cost, time, and quality. There are a variety of meth-ods available for use in the analysis and management of risks in the construction industry [1-3]. However, most of these techniques address either those risks relating only to cost, schedule, and structural reliability individually, or those relating to a combination of cost and schedule risks [4]. Table 1 summarizes various methods that have been developed for use in the risk management of construction.
Table 1. Some risk analysis methods and addressed risks. Risk analysis methods
Addresses time risks
Addresses cost risks
Addresses quality
risks
Judgmental Risk Analysis Process (JRAP) Yes No No
Schedule risk system Yes No No
Estimating project & activity duration using network analysis Yes No No Utility-function engineering performance assessment No No Yes
Estimating using Risk Analysis (ERA) No Yes No
Program Evaluation & Review Technique (PERT) Yes No No
Failure Modes & Eect Analysis (FMEA) Yes Yes Yes
Computer Aided Simulation for Project Appraisal and Review (CASPAR) Yes Yes No Data-driven analysis of corporate risk using historical cost-control data No Yes No Advanced Programmatic Risk Analysis and Management Model (APRAM) Yes Yes Yes
As stipulated in the table, these methods are limited to addressing risks relating only to cost, time, or technical performance individually or, at best, a combination of cost and time risks; the exception is FMEA, which addresses cost, time, and quality together. However, it should be mentioned that FMEA is based on ordinal, rather than cardinal, scales. That is, the dierent possible failure events are ranked, but the dierences between the rankings for any two possible failure events are not proportional to their risks. For example, the risk due to a potential failure event given an FMEA score of 10 (on the standard 1-10 scale) is not necessarily twice as high as the risk from a potential failure event given a score of 5. Without a cardinal scale, that is a scale in which scores are proportional to risk, FMEA does not provide a sound basis for allocating resources to manage risk [4].
The construction machinery required for any project carries several dierent risks, including cost, schedule, quality, and environmental issues. The Ad-vanced Programmatic Risk Analysis and Management model (APRAM) is an example of a decision-support framework that can be useful for the risk analysis and management of a project. APRAM can address cost, schedule, and quality failure risks, simultaneously [5,6]. While the original APRAM takes into account only those risks that occur over the design and construction phases of the project's life cycle, the modied APRAM employed in this paper addresses the project's failure risks over the whole life cycle of the project, including the operation and maintenance phases [7]. However, this method still needs further improvement as it does not cover environmental risks. Hence, this study rst develops the APRAM model in order to address the environmental failure risks. This developed model is then applied to an optimal combination of machines in construction projects. For the purpose of conducting
a case study, 3 combinations of machines, which have been used in excavation and digging projects in one of Isfahan's subway stations, are investigated (Isfahan Subway Organization, 2013-14).
2. Construction machinery risks
Four types of risks can generally be identied in the construction machinery. The rst type of risks is related to cost, and can simply be described in terms of a project exceeding its budget. Rydeen [8] mentions overlooked budget items, poor management, unfore-seen site conditions, and inaccurate cost estimates as some of the factors that contribute to budget overruns in construction projects. The second type of risk deals with time, that is, the inability to complete the project within a specied duration. Mulholland and Christian [9] in their study on risk assessment in construction schedules mentioned excessive change orders, poor communication between disciplines, poor planning, incompetent management, and poor manage-ment controls as some of the causes of schedule overrun. The third risk is design related, that is, risk related to the technical characteristics of the project. The technical characteristics depend on the construction type and execution time, as well as the construction environment [10]. This leads to a dierent risk manage-ment scenario for each project. The fourth type of risk is the one related to environmental damage caused by machines. The growing signicance of environmental issues in the current industrial world urges the need for investigating this type of issues. This risk manifests external expenses, harm to people's health, damage to the ecosystem, issues of handling materials, and eects on agricultural products. Generally, the machinery risks aect the project's aims and may cause setbacks in the project's timely completion [11].
3. Advanced Programmatic Risk Analysis and Management model (APRAM)
APRAM can be used by project managers to identify 3 sequential optimization steps [12]. The rst step is to identify all feasible alternatives, considering the budgets that can be spent on the project, in order to minimize the technical Probability of Failure (PF) for each alternative. The minimum cost set for each technical design alternative and its appropriate residual budget are then identied. The residual budget refers to the dierence between the total project budget and the minimum cost of each alternative. In the second step, managerial risks over the available range of the potential reserve budget should be identied and then minimized for each alternative by using appropriate optimization strategies.
The nal step is the determination of the optimum technical design alternative, considering technical, managerial, and environmental risks. Each technical design alternative may need a dierent portion of the residual budget, through trade-os between technical, managerial, and environmental failure risks based on the preferences of the decision maker(s). Finally, project managers need to choose the alternative that oers the best value, considering the probabilities of various failures of the project and the associated failure costs. If this is not satisfactory, the allocated resource should be increased until the selected alternative meets the threshold of acceptability. Figure 1 shows the steps and sub-steps involved in the implementation of APRAM.
4. Total budget of project
The entrepreneur(s) or the organization manager(s) determine the project budget before it is launched. One
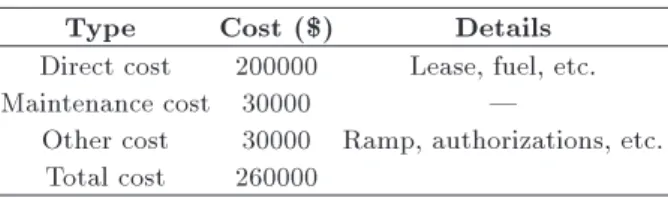
Table 2. Summary of total budget.
Type Cost ($) Details
Direct cost 200000 Lease, fuel, etc.
Maintenance cost 30000 |
Other cost 30000 Ramp, authorizations, etc. Total cost 260000
of the important parts of a construction project, which has a signicant role in the project's budget, is the implementation of machinery and equipment. In this research study, for the purpose of conducting a case study, 3 combinations of construction machineries used in excavation and digging projects in one of Isfahan's subway stations are investigated. The total budget allocated for the project is shown in Table 2. The information is extracted from the annual reports of the municipal Isfahan Subway Organization (ISO) (Isfahan Subway Organization, 2013-14).
5. Implementation of APRAM
5.1. Identication of possible alternatives The rst step in a planned risk analysis is to select all machinery combinations that are technically suitable for the target project. Each machine is designed for a special operation and should be chosen according to the project. Lack of harmony between the machine and the operation would lead to sub-optimal eciency, and could damage the machines in addition to causing additional expense. Hence, regarding the limitations and requirements of the project, the project's budget, schedule, and location, several construction machinery combinations would ordinarily be investigated before one of them is chosen.
In this study, 3 potential combinations for the excavation and digging of the subway projects are identied by the experts and engineers taking part in
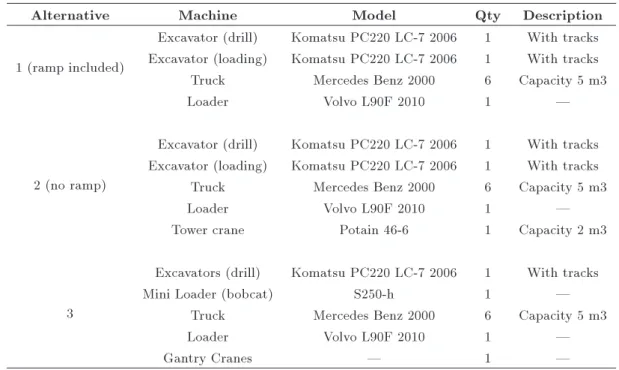
Table 3. Details of the machinery used in the possible alternatives.
Alternative Machine Model Qty Description
1 (ramp included)
Excavator (drill) Komatsu PC220 LC-7 2006 1 With tracks Excavator (loading) Komatsu PC220 LC-7 2006 1 With tracks Truck Mercedes Benz 2000 6 Capacity 5 m3
Loader Volvo L90F 2010 1 |
2 (no ramp)
Excavator (drill) Komatsu PC220 LC-7 2006 1 With tracks Excavator (loading) Komatsu PC220 LC-7 2006 1 With tracks Truck Mercedes Benz 2000 6 Capacity 5 m3
Loader Volvo L90F 2010 1 |
Tower crane Potain 46-6 1 Capacity 2 m3
3
Excavators (drill) Komatsu PC220 LC-7 2006 1 With tracks
Mini Loader (bobcat) S250-h 1 |
Truck Mercedes Benz 2000 6 Capacity 5 m3
Loader Volvo L90F 2010 1 |
Gantry Cranes | 1 |
a Delphi method [13] survey. Also, the Delphi method is employed in order to identify all the plausible risks needed for assessing, optimizing, and selecting the opti-mal combination of machines. The Delphi method is a decision-making technique for collecting and classifying the knowledge possessed by a group of experts. This method is implemented through using questionnaires, controlled feedback of the received answers and ideas, and conducting repetitive surveys in several phases. In Alternative 1, the digging operations are performed by 2 excavators, and the soil is loaded into Trucks by a Loader. Then, the soil is carried out to the specied place. In this method, it is necessary to make an access ramp. To do so, digging and stabilizing operations are performed rst, and then embarking (or blockage) is carried out. In Alternative 2, after digging operations, soil is carried out by a tower crane without a ramp. After disembarkation, the soil is loaded to the trucks again by a loader and is carried to the given place. In Alternative 3, the digging operations and soil moving are completed with an excavator and a Bobcat mini-loader. In this case, there is no need to make a ramp. Soil transfer is performed in 2 phases via a gantry crane, a loader, and a truck. Table 3 shows details of the machinery.
5.2. Identifying minimum cost and residual budget for each alternative
After assigning the potential machinery combination alternatives, the corresponding costs for each alterna-tive are estimated by the machinery experts at ISO. This leads to the calculation of the total project cost, which is called the development cost of each alternative. The Residual Budget (RB) for each alternative is then evaluated by calculating the dierence between the initial Total project Budget (TB) and the total cost of construction development (DevCost). Table 4 illustrates these features.
6. Risk of construction machinery
As mentioned earlier, the Delphi method was em-ployed, incorporating 12 experts, mainly in 3 groups, including 7 engineers, 3 directors of ISO, and 2 ma-chinery experts. The minimum educational degree of each group was BSc, MSc, and technical diploma, respectively; also, the average professional experiences of the groups were 14, 21, and 23 years, respectively. It is necessary to mention that all managerial risks, which refer to time and costs, and technical and environmental risks during the design and operation
Table 4. Alternatives' DevCosts, TB, and RB (in US Dollars).
Alternative Cost DevCost TB RB
Lease Fuel Other
1 153141 18309 74473 245923 260000 14077 2 206289 26309 6666 239265 260000 20735 3 207639 24529 6666 238835 260000 21165
phases, are identied and their probabilities of failure are evaluated using the Delphi method as well.
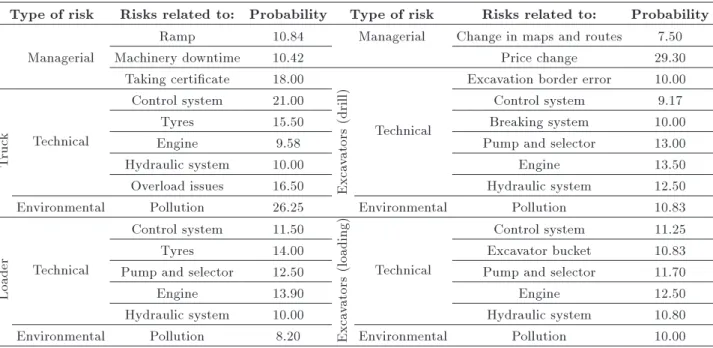
For this purpose, rst, a questionnaire was an-swered anonymously and individually by each expert. Then, the answers were summarized and sent back to all members along with the next questionnaire. This time, the respondents were asked to give each failure event a validity score from 0 to 10. Next, graphs summarizing the results were again sent back to the respondents. They were asked to reassess their previous answers and the same questions were asked. After that, summaries of the answers were sent to all group members showing the mean and standard deviation. The respondents were asked to re-evaluate all new assumptions revealed in round two as well as the assumptions in round one that had a large standard deviation, and to assign a validity score, again. In the next step, the nal failure risk events were nalized based on the results. The same process was performed in order to calculate the associated probabilities of failures. After 3 iterations, the nal values for probabilities of failures had a good agreement among the whole group with a standard deviation of less than 20%. As an example, the risks of Alternative 1 are presented in Table 5.
It is worth noting that all risks can be categorized as partial or total risks. Total risks are those failures which happen in machinery and which cause failure in the whole project. Indeed, if partial risks become actual events, the machinery can remain active and the project continues, but at a degraded level of functionality. The managerial risks include the prob-abilities that the project cannot be completed within the assigned budget and provided timetable. Current
evidence suggests that construction machinery projects are usually accomplished, even though there are often considerable cost and time overruns. Therefore, no Total Managerial Failures (TMF) are considered in this study and all identied managerial failure risks are categorized as Partial Managerial Failures (PMF). The same has been assumed for environmental failure events, which are considered Partial Environmental Failures (PEF), since it is expected that these failures would not aect the overall performance of the project. Appropriate trade-os between these failure risks are essential for achieving the optimum performance of the building. For example, spending more time and money on design to reduce the technical failure risks may increase the probability of management failure by cost and time overruns. The project risks are illustrated in Figure 2.
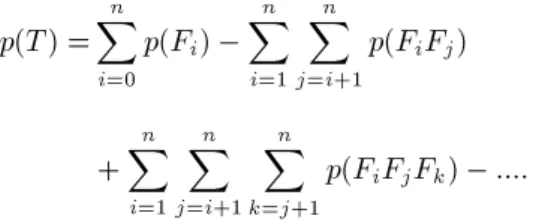
The risk probabilities of total failure and of par-tial technical, managerial, and environmental failure are calculated based on the fault-tree models using Eq. (1) [14], assuming that all basic identied risk events are independent. Appropriate trade-os be-tween these failure risks are essential to achieve the optimum performance of the construction machinery project:
Figure 2. Construction machinery risks. Table 5. Potential risks and probability of failure risks for Alternative 1.
Type of risk Risks related to: Probability Type of risk Risks related to: Probability Ramp 10.84 Managerial Change in maps and routes 7.50
Managerial Machinery downtime 10.42 Price change 29.30
Taking certicate 18.00
Technical
Excavation border error 10.00
T
ruc
k Technical
Control system 21.00
Exca
vators
(drill)
Control system 9.17
Tyres 15.50 Breaking system 10.00
Engine 9.58 Pump and selector 13.00
Hydraulic system 10.00 Engine 13.50
Overload issues 16.50 Hydraulic system 12.50
Environmental Pollution 26.25 Environmental Pollution 10.83
Loader
Technical
Control system 11.50
Exca
vators
(loading) Technical
Control system 11.25
Tyres 14.00 Excavator bucket 10.83
Pump and selector 12.50 Pump and selector 11.70
Engine 13.90 Engine 12.50
Hydraulic system 10.00 Hydraulic system 10.80
p(T ) =
n
X
i=0
p(Fi) n
X
i=1 n
X
j=i+1
p(FiFj)
+
n
X
i=1 n
X
j=i+1 n
X
k=j+1
p(FiFjFk) :::: (1)
As the next step, the decreasing probability of existing risks, based on the spent residual budget, will be determined through Eqs. (2) to (4) [15]:
p(FijTechrein) = p0(FijTechrein) Exp[ Ks]; (2)
p(FijMgmtrein) = p0(FijMgmtrein) Exp[ Ks]; (3)
p(FijEnmtrein) = p0(FijEnmtrein) Exp[ Ks]; (4)
where is the portion of the residual budget that can be used as investment to improve the probability of failure for risk event, Fi, and is always between 0 and
1; and Ks is assessable constant. Using the equations,
the risks would be eliminated by spending percent of the residual budget. As an example, Table 6 and Figure 3 illustrate the eects of investments on risk
Figure 3. Probabilities of dierent managerial failures versus fractions of RB for Alternative 1.
Table 6. Eects of investment on managerial PF in Alternative 1.
Risks related to: p0(FijMgmtrein)
Ramp 0:108 Exp( 2:285 )
Machinery downtime 0:104 Exp( 2:447 ) Taking certicate 0:18 Exp( 1:861 ) Change in maps and routes 0:075 Exp( 1:373 )
Price change 0:293 Exp( 2:097 )
reductions for managerial probabilities of failure events of Alternative 1. The risks' exponential functions are derived using Excel software. This is based on data that were obtained by interviews with experts at ISO. Based on the graph, one can interpolate the requested information.
7. Cost of construction machinery risks 7.1. Cost of technical and managerial risks In this section, the costs of all technical and managerial risks for 3 alternatives are evaluated utilizing ques-tionnaires, which were lled out by machinery project experts. The results are shown in Table 7.
7.2. Cost of environmental risks
In this section, the amount of external costs of pollution emanating from construction machinery is evaluated. Generally, there are 2 views, top-to-bottom and bottom-to-top, for estimating the dissemination of pollution [16]. In this study, the latter is used, meaning that the pollution factors rates are evaluated rst, and associated nal emission factors will be calculated later. Finally, the corresponding fuel consumption and costs are estimated, based on the evaluated emission factors and provided tables in (EPA, 2010).
The pollution factors rates of Compression Igni-tion (CI) machinery can be derived from the reports of Environmental Protection Agency (EPA, 2010) using Eq. (5). To avoid complexity, no further detailed formulations are presented here. More details can be found in EPA (2010):
EFadj= EFss TAF DF SPMadj; (5)
where EFadj is nal emission factor after adjustments
to account for transient operation and deterioration (g/hp-hr); EFss is zero-hour, steady-state emission
factor (g/hp-hr); TAF is Transient Adjustment Factor (unitless); DF is Deterioration Factor (unitless); and SPMadjis Adjustment to PM emission factor to account
for variations in fuel sulfur content (g/hp-hr).
The zero-hour, steady-state emission factors (EFss) are mainly a function of model year and
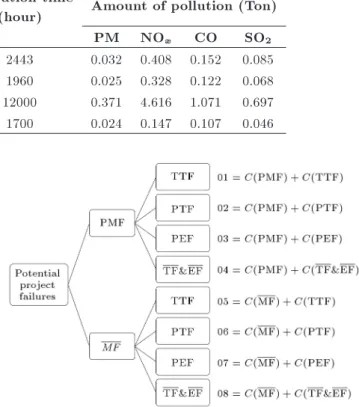
horse-power category, which denes the technology type. The Transient Adjustment Factors (TAFs) vary by equipment type. The Deterioration Factor (DF) is a function of the technology type and age of the engine. As an example, exhaust emission factors for Alternative 1 are presented in Table 8.
Table 7. Cost of technical and managerial risks (in US Dollar).
Item Type Symbol Alternative 1 Alternative 2 Alternative 3
Cost of technical risks Total technical failure TTF 82166 104066 109066 Cost of managerial risks Partial technical failure PMF 42000 50333 50333
Table 8. Exhaust emission factors for Alternative 1. Machine Fuel consumption
(liter/hour)
Operation time
(hour) Amount of pollution (Ton)
PM NOx CO SO2
Excavators (drill) 3 2443 0.032 0.408 0.152 0.085
Excavators 3 1960 0.025 0.328 0.122 0.068
Truck 5 12000 0.371 4.616 1.071 0.697
Loader 2 1700 0.024 0.147 0.107 0.046
Table 9. External costs of pollution factors. Pollution factors PM CO SO2 NOx
Cost ($/Ton) 1146.6 50 486.6 160 Table 10. Costs of environmental risks.
Alternative Cost of pollution ($)
1 1906
2 1906
3 1832
Table 11. Costs of environmental risks. Alternative Cost of pollution ($)
1 7496
2 7496
3 7206
Based on local prices in 2002, the external costs of pollution factors and environmental destruction result-ing from usresult-ing vehicles workresult-ing with fossil fuel energy are presented in Table 9 and Table 10, respectively.
It is necessary to mention that based on Table 10, the nal cost of pollution for both Alternatives 1 and 2 is $1906 because the associated exhausted pollution for the electrical Tower Crane, which is employed in Alternative 2, is considered to be zero. Since the calculated costs are based on 2002 prices, the Cost Plus method [17] is employed in order to evaluate the costs based on present-time (2014) prices (World Bank website) in the target area. The outcomes are shown in Table 11:
ExCt2014= ExCt2002$Rate$Rate2014
2002; (6)
where ExCtnand $Rate are the evaluated cost and the
average dollar value on year n, respectively. 8. Choice of optimum alternative and
corresponding residual budget
The nal step is to determine the optimum alternative, considering technical, managerial, and environmental
Figure 4. Potential project failures.
failure risks, and investigating the fraction of the resid-ual budget that maximizes the owner's utility, which is dened as the minimum expected cost of failures. The order of failure occurrences, including technical, managerial, and environmental failures, over the whole life cycle of a construction machinery project is shown as an event tree in Figure 4. Managerial failures occur before technical and environmental failures because a technical and environmental occurrence can happen only after the design phase has been completed.
The minimum expected failure costs for each allo-cation of the residual budgets to technical, managerial, and environmental reserves is evaluated using Eq. (7):
E =P (PMF)P (TTF)01 + P (PMF)P (PTF)02 + P (PMF)P (PEF)03
+ P (PMF)P (TF&EF)04
+ P (MF)P (TTF)05+P (MF)P (PTF)06 +P (MF)P (PEF)07 + P (MF)P (TF&EF)08; (7) where PMF means Partial Managerial Failure; TTF means Total Technical Failure; PTF means Partial Technical Failure; PEF means Partial Environmen-tal Failure; MF means no Managerial Failure; and TF&EF means no Technical and Environmental
Fail-ure. Moreover, C(X) are costs of events Xs and Xs = PMF; TTF; PTF; PEF; MF; TF, and EF.
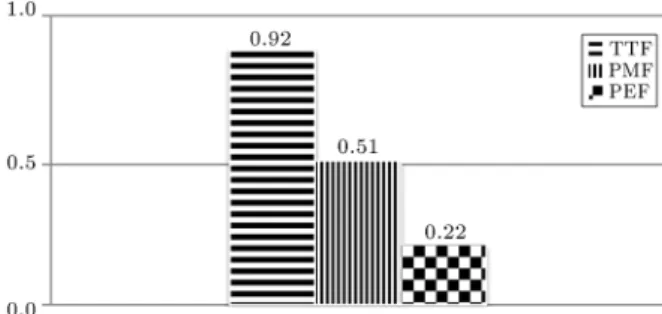
Figures 5 to 7 and Table 12 show the summa-rized outcomes of the overall optimizations for all 3 alternatives, including technical, managerial, and environmental failure risks; the probability of overall project failure; and the estimated costs of failures over the whole life cycle of the construction machinery project. Table 12 shows that the cost of failure and the probabilities of failure risks for Alternative 1 are lower than those for the other alternatives. Therefore,
Figure 5. Probabilities of failures - Alternative 1.
Figure 6. Probabilities of failures - Alternative 2.
Figure 7. Probabilities of failures - Alternative 3. Table 12. Costs of overall failure risks.
Costs of overall failure risks (based on 2014) ($)
Alternative 1 Alternative 2 Alternative 3
0% 114145 150901 155059
50% 106744 139505 144901
100% 102636 135420 140346
it can be clearly concluded from comparison of the alternatives that utilizing Alternative 1 for the con-struction machinery used for Isfahan's subway stations is more economical. This case study evidently shows the usefulness and the eciency of implementation of the modied APRAM method, which helps project managers to select the optimum technical alternative considering all failure modes over the entire machinery project life cycle.
It should be emphasized that the modied APRAM model presented here contains a general risk/cost function for modeling systems, assuming that the probabilities of failures in a system diminish exponentially as the residual budget is spent to increase the robustness and performance of the system. The reliability of this assumption needs to be evaluated in further studies using historical data on similar or related projects.
9. Summary and conclusion
Machinery is one of the basic and central means for achieving the predetermined goals in construction and infrastructure projects. The dierent types of construc-tion machinery usually bear dierent risks. This paper has presented the modied Advanced Programmatic Risk Analysis and Management Model as an appro-priate decision-support tool for construction managers, which can address cost, time, quality, and environmen-tal failure risks, simultaneously. This method would help project directors to minimize the plausible risks of a machinery project and to select the optimal com-bination of machines. Besides developing the APRAM model for covering environmental risks in addition to the technical and managerial risks, this study has investigated 3 alternative combinations of machinery in the excavation and digging project of Isfahan's subway. The optimal diagrams of all alternatives were drawn according to the identied risks and their initial costs. These diagrams were presented for each alternative, separately, considering environmental, technical, and managerial risks. Thus, one can compare them with each other and choose the optimum combination. Ana-lyzing the optimal diagrams sets the ground for making appropriate decisions about choosing contractors and implementation methods. The APRAM model tech-nique is suggested here as a method for the optimal selection of machinery in construction projects. Also, it should be mentioned that although the APRAM method considers all managerial, technical, and envi-ronmental risks, simultaneously, as the next step, it is suggested to develop the model for taking into account the other potential projects' risks, which might occur in the construction projects, e.g., human resource risks, transportation and trac risks, and sound pollution risks.
Nomenclature
APRAM Advanced Programmatic Risk Analysis and Management Model
CI Compression Ignition
DevCost Development Cost
DF Deterioration Factors
EFadj Final Emission Factor after
adjustments to account for transient operation and deterioration (g/hp-hr) EFss Zero-hour, steady-state Emission
Factor (g/hp-hr)
EF No Environment Failures
EPA Environmental Protection Agency
MF No Managerial Failures
NOx Oxides of Nitrogen
PEF Partial Environment Failures
PF Partial Failure
PM Particulate Matter
PMF Partial Managerial Failures PTF Partial Technical Failures
RB Residual Budgets
SPMadj Adjustment to PM emission factor to
account for variations in fuel sulfur content (g/hp-hr)
TAF Transient Adjustment Factor
TB Total Budget
TF Total Failure
TF No Technical Failure
TTF Total Technical Failure References
1. Forbes, D., Smith, S., and Horner, M. \Tools for selecting appropriate risk management techniques in the built environment", Construction Management and Economics, 26(11), pp. 1241-1250 (2008). 2. Tran, D.Q. and Molenaar, K.R. \Risk-based project
delivery selection model for highway design and con-struction",Journal of Construction Engineering and Management, 141(12), pp. 1-9 (2015).
3. Moret, Y. and Einstein, H.H. \Construction cost and duration uncertainty model: Application to high-speed rail line project", Journal of Construction Engineering and Management, 142(10), pp. 1-3 (2016).
4. Imbeah, W. and Guikema, S. \Managing construction projects using the advanced programmatic risk
analy-sis and management model", Journal of Construction Engineering and Management, 135(8), pp. 772-781 (2009).
5. Dillon, R.L., Pate-Cornell, M.E., and Guikema, S.D. \Programmatic risk analysis for critical engineering systems under tight resource constraints" Operations Research, 51(3), pp. 354-370 (2003).
6. Dillon, R.L. and Pate-Cornell, M.E. \APRAM: An ad-vanced programmatic risk analysis method", Interna-tional Journal of Technology, Policy and Management, 1(1), pp. 47-65 (2001).
7. Zeynalian, M., Trigunarsyah, B., and Ronagh, H. \Modication of advanced programmatic risk analysis and management model for the whole project life cycle's risks", Journal of Construction Engineering and Management, 139(1), pp. 51-59 (2012).
8. Rydeen, F. \Managing costs", American School and University, 78(7), p. 58 (2006).
9. Mulholland, B. and Christian, J. \Risk assessment in construction schedules," Journal of Construction En-gineering and Management, 125(1), pp. 8-15 (1999). 10. Oztas, A. and Okmen, O. \Judgmental risk analysis
process development in construction projects", Build-ing and Environment, 40(9), pp. 1244-1254 (2005). 11. Trejo, D. and Reinschmidt, k. \Justifying materials
selection for reinforced concrete structures: Part I -Sensitivity analysis", Journal of Bridge Engineering, 12(1), pp. 31-37 (2005).
12. Dillon, R.L. \Programmatic risk analysis: Engineering and management risk tradeos for interdependent projects", PhD Thesis, Stanford University (1999). 13. El-Reedy, M.A., Construction Management for
In-dustrial Projects, Scrivener Publishing, Salem, Mas-sachusetts (2011).
14. Pate-Cornell, M.E. \Fault trees vs. event trees in reliability analysis", Risk Analysis, 4(3), pp. 177-186 (1984).
15. Guikema, S.D. and Pate-Cornell, M.E. \Component choice for managing risk in engineered systems with generalized risk/cost functions", Reliability Engineer-ing & System Safety, 78(3), pp. 227-238 (2002). 16. Kumar, P., Gurjar, B., Nagpure, A., and Harrison,
R.M. \Preliminary estimates of nanoparticle number emissions from road vehicles in megacity Delhi and associated health impacts", Environmental Science & Technology, 45(13), pp. 5514-5521 (2011).
17. Petersen, H., Cris Lewis, W., and Jain, K. , Managerial Economics, Pearson Education (2006).
Biographies
Mehran Zeynalian is Assistant Professor of Civil Engineering at the University of Isfahan. He received BSc and MSc degrees in Civil Engineering from Isfahan University of Technology in Iran in 1999 and 2002, respectively. Dr. Zeynalian also received his PhD
degree in the eld of Structures and Construction Management from The University of Queensland in 2012.
Iman Kalantari Dehaghi received his BSc and MSc degrees from Islamic Azad University, Arak Science
and Research Branch, in Civil Engineering in 2012 and 2015, respectively. The title of his MSc thesis is \The Optimum Combination of Civil Machinery using Ad-vanced Programmatic Risk Analysis and Management Model". He is now working in Engineering Consultant Company in the eld of Civil Engineering.