Omar Kashef. Developing a System for Collecting, Storing, and Displaying
Information for the Development Finance Initiative. A Master's paper for the M.S.
in I.S. degree. November, 2016. 60 pages. Advisor: Stephanie W. Haas
This master’s project was developed for the Development Finance Initiative
(DFI), a program of the School of Government (SOG) at The University of North
Carolina at Chapel Hill. The goal of this master’s project was to build a website to
assist DFI track key project metrics, compare projects through those metrics, and
develop an internal knowledge base that could lead to evidence-based practices
for the redevelopment of a distressed community. Moreover, this master’s project
is part of the greater push for standardization in DFI’s workflow and describes
how an organization under twenty employees can develop a system for
collecting, storing, and displaying key project metrics to better document the
impact of the organization’s work.
Headings:
Business information services
Knowledge management
Strategic information system
DEVELOPING A SYSTEM FOR COLLECTING, STORING, AND DISPLAYING
INFORMATION FOR THE DEVELOPMENT FINANCE INITIATIVE
by
Omar Kashef
A Master's paper submitted to the faculty
of the School of Information and Library Science
of the University of North Carolina at Chapel Hill
in partial fulfillment of the requirements
for the degree of Master of Science in
Information Science.
Chapel Hill, North Carolina
November, 2016
Approved by:
________________________
TABLE OF CONTENTS
INTRODUCTION ... 3
LITERATURE REVIEW ... 15
METHODS ... 24
DESIGN & DEVELOPMENT PROCESS ... 30
RESULTS ... 41
NEXT STEPS ... 49
LESSONS LEARNED ... 51
BIBLIOGRAPHY ... 53
TABLE OF FIGURES & TABLES
FIGURE 1: DFI PRE-DEVELOPMENT PROCESS (TEMPLATE DFI POWERPOINT SLIDE) ... 6
TABLE 1: INFORMATION SOURCES AND FILE TYPES FOR DFI ANALYSIS ... 7
TABLE 2: DATA COLLECTION CHALLENGES AND OPPORTUNITIES FOR IMPROVEMENT ... 9
TABLE 3: STAGES OF SMALL BUSINESS GROWTH ... 12
TABLE 4: PROJECT PHASE – CRITICAL SUCCESS FACTORS ... 15
TABLE 5: POST-PROJECT PHASE – CRITICAL SUCCESS FACTORS ... 15
FIGURE 2: NIKE, INC. CORPORATE RESPONSIBILITY, CONTRACT MANUFACTURING NETWORK ... 20
FIGURE 3: COCA-COLA JOURNEY X JOURNEY MAP ... 20
FIGURE 4: WWF, THE WATER RISK FILTER ... 21
TABLE 6: GLOSSARY ... 25
TABLE 7: GENERAL WEBSITE COMPONENTS ... 26
FIGURE 5: LOCATION OF PROJECT DELIVERABLES AND LINKING TO DFI MICROSITE ... 27
TABLE 8: WEB FORM QUESTIONS OVERVIEW ... 27
FIGURE 6: DETERMINING ANNUAL GROWTH RATE ... 29
FIGURE 7: WEB FORM SITE ADDRESS FIELDSET ... 29
TABLE 9: DELIVERABLE TIMELINE ... 30
FIGURE 8: SITE MAP GRAPHIC ... 33
FIGURE 9: WEBSITE SNAPSHOT – PUBLISHED SURVEYS ... 34
TABLE 10: PROS AND CONS OF MODULES FOR WEB FORM DEVELOPMENT ... 35
FIGURE 10: PILOT STUDY REFINEMENT EXAMPLE ... 42
TABLE 11: USABILITY TESTING DESCRIPTIVE SUMMARY ... 44
FIGURE 11: COMMUNITY OVERVIEW WEB FORM SECTION ... 46
FIGURE 12: WEB FORM VIEW – PARCEL ANALYSIS ... 47
INTRODUCTION
This master’s project was developed for the Development Finance Initiative (DFI), a program of the School of Government (SOG) at The University of North Carolina at Chapel Hill. The goal of this master’s project was to build a website to assist DFI track key project metrics, compare projects through those metrics, and develop an internal knowledge base that could lead to evidence-based practices for the redevelopment of a distressed community. Moreover, this master’s project is part of the greater push for standardization in DFI’s workflow and describes how an organization under twenty employees can develop a system for collecting, storing, and displaying key project metrics to better document the impact of the organization’s work.
DFI was created in 2011, and brought on as director, Michael Lemanski, who has a redevelopment portfolio of over two million square feet of real estate and has attracted over $500 million dollars of investment in distressed downtowns. Since 2011, DFI has led more than eighty projects across fifty-five communities in North Carolina. DFI specifically partners with
governments to provide real estate development and financial expertise “to attract private investment for transformative projects” (Lemanski, 2012). Prior to DFI’s existence, Tyler Mulligan, now the lead SOG faculty advisor for DFI, would field questions from public officials regarding specific real estate proposals. While he would be able to provide the legal answer, he could not tell them whether the proposal made sense financially.1 Michael began his career in real
estate development with a vision to revitalize downtown Durham. In order to do so, Michael partnered with the City of Durham. Although Michael has successfully restored many buildings in downtown Durham, when asked what he would do differently, he said he wished that an
organization like DFI existed to help the City of Durham navigate public-private partnerships, one of DFI’s key areas of expertise.2
Typically, a local government will reach out to and consult with DFI to conduct pre-development work for properties over which the local government has site control, the process of contractually providing an entity control of a site over the contractually agreed-upon period of time (Urban Land Institute, 2012). Acquiring site control minimizes risk for the local government because any due diligence that DFI conducts will be constrained time-wise by the contract containing site control. Any work that DFI conducts for the local government will not just be another plan, but an effort to solicit actual proposals from developers. The typical
pre-development process includes conducting analyses of tax data, market data, and determining the financial feasibility of a project. Collecting data to conduct these analyses is fundamental to DFI’s work. Data is collected from numerous sources including local, state, and federal sources as well as other proprietary sources.
DFI has completed a wide variety of projects, from helping to create local real estate funds to conducting typical pre-development services. Developers and local governments are often operating with different motivations and constraints. Through public-private partnerships, local governments can partner with real estate developers to leverage public investment to attract private investment, one of DFI’s primary goals’. Where DFI excels is in bridging those gaps by working directly with local governments and working towards their needs while also
understanding the motivations and thought processes of real estate developers. For example, in 2013 DFI was hired for pre-development services for the Water Street Parking Deck in
Wilmington, North Carolina (Development Finance Initiative, 2015). Wilmington had grown tremendously in recent years becoming a regional economic and social hub. City officials realized that the parking deck, nearing obsolescence, was not the highest and best use for the site. Thus,
the City released multiple requests for proposals—solicitations for real estate developers to bid on a project3—to no avail unfortunately. That was when the City hired DFI to lead
…a 12-month pre-development process that guided the city to key decision points about the program, the public investment, the structure of the public-private partnership, and selection of a private sector partner. This iterative process included a market analysis, site analysis, public stakeholder engagement, and financial feasibility modeling
(Development Finance Initiative, 2015).
With DFI’s help, the City chose East West Partners, a development group out of Chapel Hill, to redevelop a deteriorating parking deck into a mixed-use project with residential, retail, and parking (March, 2015). The project broke ground in Summer 2016.
The Wilmington example provides insight into one type of project: a new construction project in a downtown area. However, DFI also completes similar work at vastly different scales. For example, DFI is also currently engaged by the NC Department of Commerce to study the Historic Broughton Campus in Morganton, NC. The Department of Commerce hired DFI to determine potential uses and phasing of the historic mental health facility because a new mental health facility was being built on adjacent property. The historic portion of the site—currently owned by the NC Department of Health and Human Services and dating back to the late nineteenth century—is over fifty acres and when vacated, there will be close to 800,000 square feet of vacant space. DFI realized the potential for expansion of the site because directly
surrounding the site is 750 acres of publicly-owned land. Looking holistically at the 800-acre site, DFI determined that the Historic Broughton Campus and surrounding land could attract over $150 million in private capital “for a mixed-use district that reuses the entire historic campus” (Development Finance Initiative, 2015).
DFI’s Work
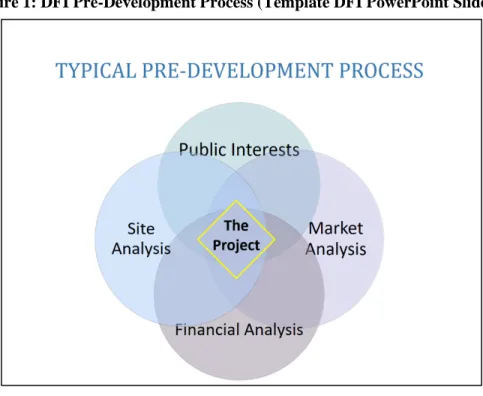
During a typical contract year, DFI will proceed through the pre-development process that includes four major parts: determination of project-specific public interests, parcel and
market analysis, site analysis, and financial analysis. The viable project lies at the center of those analyses. The goal is to identify that program that is supported by the local government and its constituents, supported by the market, and is financially feasible. The program defines “the required functions of the project” (Knowledge Resources Staff, 2007). Figure 1 represents a stock PowerPoint slide that DFI utilizes to highlight the major pieces of the pre-development process that DFI employs.
Figure 1: DFI Pre-Development Process (Template DFI PowerPoint Slide)
DFI conducts parcel analyses to identify patterns and trends of property tax data in a bounded study area which incorporates properties that are immediately relevant to the project site. A parcel analysis will require acquiring parcel data and shapefiles from county and municipal websites and NC OneMap4, a website providing mapping data for North Carolina which come
from local, state, and federal sources. After acquiring the parcel data, DFI assesses major trends through visual and information analysis. Maps are created in ArcMap5 and data is analyzed and
organized in Excel workbooks. Key patterns that DFI seeks to uncover are land use, value, ownership, and recent sales. After the analysis is tentatively completed, the information is
distilled in a PowerPoint and presented to public officials. The term tentative is used purposefully because DFI’s process is iterative and the parcel analysis is likely to be re-visited through the course of a DFI project to uncover additional information and patterns. This is the case for other analyses that DFI conducts during the pre-development process.
Following the parcel analysis is the market analysis in which the goal is to project square footage demand for various industries such as retail, office, and residential. Those three industries represent the typical market analysis industries studied; however, some projects will require
4 Access NC OneMap here, http://data.nconemap.com/geoportal/catalog/main/home.page 5 Learn more about ArcMap here, http://desktop.arcgis.com/en/arcmap/
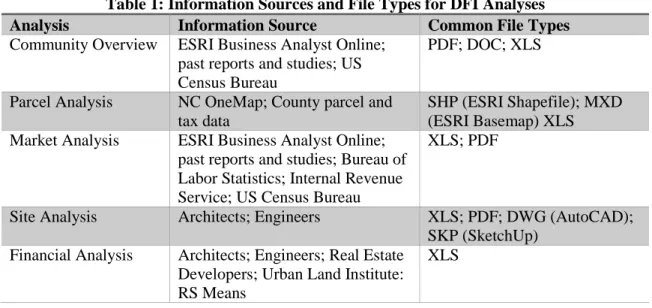
Table 1: Information Sources and File Types for DFI Analyses
Analysis Information Source Common File Types
Community Overview ESRI Business Analyst Online; past reports and studies; US Census Bureau
PDF; DOC; XLS
Parcel Analysis NC OneMap; County parcel and tax data
SHP (ESRI Shapefile); MXD (ESRI Basemap) XLS Market Analysis ESRI Business Analyst Online;
past reports and studies; Bureau of Labor Statistics; Internal Revenue Service; US Census Bureau
XLS; PDF
Site Analysis Architects; Engineers XLS; PDF; DWG (AutoCAD); SKP (SketchUp)
Financial Analysis Architects; Engineers; Real Estate Developers; Urban Land Institute: RS Means
projecting market demand in additional industries such as hospitality or industrial. Market information comes from a wide variety of sources and is organized in an Excel workbook. The market analysis begins by identifying market trade areas that are bounded by the extent to which a particular industry’s growth could impact the parcel analysis study area. In order to determine that impact, a capture rate is applied to the total projected growth. For example, after determining how much office square footage is supported in the market area, a capture rate is then applied to determine the square footage projection that the project study area could support. The capture rate is conceptually defined as how much square footage the study area could capture from the larger trade area.
After determining what the site could support based on the market, a site analysis is performed in conjunction with an architect to better understand the physical, environmental, and historic constraints of the site. Additionally, architects are hired to provide a detailed program to more accurately assess the financial feasibility of the project. The schematic designs and
programs are typically provided to DFI by the architect in PDFs and Excel spreadsheets. Not every DFI project has an architect onboard and in some cases the site analysis can be performed in-house by DFI project managers with an educational background in architecture.
One of DFI’s goals is to limit a local government’s risk and financial outlays in the development process. When public investment is necessary, DFI will ensure that what is proposed, leverages a minimal amount of public investment to attract private investment. DFI generally measures a project as successful when private investors and developers invest in the community in which DFI is partnering with as a result of DFI’s work.
Data Standardization
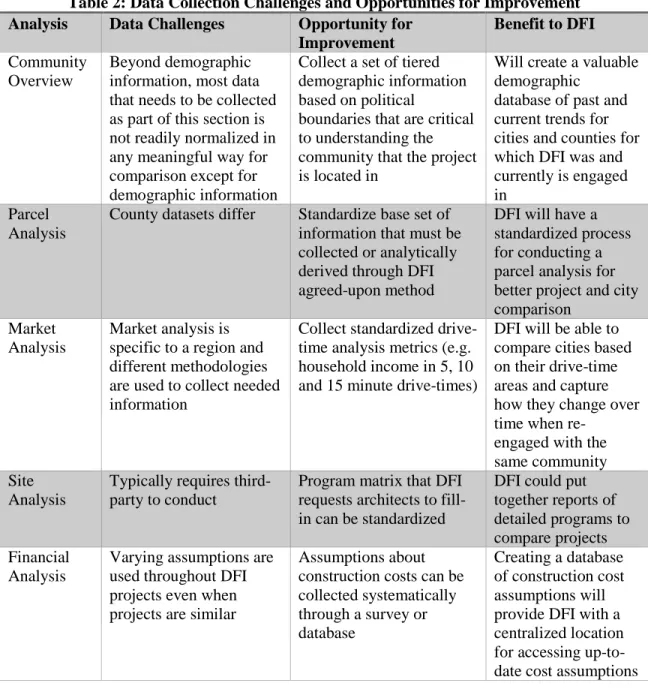
There are data challenges in each of the analyses that DFI conducts that makes
standardization difficult; however, there are processes that DFI could standardize (see Table 2). One major challenge in standardizing the parcel analysis is that county parcel datasets vary and occasionally may be inaccurate. Additionally, not every county dataset includes information that DFI seeks for a parcel analysis. For example, in some datasets the data does not distinguish different types of commercial space, particularly retail and office space, yet in order for DFI to conduct a parcel analysis, that distinction is important. Thus, innovative techniques may be required to estimate how much of the commercial space is either retail or office. The market analysis is particularly challenging to analyze because market analyses are conducted for specific markets and each market has a specific area of analysis. Despite that, there are general market trends that DFI can collect such as building permit information, demographic changes in different drive-time areas6, and base market industry projections based on population and household
growth. There are elements of DFI’s work that can be standardized at a base to facilitate better comparisons between project sites and cities that would be more challenging to do without this master’s project because of the complexity of the information collected and analyzed.
Table 2: Data Collection Challenges and Opportunities for Improvement
Analysis Data Challenges Opportunity for
Improvement
Benefit to DFI
Community Overview
Beyond demographic information, most data that needs to be collected as part of this section is not readily normalized in any meaningful way for comparison except for demographic information
Collect a set of tiered demographic information based on political
boundaries that are critical to understanding the community that the project is located in
Will create a valuable demographic
database of past and current trends for cities and counties for which DFI was and currently is engaged in
Parcel Analysis
County datasets differ Standardize base set of information that must be collected or analytically derived through DFI agreed-upon method
DFI will have a standardized process for conducting a parcel analysis for better project and city comparison
Market Analysis
Market analysis is specific to a region and different methodologies are used to collect needed information
Collect standardized drive-time analysis metrics (e.g. household income in 5, 10 and 15 minute drive-times)
DFI will be able to compare cities based on their drive-time areas and capture how they change over time when
re-engaged with the same community Site
Analysis
Typically requires third-party to conduct
Program matrix that DFI requests architects to fill-in can be standardized
DFI could put together reports of detailed programs to compare projects Financial
Analysis
Varying assumptions are used throughout DFI projects even when projects are similar
Assumptions about construction costs can be collected systematically through a survey or database
Creating a database of construction cost assumptions will provide DFI with a centralized location for accessing up-to-date cost assumptions
Project Motivation
analyzed in the various phases of DFI’s work.7 A former DFI Project Manager had created a
Qualtrics8 survey to collect DFI project information. Moreover, I had been thinking about this
information need in different courses that all provided additional motivation to build beyond just a Qualtrics survey. While a student in an introductory database course,9 based on that Qualtrics
survey, I designed an entity relationship diagram and built a database using Oracle.10 Through
this, I realized that a lot of work would be required to set up and maintain the database over time and would always require somebody skilled in database management. Additionally, as a student in a systems analysis course,11 my group and I made recommendations to DFI to purchase file
hosting service, Dropbox Business,12 and how to proceed with managing DFI’s need to track DFI
project information. The final recommendation was to let me complete a master’s project to assess DFI’s need to better analyze and track DFI project information and design a system meeting those needs (Gardner, Lewis, Li, & Kashef, 2015).
Project Setting
DFI is a growing organization and is currently undergoing a pivotal transition point. In Churchills’ and Lewis’ small business growth model, DFI is transitioning from the survival stage to the success stage. This model (see Table 3) is particularly popular and the authors’ article discussing the model has been cited over 250 times (Thomson Reuters, 2016). Although this model does not perfectly reflect DFI’s growth, it does capture DFI’s current transitory state. DFI is developing more consistent processes for day-to-day tasks, project management, and the flow and control of information. This project is particularly concerned with the latter process: flow and control of information. More specifically, this project is concerned with better controlling the
7 Conversation with DFI Associate Director, Christy Raulli, August 2015
8 Read more on Qualtrics, a research platform, here: https://www.qualtrics.com/about/ 9 INLS 523, Database Systems I, UNC-Chapel Hill, Fall 2015
10 Read more on Oracle, integrated application platform particularly involving databases, here: https://www.oracle.com/index.html
11 INLS 582, Systems Analysis, UNC-Chapel Hill, Fall 2015
flow of information in order to compare projects internally.
Table 3: Stages of Small Business Growth (Churchill & Lewis, 1983)
Stages Features
Existence Owner is involved in all aspects of the business Limited systems and formal planning
Survival Organization surpasses existence stage and starts developing its understanding between revenues and expenses
System development and formal planning is in the purview of cash forecasting
Success Organization has attained economic health
Functional managers become more prominent with increased delegation
Take-Off Operating and strategic planning handled by functional managers Organization becomes more complex with increased delegation
Resource Maturity
Decentralized, experienced, and adequately staffed management
Although DFI has been growing over the last five years, increasing the number of employees from three to nine plus adding ten graduate fellows, there has been no successfully executed effort to consolidate DFI’s information in one location nor any consistent effort to measure key metrics across all projects until Summer 2016. DFI’s project information was stored in multiple spaces including Google Drive, Dropbox, Asana, and personal computers and flash drives. Of those, the two major storage locations were Dropbox and Asana. DFI uses Asana, web-based software for team collaboration,13 to organize project workflows; however, project
managers and graduate fellows use the system differently which inhibits DFI from effectively seeking out information to compare projects. Typically, final versions of presentations or documents are uploaded to Asana in addition to being stored in another location.
Without the consolidation of DFI’s project information in one location, comparing projects across identified metrics becomes challenging because that information is stored in various locations. DFI purchased Dropbox Business in Summer 2016 and acquired licenses for all graduate fellows and employees. Dropbox Business will provide DFI secured and unlimited storage that is effectively backed up on personal computers and in Dropbox’s servers. Dropbox also integrates well with Asana; thus, DFI will now use Dropbox for centralized storage and link
documents and presentations to Asana. Asana will provide DFI’s management with the arc of a project and provides them an opportunity to determine when and where to provide feedback as a project is underway.
Problem Statement
As indicated in the previous section, DFI is collecting a wide variety of information that is stored in a variety of formats and locations making it hard to compare projects. Thus, DFI needs a well-defined process for tracking identified project metrics that are key to determining the success of a project for DFI’s internal needs to compare and track projects. In addition, DFI needs more project material online so that visitors of DFI’s site can learn more about DFI’s projects to build greater awareness of DFI’s work and attract new local government clients.
Project Resources
This project would not have been possible without the support of the UNC School of Government. I completed this project with the assistance of Lindsay Hoyt, staff at the School of Government, who provided me access to Drupal and maintained the website that will feature the project deliverables. Initially, this project was to be managed primarily by a now former DFI project manager After the project manager left DFI, this project was ultimately managed by interim Operations Director, Andrew Holton, and any review of my work was to be completed by all project managers during one of their scheduled weekly meetings. In coming up with a well-defined process to track key DFI project metrics, I worked with the School of Government to create a website. The requirements for the project were broad and I was not provided detailed specifications. Thus, developing the deliverables to meet their functional requirements was of much higher priority than developing a spectrum of possible approaches despite researching and documenting additional methods.
Project Deliverables
out can be displayed in various formats, including tables, charts, and maps. The web form is the key to displaying information in those various formats so that DFI can better understand the impact of its work through questions in the web form. The questions for the Web Form came primarily from the Qualtrics survey that a former project manager created. The three deliverables for this project are described more specifically below.
1. Build a web form via Drupal that will serve as a mechanism to transfer needed DFI information found in Excel spreadsheets and PowerPoint presentations for every project into a Drupal database to ensure that DFI will be able to track key project metrics and provides an opportunity to assess the impact of DFI’s work in the future by those same metrics (Web Form)
2. Develop web form views via Drupal for each key section in the Web Form (Web Form Views)
3. Develop an interactive online map via Drupal, of North Carolina, functioning as an interactive report of DFI’s work, allowing external users such as local government administrators and officials to select key metrics and/or projects to learn more about DFI’s work (Map)
Critical Success Factors
There are two phases in which critical success factors are measured with the first being part of this master’s project phase and the second being post-project, following the completion of this master’s project. The critical success factors during the project (Table 4) and post-project (Table 5) and how those success factors are measured are found in the tables below. The critical success factors during the project phase will be used to assess the success of this master’s project; however, the post-project phase success factors are items that are outside the scope of this
Table 4: Project Phase - Critical Success Factors
Success Factor Measuring Success
Completed DFI Project Metrics web form that is operating on the back-end without any errors
This success factor will be completed when the web form can be saved and edited at any point.
Completed DFI Project Metrics web form that can be completed by a graduate fellow, junior or senior, with minimal guidance from a project manager
This success factor will be measured during the usability tests. Participants will be asked to indicate any questions that they could not answer without additional guidance. This success factor is deemed completed if the participant deems less than three questions as unanswerable without further guidance. The Web Form takes less than 2 hours
to complete.
This success factor will be measured during the usability tests. If a user can answer 50% of the questions in the hour that is slotted, than this success factor is deemed complete.
The Web Form views appear properly on different browsers and are
understood.
This success factor will be measured during a DFI project manager meeting in which the Views will be presented. This will be a qualitative assessment of success and any feedback provided will further refine the Views.
The interactive, online map is functional
This success factor will be deemed complete if a user can view a map of North Carolina, click on a project location, and learn about the project from Web Form submission data.
Table 5: Post-Project Phase – Critical Success Factors
The Web Form is not a significant burden on project managers and graduate fellows
Web Forms for past projects completed by the end of Summer 2017. Filling out Web Forms for past projects ideally finished by Summer 2017 after The Map is visited by public officials
across NC
While tracking web hits is a typical step taken to determine success; success will be determined in this case if DFI contracts with two more local
governments and the Map is mentioned in those initial contractual discussions.
This project is the beginning of a more process-oriented organization
Additional web forms and potentially even a
dashboard is added to the newly constructed website to mark a project’s arc through the Web Form
LITERATURE REVIEW
government entity. For example, governments may want to ensure the veracity of financial reporting so that shareholders are provided accurate financial information so that they can make informed decisions (Adams & Frost, 2005). Additionally, shareholders now expect sustainability information to provide further information to shareholders to make informed decisions and shareholders expect this information to be readily accessible (Daub, 2005).
Need for Reporting Standardization and Interactivity
Annual reporting can be broadly divided into two classes: legally required or
non-financial reporting also known as narrative reporting and sustainability reporting (Adams & Frost, 2005). As financial reporting became standardized, there was a growing desire for non-financial reporting in various industries even within financial accounting. When Robert H. Herz, formerly a senior partner with PricewaterhouseCoopers, became the chairman of the Financial Accounting Standards Board (FASB) in 2002, he understood the need to broadly enhance industry standards (Herz, 2015). FASB has established the standards of financial accounting since 1973 and they “are officially recognized as authoritative by the Securities and Exchange Commission (SEC) and the American Institute of Certified Public Accountants” (Financial Accounting Standards Board, n.d.). After serving two terms as chairman, Robert Herz, joined the board of the Sustainability Accounting Standards Board (SASB) which is a nonprofit group helping companies develop standards for “reporting material sustainability information” (Herz, 2015). SASB has been accredited by the American National Standards Institute to set standards regarding sustainability issues of publicly listed companies in the United States (Jaeger, 2013). Material information is information that impacts the decisions and actions of an organization or its stakeholders such as environmental and social impacts (Ernst & Young Australia, 2009). The transition for Herz from FASB to SASB is similar to the increasing number of reports produced in the corporate world regarding corporate social responsibility (CSR) and the triple bottom line (financial,
200, Australia’s leading share market index, included a stand-alone CSR report in addition to their annual report (Ernst & Young Australia, 2009).
Annual financial reports served as a precursor for sustainability reports. Around 1995 annual reports began to include ethical and social elements of a company’s work (Daub, 2005). According to Ernst & Young, the globally popular framework for providing external stakeholders reports about social and environmental impacts is the Global Reporting Initiative (GRI)
Sustainability Reporting Framework. GRI is a nonprofit organization that helps businesses understand potential social and environmental impacts which usually requires organizations to collect additional data. GRI defines sustainability reporting as “the practice of measuring, disclosing, and being accountable to internal and external stakeholders for organizational performance towards the goal of sustainable development” (Maddocks, 2011). While
shareholders will be seeking out reporting information to determine if the company’s profit is increasing and provide feedback for the company to increase profits, external stakeholders and shareholders interested in a corporation’s social impact are interested in more than just financial performance.
In 2003, the Australian government commissioned a report, Corporate Sustainability – an Investor Perspective (The Mays Report) in which the authors noted additional shareholder
values outside of financial performance including the following items: reduced regulatory intervention; enhanced reputation and stronger brand; alliances with business partners; better stakeholder relations; employer of choice; greater customer loyalty and higher sales; new
Online and Interactive Reporting
Much research on online reporting focuses on online financial reporting (Adams & Frost, 2005). In 2004, Lyle examined the websites of all Fortune 500 firms to conclude that thirty-three percent provide five years’ worth of reports and close to eighty percent provide access for at least two years (Lyle, 2004). However, as of the article by Adams and Frost published in 2005, web-based environmental reporting has typically been separated from general company reporting and has yet to integrate interactive visualizations and hypermedia features to present the information in a more accessible manner. From a government reporting perspective, Thornton conducted a study to analyze accessibility of state government comprehensive annual financial reports. State government stakeholders including taxpaying citizens and businesses care about sound financial management. Every state government except for one archived at least four comprehensive annual financial reports. When determining accessibility, the researcher used several measures, one being the presence of a link to the report on the front page in which only half of US states were providing (Thornton, 2012).
Available literature has not thoroughly addressed and studied interactive sustainability reports. Enablon Publisher, a global consulting firm that provides solutions for annual reporting, has noted the rise in the use of interactive maps in corporate sustainably reports (Dupont-Enzer, 2014). Moreover, in GRI’s campaign Sustainability and Reporting 2025,14 they released a report
indicating the need for more digital and interactive tools for corporate disclosure to empower stakeholders (Global Reporting Initiative, 2016).
Nike was awarded the Best Sustainability Report from the Ceres and the Association of Chartered Certified Accountants 2010 Awards (CERES-ACCA, 2010). Nike’s sustainability report included an interactive map (see Figure 2) that includes elements that this project will include such as the capability to click on locations to display additional information. In this case,
clicking on a country allows an external stakeholder to learn more about Nike’s contract manufacturing network across the globe. With this map, external stakeholders can learn about where Nike products are created through their contract manufacturing network. Particular elements that stand out in application to this project include the following interactions:
• clicking on a location to provide more information;
• clicking on a location shades that geography to emphasize which geography has
been selected; and
• changing the scale of the map to focus in on a particular geographic area.
Figure 2: Nike, Inc. Corporate Responsibility, Contract Manufacturing Network
Figure 3: Coca-Cola Journey x Journey Map
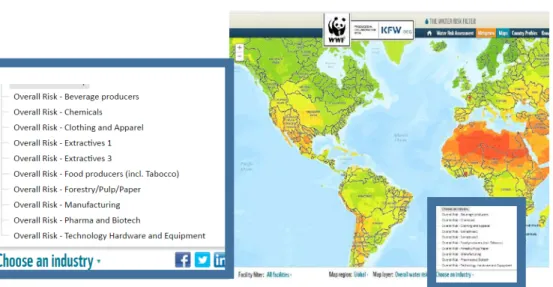
map. For example, a user can choose an industry and find out where various industries present risk factors to clean water across the globe.
Figure 4: WWF, The Water Risk Filter
Drupal
Drupal is an open-source content management system (CMS), an application for editing digital content, used by small and large companies, nonprofits, and governments across the world. Drupal is the current content management system used for the United States, France, and London governments and major networks BBC and NBC.15 Most importantly for this project, the School
of Government is using Drupal for managing its website hosted on Acquia. Rather than relying on a single physical server, SOG’s website is accessed through a network of physical servers. The combination of Drupal and Acquia is not uncommon as Acquia contributes to Drupal extensively, having created over 850 modules and made over 150,000 code commits to modules.16 With over
one million developers and editors contributing to Drupal modules, it is evident that Drupal modules are fundamental to Drupal.17
15 Read more on who uses Drupal here, https://www.drupal.org/about 16 Read more on Aquia here, https://www.drupal.org/acquia
The only other system considered for this project was Qualtrics, a platform designed specifically for creating surveys. The focal point of this decision was the ability to build and expand upon this survey. Thus, the decision was less about Qualtrics versus Drupal as it was a decision to build a larger system for the survey that could integrate additional elements in the future. With just a Qualtrics survey, there was no infrastructure to build off of beyond creating summary reports, likely in Microsoft Excel. With the use of Drupal to build the survey, not only would there be institutional support from the School of Government but the ability to create a website that would subsume the function of the Qualtrics survey. While Qualtrics is a powerful survey platform, not only was it already supported in Drupal as a module, but using Qualtrics had considerable pitfalls for the success of this project. One critical success factor for this project is to facilitate the transition of the Development Finance Initiative to the third stage, “Success”, in Churchill and Lewis’ organizational growth model. The third stage is the period in which an organization has attains economic health and works toward a more process-oriented organization (Churchill & Lewis, 1983).
Using tools that are widely-used and updated consistently are both critical requirements to choosing modules. Sustainability is valued more at this time than is innovation since DFI has not had an opportunity to provide significant feedback beyond general direction. Although the original survey created by a DFI Project Manager was created through Qualtrics, I ultimately decided to use a different module, Content Construction Kit (CCK), for this project as there are over 100,000 websites using CCK.18 This was an easy decision as there are only two websites
currently using the Qualtrics Drupal module.19 Usability Testing
Techniques in moderating a usability test are broadly delineated by a researchers’ interaction with the participants. Bergstrom identifies four techniques: concurrent think aloud
(CTA), retrospective think aloud (RTA), concurrent probing, and retrospective probing
(Bergstrom, 2013). Each technique has its pros and cons and the method used should align with the goal of the usability test. Concurrent Think Aloud is used primarily to “Understand
participants’ thoughts as they attempt to work through a task” in order to “elicit real-time feedback” (Bergstrom, 2013). Think Aloud protocol is a common method in usability testing; however, there is limited empirical support in the literature and even when sources cite a theory, the procedures used are theoretically inconsistent (Boren & Ramey, 2000; van den Haak, De Jong, & Schellens, 2003). According to Boren & Ramsey, even when authors do cite a theoretical source, it is likely Ericsson and Simon’s work from the 1980s. There is more recent research suggesting that adding technical communicators to a usability study does add value (Gerjets, Kammerer, & Werner, 2011). Ericsson and Simon intended think aloud to be used as a way to limit intervention from the researcher that would result in skewing the results (Ericsson & Simon, 1993). Thus, interfering by providing explicit instructions result in less “spontaneous evaluation processes” (Gerjets, Kammerer, & Werner, 2011). At the same time though, when a project results in artifacts that are used for analysis, the need for “spontaneous evaluation processes” are diminished (Gerjets, Kammerer, & Werner, 2011). For example, when a researcher requesting a participant, for example, to highlight certain elements, the researcher is willing to interfere in order to produce that artifact as the artifact is more important than the lack of intervention (Gerjets, Kammerer, & Werner, 2011).
study; however, they believe that CTA may be more valuable in tasks with a higher cognitive load (van den Haak, De Jong, & Schellens, 2003).
METHODS
This section will describe the requirements and methods used to develop the three
deliverables of this master’s project. The three major deliverables for this project include the Web Form, Web Form Views, and the Map. There were two sets of requirements for each deliverable, with one set specific to DFI and the other set to SOG. All three deliverables have been developed via Drupal with assistance from Lindsay Hoyt, Application Analyst at the School of Government. Lindsay Hoyt set up the Drupal DFI Metrics site and provided technical assistance when I was unable to solve the issue at hand. Table 6 presents terms that will be used throughout this paper to identify key actors and projects.
Information Gathering Plan
As discussed in the Introduction, DFI planned to better standardize, track, and display project information but that had not been executed until this master’s project. Following the completion of this project the website will continue to evolve based on input from DFI project managers and leadership. Additionally, in this post-project phase, DFI potentially plans to hire someone to maintain and update the website (see Next Steps); however, prior to reaching that phase, the following represent the master’s project assumptions that DFI’s Associate Director, Christy Raulli and I agreed-upon.20
• The Web Form fields would come from project managers’ input.
• DFI was aware of the need and ready to commit to interviews or usability testing for the
success of this project. Fellows and Project Managers were asked to take part in usability testing sessions to improve the Web Form and provide information to address how the Web Form will be rolled out post-project.
• Not all the web forms would be completed prior to the end of this project’s scope;
however, the Web Form will have been evaluated by participants in usability testing sessions and reviewed by DFI project managers and leadership prior to DFI mandating completion of the survey for current and past projects.
Table 6: Glossary
Term Definition
Web Form Drupal web form developed for project
Web Form Views Drupal views of key data points from Web Form submissions; Views is a Drupal module for displaying content
Map Third project objective; an online and interactive map displaying DFI projects and project-related information developed with a Drupal module
SOG Microsite DFI’s site that is found under the larger SOG site (sog.unc.edu) DFI Metrics Site Drupal development site in deliverables of master’s project are located Project Manager Refers to DFI project managers
Graduate Fellow Graduate students who are working at DFI part-time during the semester and full-time during the summer
Junior Fellow Graduate Fellow with fewer than six months of experience working with DFI
Senior Fellow Graduate Fellow with over six months of experience working with DFI
External Users Users that are interacting with the Map
Internal Users Project Managers, Graduate Fellows, and DFI Leadership
Drupal
In order to complete this project, I had to learn how to use Drupal. In order to do so, I watched Drupal training and tutorial videos via Lynda.com, an online platform providing courses spanning many disciplines.21 After developing a solid foundation of Drupal modules and
functionality, any troubleshooting often started with reading module documentations, watching YouTube videos and occasionally asking questions on Reddit (see Appendix A), an online forum that contains sub-forums, called subreddits.22 If I could not find the answer through those sources,
I would reach out to Lindsay Hoyt. The major components of a website are identified in the table below (McCourt & McCourt, 2011). The design process will be discussed further in the Design &
Development Process section of this paper; however, Table 7 summarizes the basic needs for the project’s website.
Table 7: General Website Components
Component Description
Identification Information Site name for each web page Path Structure Text-based URL for each web page
Core Navigation Primary Menu for each web page for website navigation
School of Government Microsite and DFI Metrics Site
The School of Government’s website and the DFI Metrics website were edited through Drupal. The primary and secondary domain names are unc.edu and sog, respectively, to form sog.unc.edu. DFI’s web page is part of the SOG website and is identified as a microsite.23 Figure
5 indicates the location of the three deliverables which are found on the Drupal development site.24 While the map is accessible External Users, the Web Form and Web Form Views will only
be accessible to Internal Users that have a login (username and password). I created the logins for all internal users. There are two user-types on the Development Site: administrator and
authenticated user. The administrator has full capacity to make changes to the DFI Metrics website while an authenticated user does not. Authenticated users can however view charts and graphs (created by administrator) and complete and edit Web Forms. The administrator will have edit access to all completed Web Forms. During this project, I was the only administrator and additional Internal Users provided access were all authenticated users. I worked on a development site initially which I accessed via the development environment (http://www.dev.dfi.sog.unc.edu). The only connection made between the DFI microsite and this DFI Metrics site was a link in the Map to case studies found on the DFI microsite.
23 Access SOG microsite here, https://www.sog.unc.edu/resources/microsites/development-finance-initiative
Figure 5: Location of Project Deliverables and Linking to DFI Microsite
Web Form
The Web Form is the most critical deliverable of this project because the Web Form Views’ and Map all rely on Web Form submission data. This will be tracked through the completion of a Drupal web form. The web form submissions are automatically backed up in a Drupal database.
There are four major sections to the Web Form: community overview, parcel analysis, market analysis, and financial analysis (see Table 8). A Drupal database is automatically
populated by Web Form submissions. The data for the web form comes from various documents, PowerPoint presentations, and Excel files found in Asana and Dropbox. Project managers have access to project folders that they have managed or are currently managing. If project managers requested graduate Fellows to assist with filling out the web form, project managers would invite Fellows to their respective Dropbox project folders to provide access.
In order to test the critical success factors for the Web Form, a usability test was
conducted. After the usability tests were completed, the Web Form was edited per suggestions or SOG Microsite
Case Studies
DFI Metrics Site
Web Form Web Form Views Map
Table 8: Web Form Questions Overview
Web Form Section Number of Questions % of Total
Community Overview 62 28%
Parcel Analysis 126 57%
Market Analysis 18 8%
Financial Analysis 14 7%
issues noted during the tests. Additionally, the Web Form was reviewed by Project Managers to provide additional input following the usability test. Participants were emailed and asked to volunteer (see Appendix B).
Web Form Views
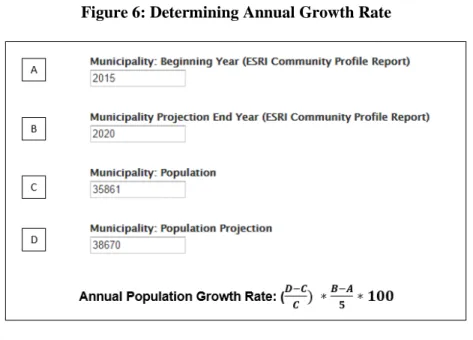
The Web Form Views pertain to the four major sections of the Web Form. While there are over 200 questions in the Web Form, there were significantly fewer data points shown in the Web Form Views because the Web Form frequently includes multiple questions that pertain to one data point. For example, in Figure 6, there are four questions that pertain to one specific data point that DFI is seeking, the annual population growth rate in the municipality. Using a global math expression, a field type in the Drupal Views module, I created custom fields using other field types as replacement patterns and entered those replacement patterns to create a formula for annual population growth rate. The Web Form Views can display summary information for each of the five sections in both graphs and tables. Displaying the information in a graph required an additional Drupal module Charts,25 which allows Drupal content to be viewed in a graph rendered
by Google Charts. The information presented in the Web Form Views was up to my discretion during the project phase. Until DFI has an opportunity to spend more time navigating and utilizing the DFI Metrics site, I created Web Form Views with information that I found most pertinent for DFI. Additionally, one of my goals with the Web Form Views was to showcase different capabilities that the Web Form Views such as sorting columns, filtering information, and linking to the actual Web Forms. After Internal Users have an opportunity to spend more time on the DFI Metrics website during the post-project phase (following the completion of this master’s project), additional input will be provided to the administrator of the DFI Metrics website.
Figure 6: Determining Annual Growth Rate
Map
The map was developed via Geofield, a Drupal module.26 The Geofield module will be
used to plot projects on the map created in the online application. The map has two main External User experience requirements. The first was that they should be able to identify where DFI’s ongoing and past projects are on the map. And the second was that they should be able to click on a project marker to learn more about that project. In order to map out the projects via Geofield, the project site address will be a field in the Web Form (see Figure 7).
Figure 7: Web Form Site Address Fieldset
Timeline
Table 9 presents the timeline employed and followed for this project. Initially, there were additional check-in meetings scheduled with DFI; however, after the Project Manager overseeing the project left DFI, I had to plan to present to all DFI Project Managers and Leadership to get feedback during the project phase in one meeting. Total, I spent approximately 110 hours developing and completing all three deliverables. That includes information gathering, development, feedback meetings, and analysis.
DESIGN & DEVELOPMENT PROCESS
The following section describes in-depth the design decisions and development processes undertaken for this project organized by the three deliverables. Initially, when the project was first proposed, there was no intent to create a new website but to build off the current DFI microsite. However, since the information collected and displayed was primarily internal to DFI, a separate site was created. In order to determine DFI’s requirements, I interviewed the Associate Director in February 2016. Through this interview, DFI provided me limited specifications to build a project based off of DFI’s relatively broad requirements that were not specific to a
particular medium as long as the medium was able to deliver on DFI’s requirements. Once design decisions were in place, I built the deliverables with support from the School of Government. DFI’s requirements have been met through the three deliverables identified for this project. I
Table 9: Deliverable Timeline
Event By Date Hours Spent
Conduct Pilot Usability Test 9/16/2016 3
Conduct Usability Tests 9/23/2016 10
Project Manager Meeting to review Web Form, Web Form, Views, and Map
9/27/2016 2
Complete Web Form 10/4/2016 40
Complete Web Form Views 10/11/2016 30
Complete Draft Map 10/11/2016 15
Complete Map 10/18/2016 10
Deliverable Completion 10/18/2016
created all the content and navigation of the site; however, if there were technical issues that could not be solved, Lindsay Hoyt from the SOG, intervened to solve the situation that typically required access to part of the site that I could not access.
Drupal
The three deliverables have been specifically developed in Drupal 7. Drupal has been the content management system for SOG for over three years now.27 The School of Government is
still working on migrating all their Drupal 6 content to Drupal 7. Once that is complete and Drupal 8 becomes more stable and waiting for additional Drupal 8 updates before the migration to Drupal 8. All modules used for the three deliverables are currently supported in Drupal 8, a critical component when I was choosing which modules to use to complete this project. Website Navigation
There are two primary menus for internal users, a user menu and main menu (see Figure 8). The main menu displays at the top as header tabs. To make it as simple as possible to navigate to the Web Form, the two Main Menu links are: Take DFI Metrics Survey and Edit DFI Metrics Survey. One key field displayed in the Edit DFI Metrics Survey page is a rendered content node that links to an editable Web Form if the user that created the Web Form is logged in (see Figure 9). If not, internal users will only be able to view Web Forms but not edit.
Web Form Design
There are two sets of requirements for the Web Form with the first being DFI and the second being the School of Government. DFI’s requirements have to do primarily with the ability to collect and analyze information in an easy manner. The three deliverables identified in this project fit DFI’s broad requirements. More specifically for the Web Form, DFI’s requirements include the following items:
• DFI needs the Web Form to allow for saving answers and returning to Web Forms at later
time;
• DFI needs the structure of the Web Form deliverable to allow for multiple Web Forms to
be taken simultaneously for different projects;
• DFI needs the structure of the Web Form to allow for reports based off the data collected
in the Web Form to be generated; and
• DFI needs the information collected to be stored securely.
Based on this set of requirements, I decided to work with the School of Government to build another DFI site that could accommodate DFI’s needs. In addition to being able to accommodate all those needs, there would be additional support from the SOG to develop a more sustainable project. In order to work with the School of Government, I had to provide justification to the IT Division that this project was necessary and fit within the scope of the SOG. Since this project benefits DFI and DFI is a program out of the SOG, the website creation and support was deemed justifiable by Brian Fodrey, the Assistant Dean for Information Technology at the SOG. I was then connected with Lindsay Hoyt who was assigned to this project. Lindsay spent approximately twenty-five hours on website setup and she envisions to spend under an hour a week to conduct any needed maintenance.28
Figure 9: Website Snapshot – Edit DFI Metrics Survey
Web Form Development
The major design decisions regarding the creation of the Web Form in Drupal concerned the module chosen to the build the Web Form and the layout of the Web Form. There were three modules that were considered for the development of the Web Form (see Table 10).
In Summer 2016, I decided to use the Webform method versus CCK. While this method required the use of additional modules, the ease of constructing the Web Form was preferred. Despite the advantages of Webform, creating the Web Form took still approximately eight hours indicating the importance of creating the Web Form that allows for easy customization once built. The length of time needed to create the Webform was caused by the way the Webform had to be saved. Anytime a Webform component was added, the Webform had to be saved. After adding about fifty Webform components (or field), every additional component took anywhere between twenty and thirty seconds to save. Also, one component that exaggerated this process was the use of a field-set. A field-set contained a subset of questions and allowed for better visual
organization. However, after completing the Webform, any additional changes could only be made in one field-set per every save. Thus, even minute changes such as the component label became a tedious and elongated process. Moreover, in order to post any content that pulls information out of the Webform submissions, there were additional steps that had to be taken.
2) Left join primary key (submission ID) of data table with primary key of Webform submission
3) Create view to display Webform submission data
Table 10: Pros and Cons of Modules for Web Form Development
Primary Modules Needed
Description Pros Cons
1) Webform 2) Data 3) Webform UI 4) Webform
MySQL Views 5) Views
In order to pair Views with Webform,
Webform MySQL Views is necessary so that Webform submissions will have custom access for use in Views/
• Simpler and more attractive layout for building and editing Web Form with over 100 questions • Built-in support for
needed Webform components such as markup
• Built-in analysis tools
• Ran into syncing issues with the module Views that cannot be replaced • Cannot have
custom access to Webform submissions without using additional modules 1) Content Construction Kit (CCK) 2) Views
Allows those with administrative permission to “add custom fields to nodes using a web browser” (yched, 2006)
• Each submission is readily accessible through Views without additional modules
• Over 113,000 installs (yched, 2006)
• Part of Drupal Core which is a bundle of modules that are installed when installing Drupal
(Drupal, 2003)
• Less attractive and functional layout for building a long survey
1) Qualtrics 2) Views
Qualtrics module that integrates with Drupal
• Original Web Form built in Qualtrics
• Module not well supported as there are only 2 sites currently using module (Vincenzo, 2012)
were changed, the submission data could be displayed. This was where the more critical issue occurred, changes to the Webform were not being reflected in the Views module. For example, after changing the machine name and field name, when searching for the field in the Views module, neither the machine nor field names were updated making it difficult to search for the right fields that were needed to be displayed. In troubleshooting, I attempted to solve this issue by flushing the cache and creating a new view. However, neither those steps solved the issue. Cloning the Webform did solve the issue eventually but after spending as much time as had already been spent, I decided to recreate the Web Form via CCK (Appendix C).
The CCK route proved much more effective and less prone to errors than the Webform route despite the greater ease of developing the Web Form via Webform and Webform UI. After the development of the Web Form, the content type submissions could be accessed via Views without the need for any additional relationships and changes in the Web Form were immediately changed in the display via Views. An additional module was added, Markup, so that markup fields could be added to the Web Form. As noted earlier with the Webform module, after about fifty fields were added, it took about twenty to thirty seconds to save and every new field required a new save. I spent approximately ten hours to create the Web Form using CCK versus eight hours using Webform. Despite this process taking longer, creating the Web Form Views became a much smoother process as no errors noted with Webform have been encountered yet using CCK.
Web Form Views Design
The Web Form Views, the second deliverable of this project, are summary reports of the data collected from the Web Form through the Views module. DFI’s requirements for the Web Form Views include the following items:
I did not consider any additional module to display the CCK content because Views is part of Drupal’s core set of modules and is integral to most Drupal websites as it interacts with many different modules.
Web Form Views Development
I created four views to display information per the major sections of the Web Form including views for the community overview, parcel analysis, market analysis, and financial analysis. The views were simple to create with the integration of the CCK module and the Views module. With Views, I could add fields that I included in the Web Form using the CCK module in the Views module. When creating the Web Form, I decided to add fields that requested absolute numbers rather than growth rates for example. Not only could this potentially limit human error, DFI will also have a record of the absolute numbers which could be more useful when analyzing past projects. Any growth rates or land value per acre for example could easily be added to the display by creating a new field and adding a math expression within Views.
Moreover, through the use of the module, Better Exposed Filters,29 internal users will be able to
filter out projects based on certain criteria. There are potentially other modules that could add to the Web Form Views but what has been created meets DFI’s current needs.
Map Design
DFI provided less guidance for the Map primarily because this particular deliverable was influenced by my own perception of the limited supply of information on DFI projects on the web. After discussing the need for more project information on the web with project managers and leadership, DFI decided that the primary features necessary would be again to filter projects based on certain criteria and potentially have the map publically available to external users. The most important criteria from DFI’s perspective was to be able to funnel in information directly from the Web Form submissions so no additional information needed to be duplicated.
Map Development
I considered two modules for the development of a map: Geofield Map and Leaflet.30 In
order to use either module, an address field that could be geolocated with Google’s API was necessary. The choice to use Google’s API was uncontested by DFI staff because they were all comfortable with Google Maps navigation and site. With Geofield Map, custom fields can be made similarly to the addition of math expressions using tokens that represent content fields. The main functional criteria for the Map were to display markers for projects, show custom content per each marker, and filter projects. Geofield Map is limited beyond that scope; however, Leaflet allows for much more customization and allows for shading of custom boundaries which could become a valuable feature in the future. For example, when a project manager or fellow conducts a parcel analysis, she will use ArcMap to create shapefiles of study areas. With Leaflet, those study areas could be uploaded via Leaflet if the shapefiles are
converted to GeoJSON files. Until DFI has had an opportunity to utilize the Map and see value in building out its potential even further, the Leaflet map was not fully built out for this master’s project.
Usability Test
Usability.gov is a resource for user experience best practices for practitioners and students. The content on the website is managed by the Digital Communications Division of the U.S. Department of Health and Human Services’ (HHS) Office of the Assistant Secretary for Public Affairs. To gather the content for the site, HHS collaborates with federal, private, and public sector agencies (U.S. Department of Health and Human Services, 2016). The usability test was piloted with a DFI Project Manager to ensure that any issues related to survey design and instructions are smoothened prior to the usability testing period. The following elements of a usability test plan come directly from HHS.
• Scope: The usability tests lasted one hour to cover the DFI Metrics Web Form. Even if
the web form was not complete at the end of the hour, the usability test periods did not last longer than an hour per participant. Following the usability tests, there was an additional twenty minutes allotted for additional questions and input from the participants.
• Purpose: The goal was to identify the difficulties in completing the Web Form across
different participant types and improve the Web Form based on the questions and comments that arise from participants completing the Web Form.
• Participants: The participants for this usability test included at least of one of the
following: one senior fellow and one junior fellow.
The usability test was conducted using the Current Think Aloud model. In this model participants verbalize their thoughts, questions, and difficulties while completing the Web Form, unlike Retrospective Think Aloud in which participants verbalize their thoughts after completing the usability test (CHI, 2006). Since the Web Form is intended to be completed independently through searching past documents or presentations and researching answers online where told explicitly in the Web Form, there was always going to interference from a participants’ thoughts and actions while taking the Web Form. This particular usability test contrasts from typical usability tests on products, software, or information retrieval related tasks. Depending on the level of knowledge a participant has in real estate, the jargon and acronyms may have led to a higher cognitive load during the usability test. Since this Web Form requires a greater cognitive load than another simpler survey, CTA was a more apt methodology based on available research (CHI, 2006, van den Haak, De Jong, & Schellens, 2003).
their respective projects. I asked participants to choose a project in which there is parcel and market analysis information available. The goal of this usability is to identify the following information:
• Approximately how long will it take for a senior fellow, junior fellow, or project manager
to complete the Web Form? Since DFI wants the Web Form completed for past projects without burdening project managers, this usability test served as a barometer for
determining the likelihood of the familiarity with a project needed to complete a Web Form.
• Are there poorly worded questions or difficulties that arise from insufficient instructions
in the Web Form? If the Web Form can be completed by new fellows, the more
successful this Web Form becomes because project managers and even senior fellows are not as burdened simultaneously providing new fellows an opportunity to better
understand DFI’s processes.
The usability tests were primarily conducted in DFI’s conference room. Participants used their own laptops to complete the Web Form and participants’ laptop displays’ were duplicated so that I could view the participants’ decisions as they completed the Web Form. I needed to see where participants are searching for information so monitor duplication was a key component of the usability test.
method is likely to interfere with a more methodologically accurate use of retrospective probing (Bergstrom, 2013).
RESULTS
Through feedback from a DFI Project Manager meeting as well as usability testing sessions, I was able to refine the deliverables for this master’s project. The DFI Project Manager meeting occurred in early October 2016 after the usability tests had been completed. Additionaly, at this point I had already created the general framework of the Web Form, Web Form Views, and Map and was ready for an initial feedback session. The goal of that meeting was to ensure that my project was progressing towards a result that DFI sought and could benefit from. Overall, the feedback had been positive and Project Managers and Leaderhip were eager to see this website at its fullest potential following the completion of this master’s project.
Usability Testing Discussion
Prior to completing the usability testing sessions, I completed a pilot test with a DFI Project Manager. A pilot testing session is beneficial prior to conducting usability tests because the session could lead “to more reliable results” and “validate the wording of the tasks” (Schade, 2015). The pilot test was conducted in DFI’s office in Durham. The project manager provided the following feedback: there were not enough instructions for more time intensive tasks and that were not enough visual cues for the type of information sought out. For example, in the Web Form, is a question regarding New Market Tax Credits, the initial wording and additional
parcel analyses. With the latter, it led to the development of a parcel analysis template which I created to mimic the layout and questions in the Web Form.
After completing the pilot test, I made several changes to the Web Form and completed the usability tests the following week. I completed four usability tests, two with Junior Fellows and two with Senior Fellows. Two of those tests were completed at the DFI office in Durham while the other two were completed in an office in the School of Government. The two completed in Durham were with Senior Fellows and they both duplicated their screens on the external TVs while the two completed at the School of Government required me to sit next to the participants so I could monitor and document their actions. All four used their own laptops.
Figure 10: Pilot Study Refinement Example
Table 11 summarizes the main findings from the four usability testing sessions. The usability sessions occurred a week after the pilot test and all had been completed within a week. To maintain consistency, no changes had been made during that week to the Web Form. The usability tests lasted at most one hour and thirty minutes, the last twenty to thirty used for
additional probing questions and opportunity for the Fellow to provide additional feedback. If the Fellow was spending too long on a particular section, I had urged them to move to a different
FROM CDFI: Historically, low-income communities experience a lack of investment, as evidenced by vacant commercial properties, outdated manufacturing facilities, and inadequate access to education and healthcare service providers. The New Market Tax Credit Program (NMTC Program) aims to break this cycle of disinvestment by attracting the private investment necessary to reinvigorate struggling local economies. We asked for the county tier earlier primarily because funders of DFI typically request how many projects we have in Tier I, II, and III counties. However, county tiers are not necessarily the best indicator of economic distress because a county can contain wealthy and distressed communities. By answering this question, DFI will be able to get a better sense of whether our projects are located in economically distressed areas.