Design practitioners have long believed that web interfaces are at a disadvantage
compared to desktop interfaces because the web page model may cause change blindness more than non-page based interfaces. To evaluate this concern, a within-subjects
experiment was set up to test various change types in a mock web application. User performance was better when a page loaded as normal and when elements changed instantly on screen compared to a half-second flicker change type. However, change detection rates were only 5% greater and response times only 0.1 second faster for the instant change compared to page loading. This shows that there is some change blindness effect due to the Web’s page-by-page architecture, but it is not nearly as disconcerting as practitioners have long believed. Furthermore, single page applications that minimize full-page refreshes may help reduce the incidence of change blindness on the web.
Headings:
by
Michael E. Head
A Master’s paper submitted to the faculty of the School of Information and Library Science of the University of North Carolina at Chapel Hill
in partial fulfillment of the requirements for the degree of Master of Science in
InformationScience.
Chapel Hill, North Carolina April 2015
Approved by
I
NTRODUCTION
Change Blindness
Imagine looking at a digital photograph of two men standing side by side, each wearing suits and top hats of different colors and styles. Now, imagine that the men’s hats are swapped in the photograph while you are looking at it. Do you think you would notice such a change? Intuitively, most people would assume they could recognize such a change. In reality, though, there is good evidence to the contrary. In fact, the psychologist John Grimes (1996) showed that it is possible to make such a change to a photograph and 100% of viewers will not notice the change. In this case, the change was made during an eye saccade, a movement of the eye that happens between fixations.
person’s view of a scene is obstructed for half a second, during which a change occurs. Often, people fail to detect most changes during such a sequence.
Change Blindness in HCI
The discovery of change blindness in the field of psychology eventually caught the attention of system designers in the Human-Computer Interaction (HCI) world. In a 2001 SIGCHI Bulletin, editor William Hudson cited the need to design systems that
specifically compensate for change blindness and, in 2011, Bill Scott (Director of UI Engineering at Netflix at the time) reiterated this concern in his presentation at the User Interface Engineering 16 Conference.
Figure 1: Rensink’s (2005) one-shot paradigm on the left; web page loading on the right
A more realistic example can be visualized using webpagetest.org. This site shows a “film strip” of a web page loading in a browser with an empty cache. In Figure 2, it’s apparent that the web page loads after almost 1.5 seconds of blank screen.
Figure 2: A “film strip” view of a web page loading on webpagetest.org [http://www.webpagetest.org/result/150310_X9_16D0/]
The concern among designers and HCI practitioners is that the blank screens preceding a web page loading function similarly to Rensink’s one-shot paradigm. This is not as big of a concern for “continuous” interfaces, such as desktop and mobile applications, which do not rely on the page metaphor used on the web.
If users fail to notice changes in an interface, the effect can range from innocuous, such as the time an employee wastes when searching for a link on a company website, to
Initial page
possibly life-threatening, as when a pilot misses a particular setting in an interface
(Varakin, Levin, & Fidler, 2008). If the web is more prone to change blindness than other interfaces, then user interface designers need to be aware of the causes and remedies for the phenomenon.
Several studies in HCI have shown that non-web interfaces are very prone to change blindness effects. Huhtala, Mäntyjärvi, Ahtinen, Ventä, & Isomursu (2009) showed that users of a mobile application experienced change blindness in an emulated smart
environment, where icons changed as the user moved from one physical space to another. Davies and Beeharee (2012) similarly showed that users were change-blind to icons on a mobile device where the test application was built to emulate a grid of icons similar to standard iPhone and Android interfaces. The Davies et al. study was conducted using a native application on a mobile device. The research presented here is based on a similar experimental design, but applied to the web.
Other studies have explored change blindness in desktop or workstation interfaces, too. Durlach and Chen (2003) studied military staff using the Force XXI Battle Command Brigade and Below system (FBCB2) and how overlaying windows in the interface may induce change blindness. They found that visually obscuring changes dropped detection rates from 90% to 50%, indicating a large change blindness effect.
must happen in higher latency applications with longer feedback loops, such as those built for the web. Part of the impetus for this research is to confirm this underlying assumption among researchers and practitioners.
Research Focus
L
ITERATURE
REVIEW
Change Blindness in
Psychology
There has been considerable research done on the phenomenon of change blindness in general, with slightly less, but still significant, amounts of work done on this topic in the context of UI design. Change blindness as it applies to UI design is the scope for the following review.
Change blindness is often defined in psychology literature as failing to notice even large changes in a scene due to a visual disruption (Rensink, 2000). A visual disruption may be an eye movement, the blink of an eye, or the flash of a screen (Rensink, 2005). The changes that go unnoticed can be somewhat large, for example a building in a photograph increases in size by 25%, or 33% of the birds in a photograph with 30 birds are removed (Grimes, 1996).
Aside from a visual disruption, there are other factors that impact a person’s ability to detect changes in a scene. Saliency, or the degree to which an object stands out from its surrounding, is a key factor in change detection. An object that is instantly deleted or added to a scene is more often detected than an object that changes slowly or
Werner & Thies (2000), participants who were more knowledgeable about football were able to detect changes in images of football formations more easily than those less familiar with football.
The aforementioned research was all conducted in a controlled laboratory setting. At least one experiment has shown that change blindness can and does occur in the “real world”. Simons & Levin (1998) performed an experiment where a researcher starts a
conversation with a participant and, in the middle of the conversation, the participant’s view is briefly disrupted by a door (being carried by some research assistants) while the researcher is replaced with a different person. On average, 50% of participants failed to notice their conversation partner had changed.
Change Blindness in HCI
Other disciplines, such as HCI and Human Factors, eventually picked up on the
significance of the change blindness phenomenon in their own domains. Hudson (2001) wrote that designers must “design for the grand illusion” and take into account that vision is not continuous. Hudson even pointed to the web as being at a disadvantage compared to desktop applications, due to its brief screen “flash” between web pages.
experiment they changed up to 4 attributes simultaneously (color, orientation, speed, and contrast) and still some participants failed to notice a change in a scene.
The research by Beeharee et al. would suggest that even changing several attributes of an element at once does not help to reduce change blindness, but other research has shown that users are actually very capable of detecting small changes when there is no visual disruption. In Durlach & Chen (2003), participants detected 90% of changes to a single icon on a digital military system UI when there was no change in screen activity for 5 seconds leading up to the change. Participants in Davies et al. (2012) were able to detect a change in a single icon out of 20 icons with no visual disruption 93% of the time. DiVita, Obermeyer, Nygren, & Linville (2004) conducted research on change blindness when using naval combat information displays. In their experiment, participants were asked to respond to changes on a primary combat display while occasionally
attending to a second display where notifications would appear. For example, if an aircraft had changed its course, then an alert about an aircraft having changed course would appear on the second display and the primary display would go blank until the alert was acknowledged by the participant. Though the primary display screen
“blanking” was artificial in this experimental context, its occurrence, along with the requirement of attending to a second display, caused participants to fail to detect the changed item on their first try 33% of the time.
In the aforementioned study by DiVita et al. (2004), all the participants had at least 2 years of experience in their field. This indicates that the notion that domain
are relevant to the task at hand, users can still be blind to changes that happen in interfaces.
Change Blindness on the Web
The web as a platform plays an integral role in both commercial and non-commercial life today, and this role will only continue to increase. The web is also becoming a platform for Software-as-a-Service (SaaS) and the storage of massive amounts of data in the “cloud” (Woods, 2014). With the increase in SaaS and cloud services, more web
applications will be created to access them and may one day overtake desktop or mobile applications as the primary applications in users’ lives.
If the usage of web applications increases, it’s important to know if there is a built-in limitation to the web page model when it comes to the user experience. The following research sets out to expand our knowledge of change blindness in web page loading to determine if the problem exists and whether there is a means to mitigate it through the use of instantaneous updates in the browser.
Hypotheses
This research explores how traditional web page loading causes change blindness, whether page loading alters the likelihood of change blindness occurring, and whether instantaneous changes without a page load decrease change blindness. These goals can be summarized with the following hypotheses:
2. Instantaneously changing elements on a page decreases the likelihood of change blindness significantly more than a page load.
M
ETHODOLOGY
1. Design
1.1 Independent Variables
1.1.1 Change Type
Change type was a categorical independent variable with 3 possible values: flicker, page load, and instant.
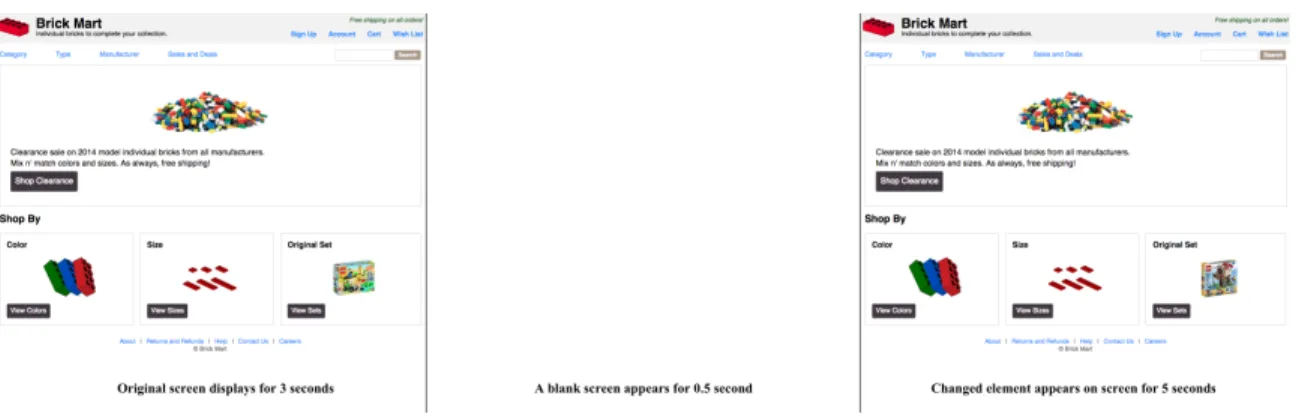
“Flicker” (Figure 3): This change type served as a control as it is the most similar to Rensink’s (2005) one-shot paradigm. JavaScript was used to hide the content of the page for half a second while a change happened in one of the 5 change locations. After half a second, the page would show again with its changed element.
Figure 3: “Flicker” change type example with image changing in Original Set block.
was presented to participants as any normal web page in their browser would be, meaning its rendering and loading time were based on the participant’s bandwidth, browser,
operating system, and so on.
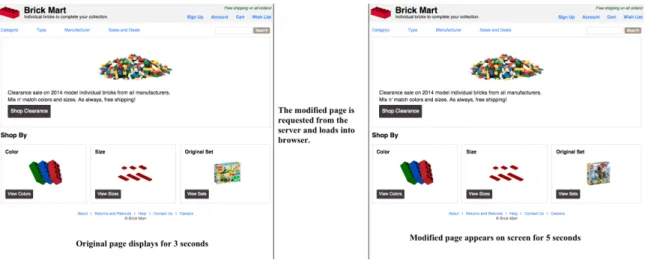
Figure 4: Page load change type example with image changing in Original Set block.
“Instant” (Figure 5): One of the 5 elements on the page change instantaneously. There is no blank screen or page reload involved.
1.1.2 Page Type
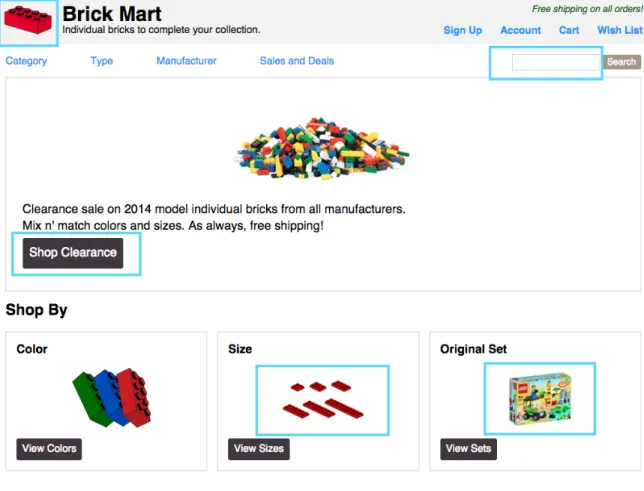
Page type was a categorical controlled variable that represented the style of layout for the page shown to a participant during a trial. The page types were: Home page (Figure 6), Category page (Figure 7), and Product page (Figure 8). The pages were intended to be visually similar to prototypical e-commerce website pages, to provide a realistic environment for participants.
1.1.3 Change Location
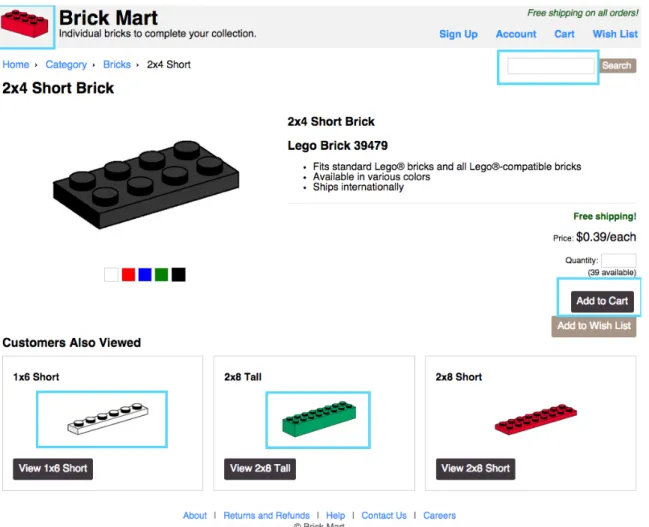
Figure 8: Change locations on the Product page type
The change locations are described for each page type as follows: Home Page
• Logo: The logo icon could change from red to blue
• Search Box: The empty search box could be populated with placeholder text
• Button: The “Shop Clearance” button text could change to “View the Sales”
• Image 1: The image in the Original Set block could change to another image • Image 2: The image in the Size block could change from red to white
Category Page
• Search Box: The empty search box could be populated with placeholder text
• Button: The “Shop 2x2 Tall” button text could change to “Best Sellers”
• Image 1: The image in the 2x4 Short block could change from white to red • Image 2: The image in the 1x4 Tall block could flip horizontally
Product Page
• Logo: The logo icon could change from red to blue
• Search Box: The empty search box could be populated with placeholder text
• Button: The “Add to Cart” button text could change to “Put in Cart” • Image 1: The image in the 2x8 Tall block could change from green to gray • Image 2: The image in the 1x6 Short block could flip horizontally
1.2 Dependent Variables
1.2.1 Change Detection
Change detection was a categorical dependent variable measuring the status of a
participant’s response. Change detection had three values: correct, incorrect, or timeout. “Correct” designated that the user selected the correct element that had changed during the trial before the 5-second timer expired. “Incorrect” designated that the user selected the wrong element during a trial before the 5-second timer expired. “Timeout” designated that the user did not select an element before the 5-second timer expired.
1.2.2 Response Time
the element was changed and finished when either a participant selected an element (whether correct or incorrect) or when the timer expired for that trial.
1.4 Experiment Design
The experimental design was a 3x3x5 within-subjects design for all 3 independent variables with the following restrictions for choosing levels of the 3 variables:
1. Each participant was assigned 30 trials 2. Each of the 3 change types occurred 10 times 3. Each of the 3 page types occurred 10 times 4. Each of the 5 change locations occurred 6 times
5. The combination of change type by page type by change location was selected at random per trial for each participant
2. Participants
A convenience sample of 32 Internet users were recruited through social media, email subscription lists, and word of mouth. The sampling was done through snowballing where each participant was asked to share the test with people they knew to gather more participants. An additional 100 participants were recruited through Amazon Mechanical Turk. Mechanical Turk participants were paid whereas volunteers found through other channels were not.
A brief questionnaire was shown to participants after all 30 trials were completed that asked for age range, preferred browser, and number of hours using a web browser each day (Appendix, Figure 22). Ages for participants skewed young, with the largest group (25-34) consisting of roughly 50% of the participants (Appendix, Table 4).
3. Web Application
A web application was created to test different change types that may induce change blindness. Participants were shown webpages from a mock website where an element on each page would change in some fashion. To add some realism to the experiment, the webpages were created to resemble a prototypical e-commerce site with a “home page” (Figure 6), a “category page” (Figure 7), and a “product page” (Figure 8). On each page, one of 5 elements in different change locations could change on a given trial.
4. Proced
ure
The overall procedure is similar to that used by Davies and Beeharee (2012) in their research on change blindness in mobile devices.
Participants were asked to visit a URL [http://cbstudy.info] to take part in the study. The home page of the site contained the informed consent form and required participants to click a button to designate they gave consent to participate (Appendix, Figure 15). The first few pages of the test website contained instructions and a practice change blindness test (Appendix, Figures 16-20). When the participant clicked “Continue to First Trial”, the trials began. Each test session lasted 30 trials. Each trial consisted of the same sequence:
2. The page remained visible for 3 seconds
3. One of the elements on the page changed according to the change type for that trial
4. After the change, a 5 second timer was started, giving the participant 5 seconds to select the element that had changed
R
ESULTS
1.
Data Filtering
Data was collected from February 23rd to March 6th, 2015. One hundred fifty six
participants completed at least one trial, for a total of 4002 trials. Data for 34 participants was omitted from analysis because of failure to complete at least half the trials or outliers with response times. The remaining analysis is performed on a set of data consisting of 122 participants with 3444 trials among them. In the analysis, incorrect trials are those trials where the participant selected the wrong item after a change or failed to select an item within the given amount of time, unless otherwise noted.
2
.
Change Detection Accuracy
2.1 Change Type
Figure 9: Change detection accuracy by change type.
A post-hoc test using Nemenyi’s critical difference showed a significant difference between the flicker change type and the page load change type (α = 0.01, DF = 1), as well as the flicker change type and the instant change (α = 0.01, DF = 1), but not between the page load change type and the instant change type. This means that participants were able to detect changes more accurately in the page load change type and the instant change type than in the flicker change type. However, there was no difference in detection accuracy between the instant change type and page load change type.
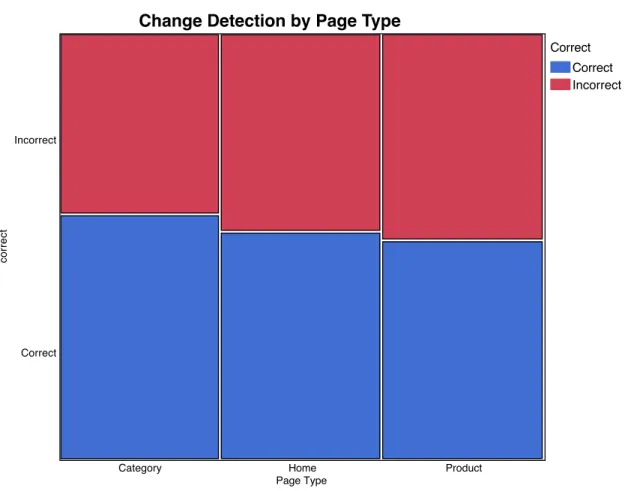
2.2 Page Type
The Category page type had the highest correct detection rate at 57.72%. The Home page type had the next highest correct detection rate at 53.5%. The Product page type had the
Correct Correct Incorrect
Change Detection by Change Type
Change Type
Flicker Instant Page Load
correct
lowest correct detection rate at 51.5%. Figure 10 shows the change detection rates for each page type. The Friedman test showed the difference in detection accuracy between the 3 levels of page type was significant (p < 0.01).
Figure 10: Change detection accuracy by page type.
The Nemenyi critical difference also showed a significant difference between the category page type and home page type (α = 0.01, DF = 1), and the category page type and product page type (α = 0.01, DF = 1), but not between the home and product page types. This means change detection accuracy was most similar between the home page type and the product page type, but accuracy rates were different for the category page type compared to the other two types.
Correct Correct Incorrect Change Detection by Page Type
Page Type
Category Home Product
correct
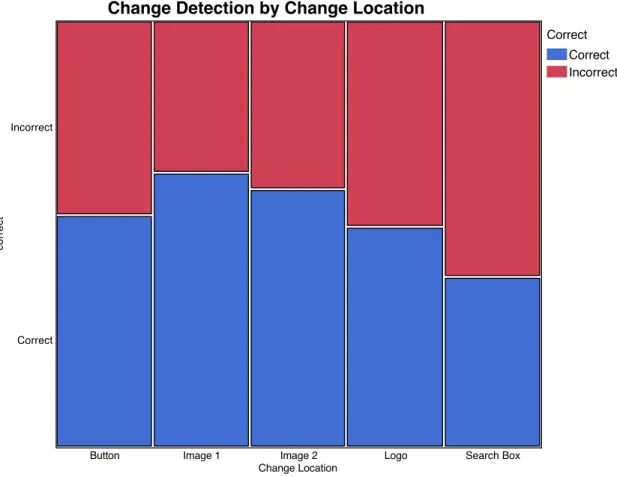
2.3 Change Location
Change detection rates were highest for the changes in the content area. Image 1 and Image 2 had correct detection rates of 64.33% and 60.58%, respectively. The Button location had a correct detection rate of 54.46%. The Logo location had a correct detection rate of 51.87%. The Search Box location had the lowest correct detection rate at 40%. Figure 11 shows the change detection rates for each change location. The Friedman test showed the difference in detection accuracy between the 5 levels of change location was significant (p < 0.01).
Figure 11: Change detection accuracy by change location.
The Nemenyi critical difference also showed a significant difference between some change locations compared to other change locations. There was a significant difference between the logo location and the search box location (α = 0.01, DF = 1). There was also
Correct Correct Incorrect
Change Detection by Change Location
Change Location
Button Image 1 Image 2 Logo Search Box
correct
a significant difference between the search box location and the button location (α = 0.01, DF = 1), the search box location and the image 1 location (α = 0.01, DF = 1), and the search box location and the image 2 location (α = 0.01, DF = 1). This means that change detection accuracy rates were similar between the logo and the content area locations, but not between the search box and the content area. Also, all content area locations had similar change detection accuracy rates.
3
.
Response Time
Response times were analyzed on correct trials only. The response times ranged from 585 milliseconds to 4921 milliseconds. A linear regression model was created to assess the significance of change type, page type, and change location.
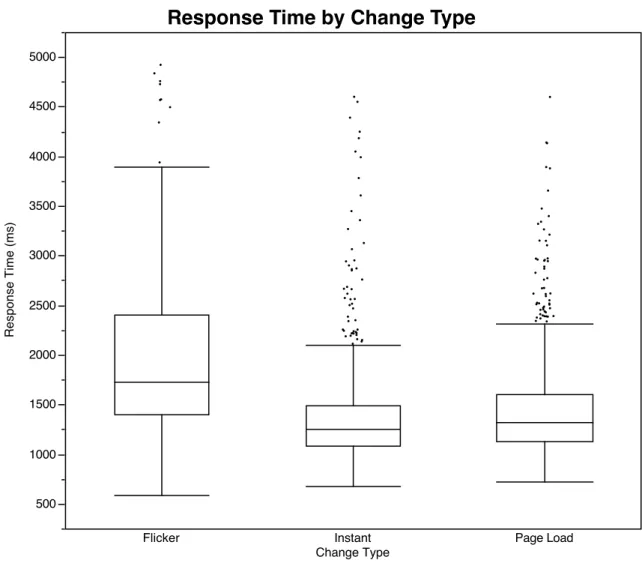
3.1 Change Type
Figure 12: Distribution of response times by change type.
The mean and median response times for each change type are listed in Table 1.
Mean (milliseconds) Median (milliseconds)
Flicker 2002 1724
Page Load 1451 1321
Instant 1369 1252
Table 1: Mean and median response times by change type.
3.2 Page Type
In the linear regression model, response times were significantly different between some pairs of page types. For response time, the product and home page types were
Response Time by Change Type
Change Type
Flicker Instant Page Load
Response Time (ms)
significantly different, and the category and product pages were significantly different, while the home page and category page types were not significantly different from one another. Figure 13 shows the distribution of response times for each page type.
Figure 13: Distribution of response times by page type.
The mean and median response times for each page type are listed in Table 2.
Mean (milliseconds) Median (milliseconds)
Home 1468 1311
Category 1421 1263
Product 1526 1361
Table 2: Mean and median response times by page type.
Response Time by Page Type
Page Type
Category Home Product
Response Time (ms)
3.3 Change Location
In the linear regression model, some change locations were significant (p < 0.01) with regard to response times when compared to other change locations. The logo and search box were significantly different from the 3 content area changes, but they were not significantly different from each other. The button change location was also significantly different than the two image location changes. Figure 14 shows the distribution of response times for each change location.
Figure 14: Distribution of response times by change location.
The mean and median response times for each change location are listed in Table 3.
Response Time by Change Location
Change Location
Button Image 1 Image 2 Logo Search Box
Response Time (ms)
Mean (milliseconds) Median (milliseconds)
Button 1397 1232
Image 1 1387 1252
Image 2 1331 1199
Logo 1670 1496
Search Box 1652 1486
DISCUSSION
1. Change Detection Accuracy
1.1 Change Type
As with previous change blindness studies (Davies et al. [2012] and Huhtala et al. [2009]), change detection accuracy rates were very low for the flicker change type (or “one-shot paradigm”), with less than 20% correct detection for all participants. This further supports the notion of change blindness, in that we are almost blind to any change that occurs while our view is obstructed.
Change detection accuracy rates were significantly different for all the change type levels. Correct detection for a page load was almost 70% and around 75% for an instantaneous change. This difference between the flicker change type and the
1.2 Page Type
Detection rates for the Category page type were significantly different from the Home page type and the Product page type. The largest difference, between the Category and Product page types, was only 6.27%, though.
It’s unclear what would cause the Category page type to have a significantly higher detection rate, but it may be due to there being fewer features in that page type for
participants to attend to. The Home page type was similarly limited in features, compared to the Product page type, and shows a similar trend in having slightly more correct
detections than the Product page type.
1.3 Change Location
The Logo change location and the Search Box change location had the lowest correct detection rate. These two locations were in the header of the page, above the content area of each page type. The locations were consistent, since they were part of the template used across all 3 page types, so participants actually saw these elements more throughout all the trials. However, given the lower detection rates for these two locations,
2. Response Time
2.1 Change Type
The mean response time for the flicker change type was 2 seconds, while the mean response time for the page load change type and the instant change type was 1.4 and 1.3 seconds, respectively. So, while all change types were significantly different, the
difference in mean response times between the flicker change type and the other two change types (0.6-0.7 seconds) was much greater than the difference between the two non-flicker change types (0.1 seconds).
Response times by change type showed a pattern alongside detection rates: the flicker change type had the slowest response times and the lowest detection rate, followed by the page load change type, and the instant change type.
2.2 Page Type
Response times tended to be faster for the Category page type, just as detection rates were higher for that type. This is probably also a consequence of there being fewer features to attend to on that page type, as with the change detection accuracy results.
2.3 Change Location
The Logo change location and the Search Box change location had the slowest response times. Users may be accustomed to focusing initially on the content area of a webpage, rather than the header, causing them to take longer to notice things that may have
happened outside the content area. As with detection rates for these change locations, the slower response times for non-content items may also be attributable to “banner
attention on the outer edges of a website, such as the header, as changes more likely go unnoticed there or take longer to notice.
3.
Limitations
Some aspects of the experimental and interface designs limit the results of this study. For the experimental design, having participants volunteer through social media and
Mechanical Turk introduces some variability into the test setting. There is some
ecological validity in having users perform tasks in an environment they are comfortable with, but some control over the testing environment is surrendered.
The incidental significance of page type and change location somewhat complicates analysis, as these were intended to not have an impact in the study. These variables are considered in every model that was created, though, so their influence is taken into consideration.
The mock web page interface that was created had a minimum screen resolution
C
ONCLUSION
The traditional web page model may resemble the one-shot paradigm, with its “flicker” of a blank screen in between web pages, but, as is evident from this research, it does not create the same problems for users regarding change detection accuracy or response times. This should ease the concerns of practitioners and academics that the web is hindered in its architecture compared to desktop applications, or other “continuous” interfaces. Furthermore, instantaneous changes on web pages were significantly different from a page load, in terms of change detection accuracy and user response time.
However, the difference in detection rates was small (5%) and the difference in response times was small (0.1 seconds). The results for the instantaneous changes are small improvements over a page load, but further support the reasoning behind developing “single page applications”. A single page application is intended to be a website that mimics desktop application behavior through heavy use of AJAX and minimizing full page refreshes (Wasson, 2013). As shown here, instantaneous changes on a web page where there is no request to the server are less susceptible to change blindness than when a page loads. So, while the page-by-page model of the web does not cause change
blindness as much as feared, it can be marginally improved upon through the use of instant feedback on the client of an application.
al., 2009) and their potential for overcoming change blindness, but the current research exists for continuous interfaces. It would be useful to adapt such research to the web and determine how different web application architectures can benefit from the use of animations and transitions in minimizing change blindness.
Source Code and Data
The source code for the web application is available at:
A
CKNOWLEDGEMENTS
BIBLIOGRAPHY
Beeharee, A. K., West, A. J., & Hubbold, R. (2003). Visual attention based information culling for distributed virtual environments. In Proceedings of the ACM
Symposium on Virtual Reality Software and Technology (pp. 213–222). New York, NY, USA: ACM.
Benway, J. P. (1998). Banner blindness: The irony of attention grabbing on the World Wide Web. In Proceedings of the Human Factors and Ergonomics Society Annual Meeting (Vol. 42, No. 5, pp. 463-467). SAGE Publications.
Davies, T. & Beeharee, A. (2012). The case of the missed icon: change blindness on mobile devices. In Proceedings of the SIGCHI Conference on Human Factors in
Computing Systems (CHI '12). ACM, New York, NY, USA, 1451-1460.
DiVita, J., Obermeyer, R. Nygren, T. E., & Linville, J. M. (2004). Verification of the change blindness phenomenon while managing critical events on a combat information display. Human Factors, 46, 205–218.
Durlach, P. J. (2004). Change blindness and its implications for complex monitoring and control systems design and operator training. Human-Computer Interaction,
19(4), 423–451.
Grimes, J. (1996). On the failure to detect changes in scenes across saccades. In K. A. Akins (Ed.), Perception. Vancouver studies in cognitive science: Vol. 5 (pp. 89– 110). New York: Oxford University Press.
Healey, C. (2011) Perception in visualization. (n.d.). Retrieved September 3, 2014, from http://www.csc.ncsu.edu/faculty/healey/PP/
Heiner, A., & Asokan, N. (2008). Using salience differentials to making visual cues noticeable. In Proc. 1st Conference on Usability, Psychology, and Security. HTTP Archive. (2015). Interesting stats. Retrieved from
http://httparchive.org/interesting.php?a=All&l=Mar%201%202015&s=All Hudson, W. (2001). Designing for the grand illusion. SIGCHI Bulletin:
supplemental interactions 2001 (November 2001), 8-8.
Huhtala, J., Mäntyjärvi, J., Ahtinen, A., Ventä, L. & Isomursu, M. (2009). Animated Transitions for Adaptive Small Size Mobile Menus. In Proceedings of the 12th IFIP TC 13 International Conference on Human-Computer Interaction: Part I
(INTERACT '09)
Mack, A. & I. Rock (1999). Inattentional blindness: an overview. Psyche 5(3).
Gabriela M., William W., & Paola A. (2007). Looking but not seeing: implications for HCI. In Proceedings of the 14th European conference on Cognitive ergonomics: invent! explore! (ECCE '07). ACM, New York, NY, USA, 167-174.
Nielsen, J. (1995) 10 heuristics for user interface design. Retrieved September 25, 2014, from http://www.nngroup.com/articles/ten-usability-heuristics/
Rensink R.A. (2002). Change detection. Annual Review of Psychology, 53:245-277. Rensink, R. A. (2002). Internal vs. external information in visual perception. In
Proceedings of the 2Nd International Symposium on Smart Graphics (pp. 63–70). New York, NY, USA: ACM.
Rensink, R. A., O’Regan, J. K., & Clark, J. J. (2000). On the failure to detect changes in scenes across brief interruptions. Visual Cognition, 7, 127–145.
Resig, J. (2008). Accuracy of JavaScript Time. Retrieved from http://ejohn.org/blog/accuracy-of-javascript-time/
Scott, B. (2011). Designing for mice and men. User Interface Engineering conference, 16. Retrieved from
http://www.uie.com/events/uiconf/2011/proceedings/materials/
Shneiderman, B. & Plaisant, C. (2010). Designing the user interface: strategies for effective human-computer interaction: fifth edition, Addison-Wesley Publ. Co., Reading, MA.
Simons, D. J., & Chabris, C. F. (1999). Gorillas in our midst: sustained inattentional blindness for dynamic events. Perception, 28, 1059–1074.
Simons, D. J., & Levin, D. T. (1998). Failure to detect changes to people during a real-world interaction. Psychonomic Bulletin & Review, 5, 644–649.
Simons, D. J., & Rensink, R. A. (2005). Change blindness: past, present, and future.
Trends in Cognitive Sciences, 9(1), 16–20.
Wasson, M. (2013). Single-Page Applications: Build Modern, Responsive Web Apps with ASP.NET. Retrieved from
https://msdn.microsoft.com/en-us/magazine/dn463786.aspx
Werner S, Thies B. (2000). Is "change blindness" attenuated by domain-specific
expertise? An expert-novices comparison of change detection in football images.
Visual Cognition, 7: 163-173.
Woods, J. (2014). 20 cloud computing statistics every CIO should know |
APPENDIX
Age Range %
18-24 13.3%
25-34 50.3%
35-44 25.1%
45-54 7.4%
55-60 2.2%
60+ 1.4%
Table 4: Distribution of age ranges for all participants (n=156)
Preferred Browser %
Chrome 65.1%
Firefox 29.6%
Internet Explorer 2.2%
Opera 0.7%
Safari 0.7%
Other 1.4%
Table 5: Distribution of preferred browser for all participants (n=156)
Hours Using a Web Browser Per Day %
1-2 hours 4.4%
3-5 hours 25.1%
6-8 hours 40%
9+ hours 30.3%
![Figure 2: A “film strip” view of a web page loading on webpagetest.org [http://www.webpagetest.org/result/150310_X9_16D0/]](https://thumb-us.123doks.com/thumbv2/123dok_us/8338044.2213812/5.918.169.815.672.756/figure-film-strip-view-loading-webpagetest-webpagetest-result.webp)