R E S E A R C H
Open Access
Regional lung densities in alpha-1
antitrypsin deficiency compared to
predicted values
Berend C. Stoel
1*, Jan Stolk
2, M. Els Bakker
1and David G. Parr
3Abstract
Background:We developed a method to calculate a standard score for lung tissue mass derived from CT scan
images from a control group without respiratory disease. We applied the method to images from subjects with emphysema associated with alpha-1 antitrypsin deficiency (AATD) and used it to study regional patterns of differential tissue mass.
Methods:We explored different covariates in 76 controls. Standardization was applied to facilitate comparability between different CT scanners and a standard Z-score (Standard Mass Score, SMS) was developed, representing lung tissue loss compared to normal lung mass. This normative data was defined for the entire lungs and for delineated apical, central and basal regions. The agreement with DLCO%pred was explored in a data set of 180 patients with emphysema who participated in a trial of alpha-1-antitrypsin augmentation treatment (RAPID). Results:Large differences between emphysematous and normal tissue of more than 10 standard deviations were found. There was reasonable agreement between SMS and DLCO%pred for the global densitometry (κ= 0.252,p< 0.001), varying fromκ= 0.138 toκ= 0.219 and 0.264 (p< 0.001), in the apical, central and basal region, respectively. SMS and DLCO%pred correlated consistently across apical, central and basal regions. The SMS distribution over the different lung regions showed a distinct pattern suggesting that emphysema due to severe AATD develops from basal to central and ultimately apical regions.
Conclusions:Standardization and normalization of lung densitometry is feasible and the adoption of the developed principles helps to characterize the distribution of emphysema, required for clinical decision making.
Keywords:Computed tomography, Emphysema, Image analysis, Outcome measures, Standardization
Background
Chronic obstructive pulmonary disease (COPD) is defined physiologically using spirometric measurement of forced expiratory volume in 1 s (FEV1), forced vital capacity (FVC) and the ratio of FEV1/FVC [1]. Pulmonary emphy-sema is frequently present in patients with COPD and may be assessed by measuring the diffusing capacity for carbon monoxide (DLCO), which reflects the emphysema-tous tissue destruction that leads to loss of alveolar struc-ture and, as specifically reflected in the DLCO, the pulmonary vascular bed [2]. The time course of DLCOand
FEV1 decline as physiologic parameters of emphysema progression is highly variable between (and within) pa-tients and they correlate poorly [3]. Although DLCO is considered to reflect emphysema severity in patients with COPD, emphysema is defined in histopathological rather than physiological terms [4] and a more disease-specific parameter, obtained from lung densitometry using com-puted tomography (CT), was introduced 40 years ago [5,
6], and validated against histopathological standards by three different laboratories [7–9]. Lung densitometry was also validated by relating densitometry to clinically relevant measures [10–13]. It was found to be more con-sistent over time as compared to FEV1 and DLCO [14], most probably because densitometry is a more direct measurement of emphysema and intrinsically effort * Correspondence:b.c.stoel@lumc.nl
1Division of Image Processing, Department of Radiology, Leiden University Medical Center, Leiden, The Netherlands
Full list of author information is available at the end of the article
independent. In patients with emphysema associated with alpha-1-antitrypsin deficiency (AATD), DLCO/VA pre-dicted all cause and respiratory mortality. However, CT densitometry consistently proved to be the best independ-ent predictor of mortality [15]. Some years later, the European Medicines Agency (EMA) approved phase II and III randomized controlled clinical trials to study the effect of new drug treatments on emphysema and, in 2007, the United States Food and Drug Administration (FDA) accepted the methodology for use as an outcome measure in trials of disease modifying therapy in AATD patients. In 2015, the EMA approved a license for Respreeza on the basis of a beneficial treatment effect demonstrated using lung CT densitometry [16–18]. As post-hoc analysis, regional densitometry has been intro-duced to study emphysema progression and treatment ef-fects in the apical, central and basal regions of the lungs [19–21] to improve insight into pathophysiology and local emphysema treatment planning.
The clinical application of lung densitometry, however, has not followed the pace of its application in clinical re-search. To date, there is no international accepted data-base with reference values obtained from individuals
with healthy lungs and no standardized CT image acqui-sition protocol for lung densitometry. Moreover, we cur-rently lack adequate standardization between different CT manufacturers (despite calibration for water and air), correction of lung density for differences in lung sizes between subjects and for inspiration levels [22].
The aim of our study was to develop an integrated method to report lung density in terms that would ad-dress the above obstacles and facilitate the introduction of the methodology into routine clinical practice [23].
Methods
Overview
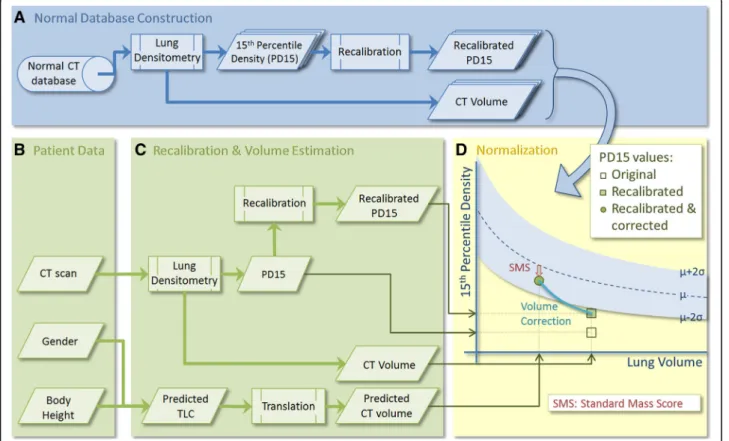
We considered that to express CT lung density as “ per-cent predicted density” values would require: 1) a recali-bration method for compensating for differences between CT scanners; 2) a comparison with normal values from a database, producing a standard score; and 3) a method to correct for volume differences within and between sub-jects (see Fig.1).
First, all CT data from normal controls were analyzed by lung densitometry (Fig. 1a), producing for each sub-ject the lung volume during CT scanning and a
recalibrated density value, 15th percentile density (PD15). From this database, the mean relation between lung size (volume) and PD15 in the normal population was determined, along with the standard deviation in density at each volume.
A standard score for a particular patient was produced from CT imaging, together with gender and body height (Fig. 1b). This CT scan was analyzed by densitometry software, to produce a lung CT volume and a recali-brated PD15 value (Fig. 1c). In the same step, the pre-dicted total lung capacity (TLC) was calculated (based on gender and body height) and translated into a pre-dicted lung CT volume, which is needed because of the difference in definition between‘physiologically’measured TLC and‘anatomically’measured CT-volume, the latter of which is defined as the total number of voxels in the lungs, excluding the trachea but including parenchyma and small vessels. In the final step (Fig. 1d), a so-called standard mass score (SMS) was calculated, based on the normal density database and the patient’s lung volume and recalibrated density values. Volume correction was applied based on the predicted CT volume.
In addition to these global measurements, the same approach was followed for regional lung densitometry, where the apical, central and basal regions of the lungs were analyzed separately [19]. To define these areas, the lungs were divided vertically into 12 equivolumetric parti-tions and the superior and inferior partition were omitted, as they contain artifacts, e.g. partial volume effects [20]. The separate regions were determined by combining the remaining partitions (apical:3, central:3, basal:4). The above normalization was also applied to these separate regions in the normal database, producing three regional standard mass scores; i.e. SMSapical, SMScentral, SMSbasal.
A detailed description of the different components is presented in the following sections.
Lung densitometry
All CT data were analyzed by a software package PULMO, version 2.1 (Medis specials, Leiden, the Netherlands), using a threshold of−380 HU to detect both lungs, with exclu-sion of the trachea [22]. From this segmentation result, the density distribution was calculated and lung density was measured as the 15th percentile density1 (PD15; the threshold density in gram/liter, at which 15% of lung voxels have a lower density). By summing all included lung voxels, the lung volume (CT-volume) was determined.
Normal CT database
CT scans from 76 subjects (52 males, 24 females, see Table 1) without respiratory symptoms, who had been screened for pulmonary metastases following treatment of osteosarcoma, were reviewed by a radiologist and, if a normal radiological appearance was observed, the subjects
were checked for normal spirometry and gas transfer, as reported in an earlier study [24]. In this population, FEV1 (standard deviation, SD) and DLCO(SD) was 93(4) % and 95(10) % of predicted values, respectively. Of these sub-jects, 16 were current smokers, 26 were ex-smokers and 34 were never-smokers. Age ranged between 26 and 78 years. The CT data were acquired using a Philips AVE-U scanner (Phillips Medical Systems, Eindhoven, the Netherlands) at full inspiration and were used to create a database of normal values (normal database). The CT scanner was calibrated as recommended by the manufac-turer using a standardized image acquisition protocol (at 140 kVp, 40 mAs, pitch factor 2, 7 mm collimation, reconstructed with a slice thickness of 7 mm, 5 mm in-crement and reconstruction filter 4 [24]). CT images were analyzed, and both lung volume and PD15 values were stored in a database.
To identify those variables required for normalization, the influences of several parameters on percentile density were explored in this normal database, by linear regression using log-transformed percentile density as response vari-able. The potential explanatory variables included gender, smoking status, age, log-transformed CT-volume and in-spiration level, defined as the log ratio of CT-volume and predicted total lung capacity (TLC). Data were analyzed with SPSS 16.0 (SPSS Inc., Chicago, IL) and a stepwise variable selection was applied. Age, smoking status and gender were excluded from the model, as they did not significantly explain additional variation. The model with only CT-volume and inspiration level fitted best to the data (R2= 0.65).
Therefore, lung size and inspiration level were used for normalization of PD15 values from patients, per-formed in three steps, as discussed in the following three sections: 1) recalibration of density values; 2) correction for inspiration level; and 3) comparison with the normal database with lung size as covariate.
Recalibration
Percentile density values were recalibrated to account for differences that occur between different CT scanner types
Table 1Characteristics of the normal subjects [24] and AATD patients [16]
Normals AATD
Subjects [n] 76 180
Age [years] 44.5(11.8) 53.1(7.4)
Sex [M/F] 52/24 98/82
BMI [kg/m2] 25(3) 26(4)
FEV1[%pred] 93(4) 47(12)
FEV1/VC 0.87(0.08) 0.44(0.11)
and manufacturers despite routine calibration for air and water. In an internal recalibration method, all density values were rescaled during image analysis, using the mean air density sampled outside of the patient (above the sternum) as a reference value for air [25]. The mean dens-ity measured in the descending aorta was used as a refer-ence for the density of blood (rescaled to 1050 g/L) [22].
Volume correction
Correction for variation in inspiratory level has been ex-plored using several methods and adapted for use in drug evaluation trials [11]. For analyzing data from sin-gle time points, only a physiological method can be used, referred to as the ‘sponge model’. In this model, differ-ences in inspiratory level are considered to be mass-preserving, i.e. lung mass remains constant during the respiratory cycle, as in a dry sponge that is com-pressed then released [26,27]. As a result, lung volume and density are linearly related when both are log trans-formed, with a slope of exactly −1. Consequently, this linear relation is used to correct for differences in in-spiratory level, by calculating the percentile density that would apply if the patient had inhaled to his/her pre-dicted total lung capacity (TLCpred). In contrast to pul-monary function tests, however, patients are scanned in the supine position and, by definition, CT-volume in-cludes lung tissue and exin-cludes tracheal air, whereas TLC is a measure of total air volume without lung tis-sue, but including tracheal air. Therefore, the predicted CT-volume (VCT,pred) was estimated from the predicted TLC values from the normal population by linear regres-sion, separating for gender. The resulting coefficients for intercept and slope,γandδ, respectively, were then used to translate between predicted TLC and predicted CT-volumes.
Because of image reconstruction errors, possible physiological influences and the fact that the PD15 is used instead of the mean density values, the ‘sponge model’ does not apply exactly in practice [28], therefore a steeper slope (S) of−1.1 was used, obtained from opti-mizing the reproducibility of the volume correction, using the baseline inspiratory and expiratory scans of the RAPID trial.
In short, the corrected percentile density value, ρcor, was defined as:
ρcor¼ρcal∙ VCT;pred VCT
S
¼ρcal∙ γþδ∙TLCpred VCT
S
ð1Þ
where ρcal is the recalibrated percentile density value, VCT and VCT,pred are the observed and predicted lung volume in CT, respectively, and TLCpredthe percent pre-dicted value according to the ERS standard, based on
body height and gender [29]. The coefficients γ and δ are the intercept and slope from linear regression, re-spectively, to translate TLC predicted values to normal CT volumes.
Normalization
For the final step, the recalibrated and volume-corrected percentile density was compared to the database of nor-mal values from an earlier study [24], the raw data of which is made available in the Additional file 1. To ac-count for differences in lung size, data were corrected based on the linear relation between log-transformed volume and log-transformed density. To indicate the ‘percent predicted density’ for a particular patient, the standard score (Z-score) was calculated, defined by the difference between the measured percentile density and the predicted value (derived from the normal database) at the patient’s lung CT volume, divided by the residual standard deviation after linear regression.
Pulmonary emphysema is characterized by a reduction in lung mass (due to tissue loss and reduced blood vol-ume in pulmonary capillaries). The use of volvol-ume-cor- volume-cor-rected data reflects the loss of tissue mass alone compared to the normal database and may be referred to as the‘Standard Mass Score’(SMS).
An SMS of 0 is equivalent to normal tissue mass (“100% predicted”). A value between−2 and 0 indicates a decreased lung tissue mass that is still within the mal range, and a value between 0 and 2 indicates a nor-mal but increased tissue mass. All SMS values above 2 or below −2 indicate an abnormal increased or de-creased lung tissue mass, respectively.
Thus, the recalibrated and volume-corrected standard mass score was defined as:
SMS¼logðρcorÞ−ðαþβσlogðVCT;predÞÞ
¼logðρcorÞ−ðαþβlogðγþδTLCpredÞÞ
σ ;
ð2Þ
where log(ρcor) and α+β· log(VCT,pred) are the mea-sured and predicted log percentile density values, re-spectively, α and β are the intercept and slope from the regression line between log volume and log per-centile density from the CT scans of normal subjects, and σ is the residual standard deviation after linear regression.
AATD CT database
In this study, patients aged 18–65 years were included with serum AAT levels below 11μM and FEV1 -values ≥35% and≤70% of predicted. Participants were excluded if they had smoked tobacco within 6 months prior to the start of the study, had undergone lung transplantation, lobectomy or lung volume reduction therapy, or had se-lective IgA deficiency.
CT scanning was performed using a standardized CT acquisition protocol, optimized for lung densitometry, at total lung capacity (TLC) and functional residual cap-acity (FRC), where only the TLC scan was used for the current study [17].
Validation
To validate the method in terms of (regional) structure-function relationship [30], the Spearman correlation was studied between standard mass score and DLCO percent predicted values, and FEV1 percent predicted from the AATD patient group, respectively. The agreement in sep-aration into normal and abnormal lung structure or gas exchange was assessed by kappa-statistics. In this separ-ation, SMS values less than−2 were considered abnormal, and for DLCO a threshold of 80% of predicted values was used to define the lower limit of the normal range. A sig-nificance level of 0.05 was used for all statistical tests.
As an internal validation using the control data, a leave-one-out cross-validation experiment was performed, where the normalization was determined with n-1 con-trols and tested on one, with n-1 different combinations.
The distribution of SMS values across the basal, cen-tral and apical regions was used to distinguish between different subgroups in the RAPID study population.
Subsequently the differences in DLCO%pred between these subgroups was tested.
Results
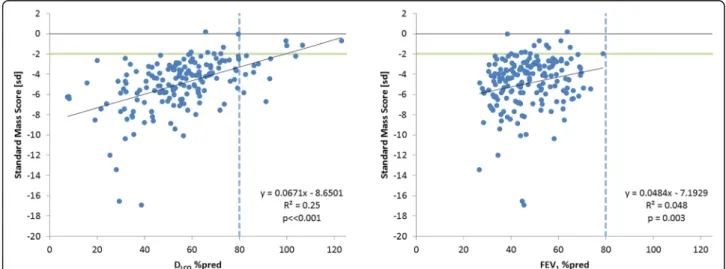
The correlations of SMS with the %-predicted values for DLCOand FEV1are presented in Fig.2. The correlation with DLCO was moderate, but statistically significant (R2= 0.25,
p< < 0.001); and for FEV1 the correlation was weak, R2 = 0.048 (p = 0.003). For comparison, the correl-ation between the %-predicted values for DLCO and FEV1was statistically significant but also weak, R2= 0.1202,
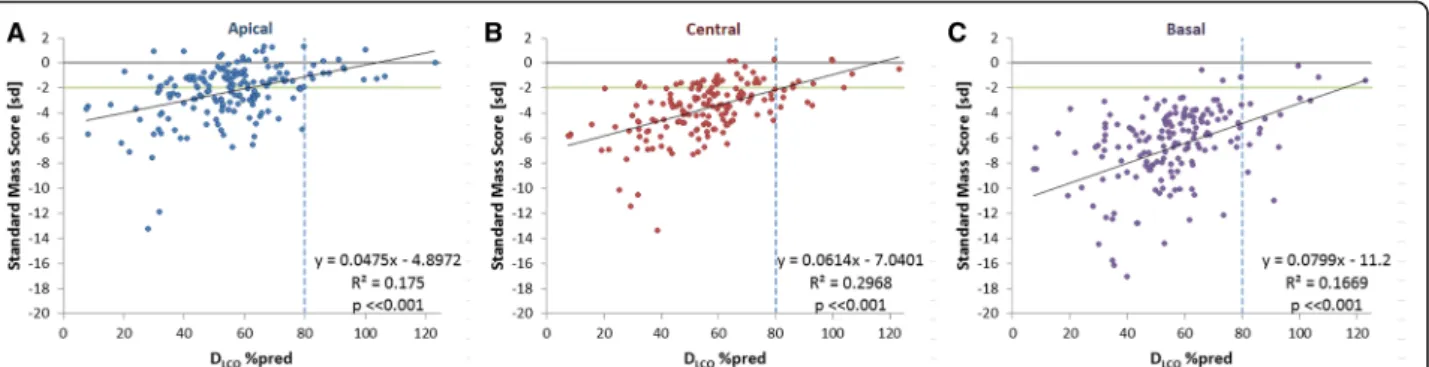
p< < 0.001. For the apical, central and basal regions the cor-relations between DLCO%pred and SMS values are shown in Fig.3. It was noted that there were three patients with exceptionally low DLCO%pred values below 10%, which we considered to be likely outliers. Since omitting these values did not considerably change the correlation between SMS and DLCO%pred (R2= 0.26,p< < 0.001), it was decided to preserve these data.
The agreement between global SMS and DLCO%pred in distinguishing abnormal structure or function is presented as a confusion matrix in Table 2. The kappa-statistic
showed a fair agreement between SMS and
DLCO%pred (κ= 0.252,p< 0.001), varying from κ= 0.138 to κ= 0.219 and 0.264 (p < 0.001), in the apical, central and basal region, respectively.
From the cross-validation with normal controls, we found that the average SMS value of unseen controls was −0.05, with a standard deviation of 1.03, closely corresponded to the targeted mean and standard deviation of 0 and 1, respectively.
Analyzing the frequency of occurrence of the SMS values below normal across the different lung regions
Fig. 2Relation between standard mass score and percent predicted values for DLCOand FEV1. The green horizontal line indicates the lower limit
of normal SMS; the dotted vertical line indicate lower limit of normal pulmonary function. Note that no normal FEV1values (> 80%) were
observed because 70% predicted was an exclusion criterion for the RAPID trial (natural variation in FEV1values causes the occurrence of baseline
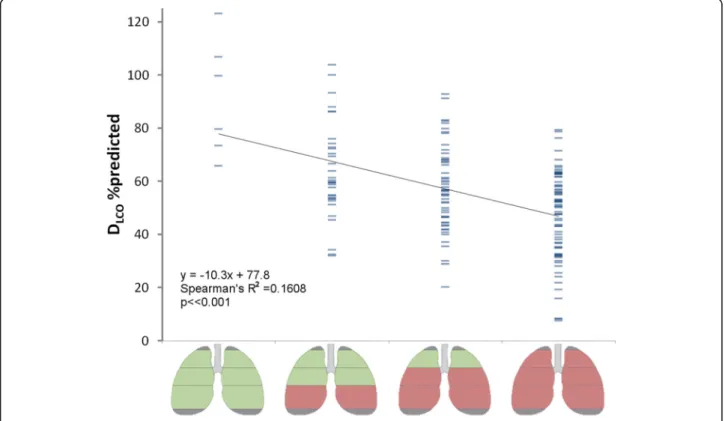
(apical, central, basal) in the AATD population revealed that from the eight possible pattern combinations only four predominantly occur, as shown in Fig.4. In this fig-ure, green regions represent normal lung mass, and red regions indicate SMS values below normal. In 4% of cases, the lungs actually had normal tissue mass, where the frequency of occurrence increases as the basal, cen-tral and apical regions become incrementally involved.
The association between subgroups and DLCO%pred is shown in Fig. 5 (R2 = 0.16, p < < 0.001). The range in DLCO%pred was more comparable between the different subgroups in Fig.5, than for the global SMS scores from Fig.2, where the range in DLCO%pred was greater in the higher SMS scores.
Discussion
The accepted principles of standard procedures for the measurement of pulmonary function also apply to lung densitometry, and require the use of the same equip-ment, preferably the same technician, the same protocol, an appropriate calibration, correction for uncontrolled covariates and a suitable reference to normal values. Most of these issues have been addressed in the research efforts of the past decades [26, 27, 31, 32] and, conse-quently, CT densitometry has been accepted as the pri-mary outcome parameter in trials evaluating new drugs for pulmonary emphysema [33]. However, the variability between CT scanners and a lack of normative data has hampered its application in clinical practice [23]. In the present study, we have established an initial step in this process, by proposing a method to standardize between CT scanners, in combination with a correction for
volume differences and a subsequent comparison with a normal database.
Demonstration of the large differences in standard mass score between emphysema patients and normal controls of more than 10 SD (see Fig.2), and the stron-ger correlation between SMS and DLCO, than between DLCO and FEV1, supports the application of CT lung densitometry in clinical practice. The future acquisition of a more extensive normal database would provide even greater confidence and support for the use of CT lung densitometry in routine clinical practice.
From the analysis of the normal database, we found that percentile density was not influenced by gender and age, which supports the data of Gevenois et al. [34], who studied the influence of different factors on the mean lung density in 42 healthy subjects. Therefore, any differ-ences in lung density between genders should be inter-preted with caution, since the difference is more likely to be a direct consequence of the gender-associated dif-ferences in lung size. Gevenois and colleagues [34] did find a slight influence of age on the relative area of low attenuation or ‘voxel index’ (which is an alternative measure to the percentile density method). However, this influence may also be explained by differences in lung size.
The first study in which normative density data were presented was by Kalender et al. [35], where spirometri-cally controlled CT data from 52 healthy subjects was analyzed. The mean lung density was calculated from three single slices and used as reference data. They con-cluded that spirometric control proved difficult even in cooperative patients, preventing an objective comparison with normal controls. Marsh et al. [36] compared CT densitometry from 22 emphysema patients with a nor-mal database of 185 nornor-mal subjects, and found a poor discriminating ability of the relative area. However, both studies employed single slice protocols so that the lung volume during scanning could not be measured and a posteriori volume correction was therefore not possible. Heussel et al. [37] compared patients with COPD and
Fig. 3Correlations between SMS and DLCO%pred in:a. Apical;b. Central; andc. Basal region. The green horizontal line indicates the lower limit
of normal SMS; the dotted vertical line indicate lower limit of normal pulmonary function
Table 2Confusion matrix, SMS versus DCLO%pred
DLCO%pred
normal abnormal Total
Standard Mass Score normal 4 10 14
abnormal 8 151 159
interstitial lung disease, employing 44 patients with COPD GOLD stage 0 used as normal data, and con-cluded that a 15th percentile density higher than −950 HU should be considered normal. More recently, Mets et al. [38] and Pompe et al. [39] presented normal ranges for the 15th percentile density from a cohort of 70 young male divers with above-normal spirometry and of 250 current or former male smokers with normal gas transfer, respectively. In the above studies, no volume correction or standardization was applied, even though
volumetric data was available, thereby hampering inter-pretation and comparison with our data.
Some limitations apply to the current study, and refine-ments of the methods may still be needed. The recalibra-tion method may be too simple to reflect all potential differences between scanners, such as difference in image reconstruction, different degrees in beam hardening ef-fects and subsequent correction. Alternative methods for performing recalibration have been proposed in the litera-ture, including the use of dedicated lung phantoms [40] or
Fig. 4Bar plot of the frequency of occurrences of all possible combinations of normal and below-normal tissue mass, over the three different regions. Only a subgroup of four possible combinations predominantly occur in practice, as highlighted by the rectangular overlay
by the normalization of the entire appearance of the CT scans based on frequency band decomposition [41]. This latter method requires, however, that different reconstruc-tions from the same patient are available to obtain the normalization function, which limits its practical imple-mentation. Further standardization of CT image recon-struction is still required to make lung densitometry even more accurate. Therefore, the initiative of the scientific advisory board of the Radiological Society of North America (RSNA) to establish CT standardization, as part of the “Quantitative Imaging Biomarker Alliance” (QIBA) is essential for further acceptance of CT densitometry as a clinical tool [42].
The size of the normal database used here is limited because, for ethical reasons, we were only able to scan patients in this cohort if they were considered at risk for pulmonary metastases. Therefore, the collection of nor-mal values took a long time period and, consequently, the scanner used to develop this data is no longer ‘ sta-te-of-the-art’. Notwithstanding this potential limitation, there is no indication that older CT scanners produce less accurate densitometric results than modern scan-ners. Further multi-center studies are needed to extend this database and produce more relevant standard scores for emphysema, possibly involving more explanatory variables in the statistical model. For example, smoking status is a known factor influencing lung density in a group of 463 COPD patients [43], and may need to be included in the model.
Nevertheless, the requirements for the highest degree of precision are less important for cross-sectional studies compared to longitudinal studies of potential disease modifying treatment effects. However, simple application and refinement of the current methodology will facilitate such studies.
The presented method enabled also a regional analysis of lung tissue mass compared to normal tissue, in a rep-resentative sample of patients with severe AATD. The finding that only four subgroups exist based on their re-gional SMS patterns suggests that emphysema in AATD develops from basal to global destruction of lung tissue, which needs to be confirmed in longitudinal studies.
Conclusions
The standardization and normalization of lung mass values has been shown to be feasible. Consequently, the method-ology could be used in clinical practice in the near future, although further refinement of the standardization methods may be needed, either by a posteriori recalibration or by a standardized protocol for different CT manufacturers. The adoption of these principles may improve the application of lung CT densitometry as a research and clinical tool where information about distribution of emphysema is required for the purpose of clinical decision making.
Endnotes
1
The 15th percentile density was chosen over mean lung density (MLD), since densities are not normally dis-tributed and MLD is more prone to outliers from the segmentation, affecting its reproducibility [44,45].
Additional file
Additional file 1:Individual data from the normal database. (XLSX 13 kb)
Abbreviations
AATD:Alpha-1 antitrypsin deficiency; COPD: Chronic obstructive pulmonary disease; CT: Computed tomography; DLCO: Diffusing capacity for carbon monoxide; EMA: European medicines agency; FDA: United states food and drug administration; FEV1: Forced expiratory volume in 1 s; FVC: Forced vital capacity; MLD: Mean Lung Density; PD15: 15th Percentile density; QIBA: Quantitative imaging biomarker alliance; RSNA: Radiological society of North America; SMS: Standard Mass Score; TLC: Total lung capacity; VA: Alveolar volume
Acknowledgments
The CT data and pulmonary lung function tests from the RAPID trial were kindly provided by CSL Behring. We would like to thank M. Wencker and O. Vit (CSL Behring, Bern, Switzerland) for their input in the discussions on the results of this study.
Funding
The authors did not receive any funding for this study.
Availability of data and materials
The data that support the findings of this study are available from CSL-Behring but restrictions apply to the availability of these data, which were used under license for the current study, and so are not publicly available. CSL will consider requests to share Individual Patient Data (IPD) from review groups or bona-fide researchers. IPD requests will be accepted 12 months following publication on a public website. IPD will only be provided for the purposes of meta-analyses. The proposed use of the IPD will be reviewed by an internal CSL review committee. If the request is approved and the re-searcher agrees to the terms and conditions, IPD that has been appropriately anonymized will be available. The IPD will then be available to the researcher for 2 years. Supporting documents including study protocol and Statistical Analysis Plan will also be provided.
All data analysed from the normal database are included in this published article and its supplementary information files.
Authors’contributions
BCS designed the method for normalization and its evaluation, drafted the manuscript, contributed in the interpretation of the results. He agreed to be accountable for this work in assuring accuracy and integrity.
JS was involved in the design and evaluation, acquisition of data and interpretation of the results. He was involved in drafting and critically revising the manuscript, giving final approval of the version to be published. MEB was involved in performing the image analysis of the normal database, and was involved in drafting and interpreting the results. She critically revising the manuscript and approved the version to be published. DGP was involved in design of the method and analysis and interpretation of the results. He was involved in drafting and critically revising the manuscript, and approved the version to be published. All authors read and approved the final manuscript.
Ethics approval and consent to participate
Consent for publication
Not applicable
Competing interests
BCS is consultant for CSL-Behring and BioClinica, the contract research organization that performed the lung densitometry for the RAPID trial. JS received funding for projects from CSL Behring and Kamada. MEB does not have competing interest.
DGP has received lecture fees, served on Advisory Boards and provided independent consultancy services to CSL Behring.
Publisher’s Note
Springer Nature remains neutral with regard to jurisdictional claims in published maps and institutional affiliations.
Author details
1Division of Image Processing, Department of Radiology, Leiden University Medical Center, Leiden, The Netherlands.2Department of Pulmonology, Leiden University Medical Center, Leiden, The Netherlands.3Department of Respiratory Medicine, University Hospitals of Coventry and Warwickshire, Clifford Bridge Road, Coventry, UK.
Received: 12 November 2018 Accepted: 20 February 2019
References
1. Barnes PJ. GOLD 2017: a new report. Chest. 2017;151:245–6. 2. Gibson GJ, Geddes DM, Costabel U, Sterk PJ, Corrin B. Respir Med W. B.
Saunders. 2003.
3. Stolk J, Stockley RA, Piitulainen E, Stoel BC. Relationship between change in lung density and long-term progression of lung function. Am J Respir Crit Care Med. 2015;192:114–6.
4. Snider GL, K J, Thurlbeck WM, Bengali ZH. the definition of emphysema. Report of a National Heart, Lung, and Blood Institute, division of lung diseases workshop. Am Rev Respir Dis. 1985;132:182–5.
5. Hayhurst MD, MacNee W, Flenley DC, Wright D, McLean A, Lamb D, Wightman AJ, Best J. Diagnosis of pulmonary emphysema by computerised tomography. Lancet. 1984;2:320–2.
6. Wegener OH, Koeppe P, Oeser H. Measurement of lung density by computed tomography. JComputAssistTomogr. 1978;2:263–73.
7. Bankier AA, de Maertelaer V, Keyzer C, Gevenois PA. Pulmonary emphysema: subjective visual grading versus objective quantification with macroscopic morphometry and thin-section CT densitometry. Radiology. 1999;211:851–8. 8. Gevenois PA, DeVuyst P, deMaertelaer V, Zanen J, Jacobvitz D, Cosio MG,
Yernault JC. Comparison of computed density and microscopic morphometry in pulmonary emphysema. Am J Respir Crit Care Med. 1996; 154:187–92.
9. Gould GA, MacNee W, McLean A, Warren PM, Redpath A, Best JJ, Lamb D, Flenley DC. CT measurements of lung density in life can quantitate distal airspace enlargement--an essential defining feature of human emphysema. Am Rev Respir Dis. 1988;137:380–92.
10. Dowson LJ, Newall C, Guest PJ, Hill SL, Stockley RA. Exercise capacity predicts health status in alpha(1)-antitrypsin deficiency. Am J Respir Crit Care Med. 2001;163:936–41.
11. Gould GA, Redpath AT, Ryan M, Warren PM, Best JJ, Flenley DC, MacNee W. Lung CT density correlates with measurements of airflow limitation and the diffusing capacity. Eur Respir J. 1991;4:141–6.
12. Stolk J, Ng WH, Bakker ME, Reiber JHC, Rabe KF, Putter H, Stoel BC. Correlation between annual change in health status and computer tomography derived lung density in subjects with alpha(1)-antitrypsin deficiency. Thorax. 2003;58:1027–30.
13. Parr DG, Stoel BC, Stolk J, Stockley RA. Validation of computed tomographic lung densitometry for monitoring emphysema in alpha1-antitrypsin deficiency. Thorax. 2006;61:485–90.
14. Stolk J, Putter H, Bakker EM, Shaker SB, Parr DG, Piitulainen E, Russi EW, Grebski E, Dirksen A, Stockley RA, et al. Progression parameters for emphysema: a clinical investigation. Respir Med. 2007;101:1924–30. 15. Dawkins PA, Dowson LJ, Guest PJ, Stockley RA. Predictors of mortality in
alpha1-antitrypsin deficiency. Thorax. 2003;58:1020–6.
16. Chapman KR, Burdon JG, Piitulainen E, Sandhaus RA, Seersholm N, Stocks JM, Stoel BC, Huang L, Yao Z, Edelman JM, McElvaney NG. Intravenous
augmentation treatment and lung density in severe alpha1 antitrypsin deficiency (RAPID): a randomised, double-blind, placebo-controlled trial. Lancet. 2015;386:360–8.
17. McElvaney NG, Burdon J, Holmes M, Glanville A, Wark PA, Thompson PJ, Hernandez P, Chlumsky J, Teschler H, Ficker JH, et al. Long-term efficacy and safety of alpha1 proteinase inhibitor treatment for emphysema caused by severe alpha1 antitrypsin deficiency: an open-label extension trial (RAPID-OLE). Lancet Respir Med. 2017;5:51–60.
18. Summary of the European public assessment report (EPAR) for Respreeza [https://www.ema.europa.eu/medicines/human/EPAR/respreeza]. 19. Parr DG, Dirksen A, Piitulainen E, Deng C, Wencker M, Stockley RA. Exploring
the optimum approach to the use of CT densitometry in a randomised placebo-controlled study of augmentation therapy in alpha 1-antitrypsin deficiency. Respir Res. 2009;10:75.
20. Bakker ME, Putter H, Stolk J, Shaker SB, Piitulainen E, Russi EW, Stoel BC. Assessment of regional progression of pulmonary emphysema with CT densitometry. Chest. 2008;134:931–7.
21. Parr DG, Sevenoaks M, Deng C, Stoel BC, Stockley RA. Detection of emphysema progression in alpha 1-antitrypsin deficiency using CT densitometry; methodological advances. Respir Res. 2008;9:9–12. 22. Stoel BC, Stolk J. Optimization and standardization of lung densitometry in
the assessment of pulmonary emphysema. Investig Radiol. 2004;39:681–8. 23. Stolk J, Stoel BC. Lung densitometry to assess progression of emphysema in
chronic obstructive pulmonary disease: time to apply in the clinic? Am J Respir Crit Care Med. 2011;183:1578–80.
24. Stolk J, Versteegh MI, Montenij LJ, Bakker ME, Grebski E, Tutic M, Wildermuth S, Weder W, el Bardiji M, Reiber JH, et al: Densitometry for assessment of effect of lung volume reduction surgery for emphysema.Eur Respir J 2007, 29:1138–1143.
25. Parr DG, Stoel BC, Stolk J, Nightingale PG, Stockley RA. Influence of calibration on densitometric studies of emphysema progression using computed tomography. Am J Respir Crit Care Med. 2004;170:883–90. 26. Shaker SB, Dirksen A, Laursen LC, Skovgaard LT, Holstein-Rathlou NH. Volume adjustment of lung density by computed tomography scans in patients with emphysema. Acta Radiol. 2004;45:417–23.
27. Stoel BC, Putter H, Bakker ME, Dirksen A, Stockley RA, Piitulainen E, Russi EW, Parr D, Shaker SB, Reiber JH, Stolk J. Volume correction in computed tomography densitometry for follow-up studies on pulmonary emphysema. ProcAmThoracSoc. 2008;5:919–24.
28. Staring M, Bakker ME, Stolk J, Shamonin DP, Reiber JHC, Stoel BC. Towards local progression estimation of pulmonary emphysema using CT. Med Phys. 2014;41:021905.
29. Quanjer PH, Tammeling GJ, Cotes JE, Pedersen OF, Peslin R, Yernault JC. Lung volumes and forced ventilatory flows.Report Working Party Standardization of Lung Function Tests, European Community for Steel and Coal Official Statement of the European Respiratory Society. Eur Respir J Suppl. 1993;16:5–40.
30. Parr DG, Stoel BC, Stolk J, Stockley RA. Pattern of emphysema distribution in alpha1-antitrypsin deficiency influences lung function impairment. Am J Respir Crit Care Med. 2004;170:1172–8.
31. Parr DG, Stockley RA. Standardization of CT densitometry. Radiology. 2004; 230:887.
32. Stoel BC, Bode F, Rames A, Soliman S, Reiber JH, Stolk J. Quality control in longitudinal studies with computed tomographic densitometry of the lungs. ProcAmThoracSoc. 2008;5:929–33.
33. FDA Blood Products Advisory Committee 95th Meeting July 20–21 2009 [https://wayback.archive-it.org/7993/20170113022628/http://www.fda.gov/ downloads/AdvisoryCommittees/CommitteesMeetingMaterials/ BloodVaccinesandOtherBiologics/BloodProductsAdvisoryCommittee/ UCM171091.pdf].
34. Gevenois PA, Scillia P, de Maertelaer V, Michils A, De Vuyst P, Yernault JC. The effects of age, sex, lung size, and hyperinflation on CT lung densitometry. AJR Am J Roentgenol. 1996;167:1169–73. 35. Kalender W, Fichte H, Bautz W, Zwick A, Rienmuller R, Behr J, van
Engelshoven JM, Lamers RJ, Vock P: Reference Values for Lung Density and Structure Measured by Quantitative CT. In Advances in CT III. Edited by H P, G L. Vienna: Springer-Verlag; 1994. p. 290–7.
37. Heussel CP, Herth FJ, Kappes J, Hantusch R, Hartlieb S, Weinheimer O, Kauczor HU, Eberhardt R. Fully automatic quantitative assessment of emphysema in computed tomography: comparison with pulmonary function testing and normal values. Eur Radiol. 2009;19:2391–402. 38. Mets OM, van Hulst RA, Jacobs C, van Ginneken B, de Jong PA. Normal
range of emphysema and air trapping on CT in young men. AJR Am J Roentgenol. 2012;199:336–40.
39. Pompe E, van Rikxoort EM, Schmidt M, Ruhaak J, Estrella LG, Vliegenthart R, Oudkerk M, de Koning HJ, van Ginneken B, de Jong PA, et al. Parametric response mapping adds value to current computed tomography biomarkers in diagnosing chronic obstructive pulmonary disease. Am J Respir Crit Care Med. 2015;191:1084–6.
40. Subramanian DR, Gupta S, Burggraf D, Vom Silberberg SJ, Heimbeck I, Heiss-Neumann MS, Haeussinger K, Newby C, Hargadon B, Raj V, et al. Emphysema- and airway-dominant COPD phenotypes defined by standardised quantitative computed tomography. Eur Respir J. 2016;48:92–103.
41. Gallardo-Estrella L, Lynch DA, Prokop M, Stinson D, Zach J, Judy PF, van GB, van Rikxoort EM. Normalizing computed tomography data reconstructed with different filter kernels: effect on emphysema quantification. Eur Radiol. 2016;26:478–86.
42. Lung Density Biomarker Committee [http://qibawiki.rsna.org].
43. Grydeland TB, Dirksen A, Coxson HO, Pillai SG, Sharma S, Eide GE, Gulsvik A, Bakke PS. Quantitative computed tomography: emphysema and airway wall thickness by sex, age and smoking. EurRespirJ. 2009;34:858–65.
44. Stoel BC, Vrooman HA, Stolk J, Reiber JH. Sources of error in lung densitometry with CT. Investig Radiol. 1999;34:303–9.