Factors Associated with Macrosomia among
Singleton Live-births: A Comparison between
Logistic Regression, Random Forest and
Artificial Neural Network Methods
ABSTRACT
Background: Macrosomia is caused by several risk factors with adverse outcomes for mothers and infants. Classification methods used to determine high-risk groups for macrosomia include logistic regression (LR), random forest (RF) and an artificial neural network (ANN).
Methods: We conducted this cross-sectional study on 4342 pregnant women with singleton live-births in Tehran, Iran, during July 6-21, 2015. The above mentioned methods were compared in terms of sensitivity (SE), specificity (SP) and accuracy (ACC). Cochran-Q and McNemar's tests checked for differences in proportion among the methods. We calculated the kappa statistic to assess the association between observed and predicted values.
Results: Body mass index (BMI), socioeconomic status (SES), education, parity, age, gestational age and occupation of the mothers were the most important variables that affected macrosomia as identified by the RF method which had the highest ACC (0.89). The association of RF predictions and observed values were: 0.43 (Ø coefficient), 0.39 (contingency coefficient), 0.43 (Kendall tau-b), and 0.31 (kappa).
Conclusions: The RF method had the best performance that classified macrosomia compared to the ANN and LR methods. The RF method might be used as an appropriate method for such data.
Key words: Macrosomia, Artificial Neural Network, Random Forest, Logistic Regression, Classification Payam Amini (1), Saman Maroufizadeh (1), Reza O Samani (1)*, Omid Hamidi (2), Mahdi Sepidarkish (1)
(1) Department of Epidemiology and Reproductive Health, Reproductive Epidemiology Research Centre, Royan Institute for Reproductive Biomedicine, ACECR, Tehran, Iran
(2) Department of Science, Hamadan University of Technology, Hamadan, Iran
CORRESPONDING AUTHOR:Reza O Samani - Department of Epidemiology and Reproductive Health, Reproductive Epidemiology Research Center, Royan Institute for Reproductive Biomedicine, ACECR, Tehran, Iran - P.O. Box: 16635-148; Tel: +98-2122339929; Fax: +98-2123562678; Email: samani@royaninstitute.org
DOI: 10.2427/11985
Accepted on October 10, 2016
INTRODUCTION
Macrosomia is a term used to describe excessive birth weight in a new-born [1]. Although there is no
Common maternal consequences include an increased risk of caesarean delivery, prolonged labour, perineal trauma and postpartum haemorrhage [1, 2]. Short-term consequences for the infant include shoulder dystocia, birth injury or death. Long-term effects for the infant include higher risks for diabetes and obesity later in life [1-4]. The often-cited risk factors for macrosomia are maternal diabetes and obesity, excessive weight gain, male infant sex, prolonged gestation, high maternal age and multiparity [5].
In the USA, the macrosomia rate is 8.0% [6]; in Europe and other developed countries, reported rates range between 5% and 20% [1]. A study of data collected in 23 developing countries throughout Asia, Africa and Latin America reported a prevalence of macrosomia that ranged from 0.5% (India) to 14.9% (Algeria) [5]. The rate of macrosomia has risen in most developed countries in the past two decades, despite advancing knowledge of risk factors and mechanisms related to macrosomia. This trend may be due to an increase in the prevalence of diabetes and obesity in women of reproductive age [1, 5].
Macrosomia is associated with adverse maternal and infant outcomes, therefore it is important to predict this condition according to its risk factors. Determining a class of binary response variables for a new subject can be performed by classification methods. Several methods have been used, including data mining (machine learning) techniques [7]. There are two main steps in a classification process. First, determination of the best model by fitting the methods on a training dataset. The second step tests the resultant model from the previous step [8]. Several criteria such as sensitivity (SE), specificity (SP) and accuracy (ACC) can be used to compare classification methods [9].
Logistic regression (LR) is the most popular method to classify discrete response variables based on a number of factors and covariates. However, random forest (RF) is preferable when there are huge numbers of predictors and the response is discrete [10]. Artificial neural network (ANN), as a non-linear, flexible, and general tool, is capable of dealing with most arbitrary functions [11].
This study aims to determine risk factors and covariates that affect macrosomia as a binary response variable by using three different classification methods - LR, RF and ANN. We compare these methods using different evaluation tools in terms of SE, SP and ACC.
MATERIALS AND METHODS
Participants and study design
We conducted this cross-sectional study on 4342 pregnant females who referred to maternity hospitals in Tehran, the capital city of Iran. We collected the data from July 6th to July 21st, 2015. A checklist was provided
to collect the data on demographic characteristics of
each mother, the midwife, and new-born information. A trained nurse completed the checklists by an interview with the mother and by abstraction of her records in the hospital delivery room. We recorded variables such as mother’s age, education, occupation, socioeconomic status (SES), body mass index (BMI), type of pregnancy, preeclampsia, history of abortion and history of stillbirth. Macrosomia and preeclampsia were determined by a weight over 4000 grams and blood pressure over 140/90 mmHg, respectively. A principle component analysis was performed on questionnaires that pertained to home appliances, digital goods, and to determine the SES of each family. The Ethics Committee of Royan Institute, Tehran, Iran approved this study. Nurses and midwives verbally explained the aims and objective of this study and data confidentiality to the women prior to their participation. All participants gave written informed consent before completing the measures.
Statistical analysis
The response variable was the occurrence of macrosomia as a binary outcome. The independent variables were mother’s age, mother’s education (academic/non-academic), mother’s occupation (housewife, employed), SES, mother’s BMI, parity, gestational age, unwanted pregnancy (yes/no), history of abortion (yes/no), history of stillbirth (yes/no), male infant sex (yes/no), preterm birth (yes/no), preeclampsia (yes/no), and use of assisted reproductive technology (ART).
The train and test sets were composed randomly among cases. The train set (70% of cases) was used for model fitting. The resultant models were then evaluated by the test sample (30% of cases). Tools used to compare the methods included SE, SP, positive predictive value (PPV), negative predictive value (NPV) and ACC.
Logistic regression (LR):
The most common parametric tool to model binary outcomes is LR. The model can be written as:
In this model, xi ’s are the covariates or factors. and the i’s are “k+1” regression coefficients that state the measure of effect size. The odds, , indicate the odds ratio of classifying the response in category one (success) than zero (failure) [12]. The results include the odds ratio of macrosomia occurrence in one group compared to another group. We used the Hosmer-Lemeshow test to check the adequacy of the model.
Artificial neural network (ANN):
models. ANN includes layers as input, output and hidden with nodes in each layer. An activation function transforms the data in each layer to the latter by introducing a degree of non-linearity. The input layer consists of all risk factors that affect macrosomia, including six variables. The response variable is shown in the output layer with two nodes as the possible outcomes for macrosomia. In order to determine the best performance of the network, a complicated non-linear mapping is found between the input and output layers using the number of nodes which have been empirically determined in the hidden layer [13]. The results of this method reveal the importance of the variables according to a scale of zero to one. We have chosen the best model among the different ANN models by using the percentage of correct predictions.
Random forest (RF):
RF models have been proposed by Breiman [10]. The RF model is a collection of classification and regression trees. The trees in this method are built by a replacement sampling of the main dataset. An “out-of-bag” sample consists of the rest of data and evaluates the performance of the trees. The trees create nodes using variables that assess the response variable and a random subset of covariates is chosen at the nodes. Selection of a covariate to split the node into subsequent nodes is determined by a covariate which causes the largest decrease in the Gini impurity criterion. If splitting a variable provides the process with the purity of classification in a certain class, the mean decrease Gini index will tend to be low. Therefore, the mean decrease Gini will be high as well as mean decrease ACC. After an iteration history, the final nodes contain only cases assigned to the same classes. Averaging predictions made by numerous trees allows for the prediction of a case at RF [10]. The importance of variables is determined based on comparing mean decrease Gini and ACC. An out-of-bag error, as an unbiased estimate of the true prediction error, has been used to determine the best RF.
In order to check the adequacy of the models, we calculated indices such as SE, SP, ACC, PPV, NPV, and area under curve (AUC) by using the observed data as the gold standard. The Cochran-Q test was used to check differences in proportion among the three methods. After checking for normality of the data, we used the independent samples t-test to locate any mean differences in continuous variables between the two groups. The chi-square independence test was applied to compare the proportions in two groups. We used the McNemar’s test to check multiple comparisons. In order to assess the association between observed and predicted values, we calculated the Ø coefficient, contingency coefficient and Kendall’s tau-b. Kappa statistic was calculated to find the agreement between the results and observed values for macrosomia. All statistical analyses were performed using statistical programing R software version 3.2.3 (http://www.r-project.org). All statistical tests were two-tailed and a p-value of less than 0.05 was considered statistically significant.
RESULTS
Of 4342 births included in this study, 147 (3.4%) had macrosomia. There were 67.4% non-academic mothers, 87.9% housewives, 80.7% wanted pregnancies, 80.7% with no history of abortion, 98.2% with no history of stillbirth, 50.8% male infants, 94.8% with no preeclampsia history, and 92.7% of participants did not undergo ART. The mothers had a mean (standard deviation) age of 29.15 (5.32) years (range: 15 to 57). Table 1 shows the descriptive characteristics of patients in the groups of macrosomia and non-macrosomia. The macrosomia group had significantly higher mothers’ age, BMI, and gestational age (p<0.05). Female infants had less macrosomia compared to male infants. Women with histories of stillbirth were more prone to experience macrosomia.
In order to identify the risk factors that affected macrosomia, we analysed the data according to the LR, ANN and RF methods. There were 1316 (30%) cases for the test samples and 3026 (70%) cases comprised the train samples. The test sample evaluated the results from the training sample. We considered mother’s age, SES, mother’s BMI, parity, gestational age, mother’s education, mother’s occupation, type of pregnancy, history of abortion and stillbirth, infant sex, preeclampsia and ART as the explanatory variables for the performed methods. The demographic and clinical characteristics of the training and test sets are shown in Table 2. With the exception of preeclampsia (p=0.024), there were no statistical differences observed between the test and training sets.
We tested several ANN models and determined the best model based on the least prediction error. The ANN was carried out using 21 nodes for the input layer and seven units in the hidden layer. Hyperbolic tangent was used as the activation function for the hidden layer. The occurrence of macrosomia was considered as the event for the binary response variable. The output layer included two units. Hyperbolic tangent and softmax were the activation functions for the hidden and output layers, respectively. The importance of the variables is shown in Figure 1. The importance of the variables is presented by scores using SE analysis. The higher the variable scores, the more effective the risk factor is.
was not statistically significant (p=0.075). The Hosmer-Lemeshow test showed a significant good fitting of the data by the test sample (chi-square: 9.122, df: 8, p=0.332).
According to mean decreases in the Gini and ACC indices, the results from RF indicated that the mother’s BMI, SES, education, parity, age, gestational age and occupation were the seven most important variables that classified macrosomia (Fig. 2). The out of bag estimate of error rate was 3.39%.
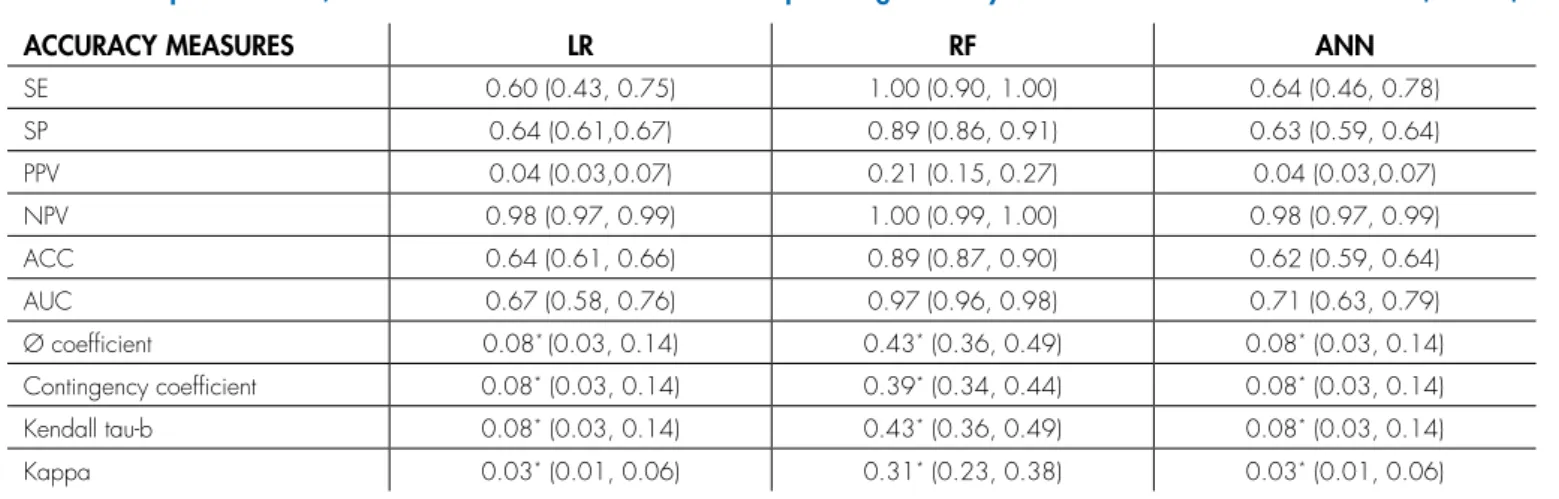
Table 4 shows the comparisons of SE, SP, positive probability value, negative probability value and ACC for the training and testing sets of the classification methods. The
ROC curve is shown in Figure 3. The 0.89 ACC of RF for classifying macrosomia significantly differed compared to the other two methods. Table 4 also shows the association of results from the performed methods with observed macrosomia. The Cochran-Q test resulted in differences between proportions in the different methods (Cochran-Q: 281.88, df: 2, p<0.001). Multiple comparisons adjusted for significance were performed using the McNemar test. The results showed a significant difference in proportions of LR versus RF (chi-square: 196, p<0.001) and ANN versus RF (chi-square: 249.59, p<0.001), whereas there was no statistical difference observed between the performances of
VARIABLES MACROSOMIA NON-MACROSOMIA P-VALUE
MEAN ± SD4 MEAN ± SD4
Mother’s age (years) 30.05 ± 4.71 29.11 ± 5.34 0.037
SES1 0.05 ± 1.90 0.02 ± 2.04 0.863
Mother’s BMI2 (kg/m2) 26.60 ± 3.88 24.93 ± 5.60 <0.001
Parity 1.85 ± 0.96 1.64 ± 0.75 0.001
Gestational age (weeks) 39.07 ± 1.19 38.59 ± 1.52 <0.001
N (%) N (%)
Mother’s education 0.986
Non-academic 99 (67.4) 2828 (67.4)
Academic 48 (32.7) 1367 (32.6)
Mother’s occupation 0.331
Housewife 133 (90.5) 3684 (87.8)
Employed 14 (9.5) 511 (12.2)
Type of pregnancy 0.905
Wanted 118 (80.3) 3384 (80.7)
Unwanted 29 (19.7) 811 (19.3)
History of abortion 0.765
No 120 (81.6) 3383 (80.6)
Yes 27 (18.4) 812 (19.4)
History of stillbirth 0.031
No 141 (95.9) 4124 (98.3)
Yes 6 (4.1) 71 (1.7)
Infant sex 0.002
Male 93 (63.3) 2113 (50.4)
Female 54 (36.7) 2082 (49.6)
Preeclampsia 0.359
No 137 (93.2) 3981 (94.9)
Yes 10 (6.8) 214 (5.1)
ART3 0.591
No 138 (93.9) 3889 (92.7)
Yes 9 (6.1) 306 (7.3)
LR and ANN (chi-square: 1.429, p=0.232). We calculated the Ø coefficient, contingency coefficient and Kendall tau-b in order to evaluate the associations of the methods’ predictions with the observed value for macrosomia. The results demonstrated that RF had the best performance compared to the other methods. In addition, the kappa statistic showed a significantly higher agreement between RF results and observed macrosomia compared to LR and ANN.
DISCUSSION
This study assessed the impact of several variables on macrosomia. We compared three classification methods - LR, RF and ANN. RF was the best classifier method. According to the results, mother’s BMI, SES, education, parity, age, gestational age, and occupation were the most important variables that affected macrosomia.
VARIABLES TESTING SAMPLE (N=1316) TRAINING SAMPLE (N=3026) P-VALUE
MEAN ± SD4 MEAN ± SD4
Mother’s age (years) 29.25 ± 5.23 29.10 ± 5.36 0.374
SES1 0.02 ± 1.99 0.02 ± 2.05 0.932
Mother’s BMI2 (kg/m2) 25.08 ± 6.02 24.94 ± 5.33 0.451
Parity 1.66 ± 0.77 1.64 ± 0.75 0.339
Gestational age (weeks) 38.57 ± 1.62 38.62 ± 1.45 0.359
N (%) N (%)
Macrosomia 0.231
Positive 38 (2.9) 109 (3.6)
Negative 1278 (97.1) 2917 (96.4)
Mother’s education 0.093
Non-academic 911 (69.2) 2016 (66.6)
Academic 405 (30.8) 1010 (33.4)
Mother’s occupation 0.368
Housewife 1148 (87.2) 2669 (88.2)
Employed 168 (12.8) 357 (11.8)
Type of pregnancy 0.713
Wanted 1057 (80.3) 2445 (80.8)
Unwanted 259 (19.7) 581 (19.2)
History of abortion 0.914
No 1063 (80.8) 2440 (80.6)
Yes 253 (19.2) 586 (19.4)
History of stillbirth 0.933
No 1293 (98.3) 2972 (98.2)
Yes 23 (1.7) 54 (1.8)
Infant sex 0.104
Male 644 (48.9) 1562 (51.6)
Female 672 (51.1) 1464 (48.4)
Preeclampsia 0.024
No 1233 (93.7) 2885 (95.3)
Yes 83 (6.3) 141 (4.7)
ART3 0.846
No 1219 (92.6) 2808 (92.8)
Yes 97 (7.4) 218 (7.2)
The prevalence of macrosomia was 3.4% which differed from another study conducted in Iran and developed countries. Henriksen [1], Hamilton et al. [14], and Koyanagi et al. [5] reported decreased prevalences of macrosomia. This study showed a significant impact of mother’s BMI on macrosomia. Jolly et al. studied the effects of pre-pregnancy BMI and gestational weight gain on fetal macrosomia. They found that mothers with high BMI values had higher rates of macrosomia. The current study results confirmed those reported by other studies [15].
Our study showed that mother’s age could be considered an important risk factor for macrosomia. This result agreed with other studies [5, 16, 17]. Jolly et al. evaluated the risk factors for macrosomia and its clinical consequences in a study on 350,311 pregnancies. They
showed that mothers over 40 years of age were more prone to experience macrosomia [15].
Gestational age and parity played significant roles in the onset of macrosomia. More numbers of births indicated a higher risk of macrosomia. Stotland et al. studied the epidemiology of macrosomia and characterised related maternal complications. Gestational age over 41 weeks was introduced as an affective risk factor for macrosomia [18]. Koyanagi et al. and Chatfield confirmed these findings [5, 15, 16]. Althought RF analysis showed that mother’s occupation had a nonsignificant impact on macrosomia, studies by Mardani et al. [19] and Bian et al. [20] reported different conclusions. We determined that educated mothers and those with better SES scores could reduce the rate of macrosomia. Boulet et al. described
FIGURE 2. Random forest plot of mean dicrease Gini and accuracy (ACC).
ACCURACY MEASURES LR RF ANN
SE 0.60 (0.43, 0.75) 1.00 (0.90, 1.00) 0.64 (0.46, 0.78)
SP 0.64 (0.61,0.67) 0.89 (0.86, 0.91) 0.63 (0.59, 0.64)
PPV 0.04 (0.03,0.07) 0.21 (0.15, 0.27) 0.04 (0.03,0.07)
NPV 0.98 (0.97, 0.99) 1.00 (0.99, 1.00) 0.98 (0.97, 0.99)
ACC 0.64 (0.61, 0.66) 0.89 (0.87, 0.90) 0.62 (0.59, 0.64)
AUC 0.67 (0.58, 0.76) 0.97 (0.96, 0.98) 0.71 (0.63, 0.79)
Ø coefficient 0.08* (0.03, 0.14) 0.43* (0.36, 0.49) 0.08* (0.03, 0.14)
Contingency coefficient 0.08* (0.03, 0.14) 0.39* (0.34, 0.44) 0.08* (0.03, 0.14)
Kendall tau-b 0.08* (0.03, 0.14) 0.43* (0.36, 0.49) 0.08* (0.03, 0.14)
Kappa 0.03* (0.01, 0.06) 0.31* (0.23, 0.38) 0.03* (0.01, 0.06)
SE: Sensitivity; SP: Specificity; ACC: Accuracy; PPV: Positive predictive value; NPV: Negative predictive value; LR: Logistic Regression; RF: Random Forest; ANN: Artificial Neural Network; AUC: Area Under Curve
* P-value <0.05
TABLE 4. Comparison of LR, RF and ANN methods for the test sample using accuracy tools with 95% confidence interval (95% CI).
FIGURE 3. ROC curve comparing the three classification methods - logistic regression (LR), random forest (RF), and artificial neural network (ANN).
VARIABLES
TRAINING SET TEST SET
ESTIMATE SE3 OR2ADJUSTED
(95% CI4) P-VALUE ESTIMATE SE3
OR2 ADJUSTED
(95% CI4) P-VALUE
BMI¹ 0.024 0.011 (1.002, 1.046)1.024 0.033 0.021 0.013 (0.995,1.048)1.021 0.109
Parity 0.249 0.115 (1.024, 1.608)1.283 0.030 0.433 0.165 (1.115, 2.132)1.542 0.009
Gestational
age 0.269 0.080 (1.118, 1.531)1.308 0.001 0.266 0.092 (1.090, 1.561)1.305 0.004
Male infant
sex -0.541 0.204 0.582 (0.390, 0.868) 0.008 -0.614 0.345 (0.275, 1.063)0.541 0.075
maternal risk factors for macrosomia and assessed birthweight categories to determine predictive thresholds of adverse outcomes. They realised that higher numbers of mothers in the macrosomic groups had higher educational level, high parity for age and previous macrosomic births [3]. Park et al. reported that the socioeconomic situation influenced pregnancy outcomes such as macrosomia [21].
This study showed that out of the three different classification methods (RF, LR and ANN) for our data, the RF method significantly had the best performance. The RF outperformed among the mentioned methods and has shown both the highest association between RF predicted and observed values as well as the highest ACC. RF, as a non-parametric approach, can classify large amounts of data which handles a large number of input variables. In the case of missingness in the data, RF can provide effective approaches. In this method, each tree is built based on recursive partitioning and the prediction is made on the average of a set of trees rather than one tree. This method averages multiple trees from bootstrapped data sets [22].
ANN is non-parameteric method without any distributional assumption. This non-linear approach requires a large number of data according to the number of independent variables. ANN can detect complex nonlinear relationships between dependent and all possible ineractions among independent variables. This method requires complex computations [23].
The parametric LR uses a modeling approach. LR provides tools for understandable interpretations using odds ratios. A large number of input variables can cause collinearity. The number of input variables depends on the successes in the response variable. Semi or complete separation occurs when the outcome variable separates a predictor variable or a combination of predictor variables, resulting in complexities in the modeling process [12]. A number of studies have been performed with various medical, clinical and public health datasets in an attempt to compare classification methods [24-27].
Maroco et al. compared data mining methods to predict dementia. They assessed classification methods such as linear discriminant analysis, LR, neural networks, support vector machines, classification trees and RF. The researchers compared SE, SP, and overall classification ACC of these methods and concluded that RF and linear discriminant analysis ranked better than the other classification methods. They proposed that the RF classification method could improve ACC, SE and SP of dementia predictions from neuropsychological testing [24]. Mansiaux and Carrat suggested the use of data mining methods such as RF to be considered as credible alternatives to multivariate LR [28].
In addition to limitations such as low prevalence of binary macrosomia, the study sample might not represent the general population of patients. This study compared three different methods. The results suggested that RF was
the best classifier model, which might help policymakers to determine macrosomia risk factors. Based on our findings, the RF method had a better performance in classifying macrosomia compared to LR and ANN. The capability of this method in dealing with large numbers of variables could make it the first choice method for classification of this type of data.
Acknowledgements
This study was funded by Royan Institute for Reproductive Biomedicine, ACECR, Tehran, Iran. The authors would like to express their appreciation to those who participated in this study and to the staff at the hospitals of Tehran University of Medical Sciences, Shahid Beheshti University of Medical Sciences, Iran University of Medical Sciences and Islamic Azad University.
References
1. Henriksen T. The macrosomic fetus: a challenge in current obstetrics. Acta obstetricia et gynecologica Scandinavica 2008;87(2):134-45. 2. Haram K, Pirhonen J, Bergsjø P. Suspected big baby: a difficult
clinical problem in obstetrics. Acta obstetricia et gynecologica Scandinavica 2002;81(3):185-94.
3. Boulet SL, Alexander GR, Salihu HM, Pass M. Macrosomic births in the United States: determinants, outcomes, and proposed grades of risk. American journal of obstetrics and gynecology 2003;188(5):1372-8. 4. Harder T, Rodekamp E, Schellong K, Dudenhausen JW, Plagemann
A. Birth weight and subsequent risk of type 2 diabetes: a meta-analysis. American journal of epidemiology 2007;165(8):849-57. 5. Koyanagi A, Zhang J, Dagvadorj A, et al. Macrosomia in 23
developing countries: an analysis of a multicountry, facility-based, cross-sectional survey. The Lancet 2013;381(9865):476-83. 6. Hamilton B, Martin J, Osterman M, Curtin S, Matthews T. Births:
final data for 2014. Natl Vital Stat Rep 2015;64(12):1-64. 7. Han J, Kamber M. Data mining: concepts and techniques (the
Morgan Kaufmann Series in data management systems). 2000. 8. Tan P-N, Steinbach M, Kumar V. Introduction to data mining.
Pearson Addison Wesley, Boston, 2006.
9. Kantardzic M. Data mining: concepts, models, methods, and algorithms. John Wiley & Sons, 2011.
10. Breiman L. Random forests. Machine learning 2001;45(1):5-32. 11. Delen D, Oztekin A, Tomak L. An analytic approach to better
understanding and management of coronary surgeries. Decision Support Systems 2012;52(3):698-705.
12. Agresti A, Kateri M. Categorical data analysis. Springer, 2011. 13. Ayat S, Farahani HA, Aghamohamadi M, Alian M, Aghamohamadi
S, Kazemi Z. A comparison of artificial neural networks learning algorithms in predicting tendency for suicide. Neural Computing and Applications 2013;23(5):1381-6.
14. Hamilton B MJ, Osterman M, Curtin S, Matthews T. Births: final data for 2014. Natl Vital Stat Rep 2015;64(12):1-64.
pregnancies. European Journal of Obstetrics & Gynecology and Reproductive Biology 2003;111(1):9-14.
16. Chatfield J. ACOG issues guidelines on fetal macrosomia. American College of Obstetricians and Gynecologists. American family physician 2001;64(1):169.
17. Kenny LC, Lavender T, McNamee R, O’Neill SM, Mills T, Khashan AS. Advanced maternal age and adverse pregnancy outcome: evidence from a large contemporary cohort. PloS one 2013;8(2):e56583.
18. Stotland N, Caughey A, Breed E, Escobar G. Risk factors and obstetric complications associated with macrosomia. International journal of gynecology & obstetrics 2004;87(3):220-6.
19. Mardani M, Kazemi K, Mohsenzadeh A, Ebrahimzade F. Investigation of Frequency and Risk Factors of Macrosomia in Infants of Asali Hospital of Khoramabad City. Iranian Journal of Epidemiology 2013;8(4):47-53.
20. BIAN X-Y, WU H-H, CHEN J. A case-control study on risk factors of 659 fetal macrosomia. Maternal and Child Health Care of China 2006;22:018.
21. Park JH, Lee BE, Park HS, Ha EH, Lee SW, Kim YJ. Association between prepregnancy body mass index and socioeconomic status and impact on pregnancy outcomes in Korea. Journal of Obstetrics and Gynaecology Research 2011;37(2):138-45.
22. Yoo W, Ference BA, Cote ML, Schwartz A. A comparison of logistic regression, logic regression, classification tree, and random forests to identify effective gene-gene and gene-environmental interactions. International journal of applied science and technology 2012;2(7):268.
23. Dreiseitl S, Ohno-Machado L. Logistic regression and artificial neural network classification models: a methodology review. Journal of biomedical informatics 2002;35(5):352-9.
24. Maroco J, Silva D, Rodrigues A, Guerreiro M, Santana I, de Mendonça A. Data mining methods in the prediction of Dementia: A real-data comparison of the accuracy, sensitivity and specificity of linear discriminant analysis, logistic regression, neural networks, support vector machines, classification trees and random forests. BMC research notes 2011;4(1):299.
25. Moraes R, Valiati JF, Neto WPG. Document-level sentiment classification: An empirical comparison between SVM and ANN. Expert Systems with Applications 2013;40(2):621-33.
26. Salazar DA, Vélez JI, Salazar JC. Comparison between SVM and logistic regression: Which one is better to discriminate? Revista Colombiana de Estadística 2012;35(2):223-37.
27. Verplancke T, Van Looy S, Benoit D, Vansteelandt S, Depuydt P, De Turck F, et al. Support vector machine versus logistic regression modeling for prediction of hospital mortality in critically ill patients with haematological malignancies. BMC Medical Informatics and Decision Making 2008;8(1):1.