Impact Evaluation:
New Hampshire Home
Performance with
ENERGY STAR
®
Program
Prepared for:
NH Public Utilities Commission
Energy North Natural Gas, Inc. d/b/a National Grid NH Northern Utilities, Inc., d/b/a Unitil
Public Service Company of New Hampshire Unitil Energy Systems, Inc.
Prepared by:
The Cadmus Group, Inc. / Energy Services NMR Group, Inc.
Prepared by:
Robert Huang
Lauren Mattison
Tony Larson
David Korn
David Korn
Vice President
The Cadmus Group, Inc.
Table of Contents
Executive Summary ... 1 Introduction ... 6 Methods ... 8 Site Visits ... 8 Engineering Analysis... 10Census Billing Analysis ... 10
Data Gathering...10
Initial Data Analysis. ...11
Data Screening...12
Model Specification...12
Preliminary Oil and Propane Billing Analysis ... 14
Meta Analysis... 14
Findings ... 15
Observations from the Site Visits ... 15
Unit Savings for Engineering Analysis ... 18
Shell Measure Unit Savings...19
CFL Unit Savings ...20
Hot Water Measure Unit Savings ...22
Refrigerator Unit Savings ...22
Breakdown of Realized Utility Savings... 23
Billing Analysis ... 26
Gas ...26
Electric...27
Oil and Propane ...28
Meta Analysis... 28
Program Level Results ... 32
Engineering Analysis... 32
Combining Engineering and Fuel Billing Analysis ... 33
Executive Summary
This report presents the results of the impact evaluation of the 2009-2010 New Hampshire Home Performance with ENERGY STAR® (HPwES) program. The evaluation was conducted by the Cadmus team (The Cadmus Group, Inc. and NMR Group, Inc.) for the New Hampshire Public Utility Commission and the program administrators (PAs), which included National Grid Gas1, Public Service of New Hampshire (PSNH), and Unitil (Gas2 and Electric3).
For the impact analysis, Cadmus conducted 127 site visits and measured specific unit savings through engineering review and simulation modeling. In addition, Cadmus conducted gas, electric and fuel billing analyses to provide additional estimates of savings. Finally, a meta-analysis was performed to examine savings data and information from similar programs. Presented below are the general conclusions and recommendations of these efforts:
HPwES programs were successful with high participation rates and high savings per participant compared to other home energy performance programs. Comparable programs in other states have closure rates less than 30%. With their Home Heating Index screening process and audit fee, PSNH and Unitil programs had closure rates of 80% to 95%. National Grid Gas, without a screening process or audit fee, had a closure rate of 40% and began to charge an audit fee in 2011.
Cadmus field staff received positive feedback from many program participants.
Field staff described participants as very satisfied with the services and incentives they received. Participants reported being more comfortable in their homes and seeing a noticeable decrease in their fuel bills.
Cadmus combined engineering and billing analyses to estimate utility savings. Cadmus averagedthe results of the engineering analysis and gas billing analysis to
establish savings estimates and calculate gross realized savings for National Grid Gas and Unitil Gas. For PSNH and Unitil Electric, electric billing analysis established lighting measure unit savings estimates, and engineering analysis was used to determine savings for other measures.
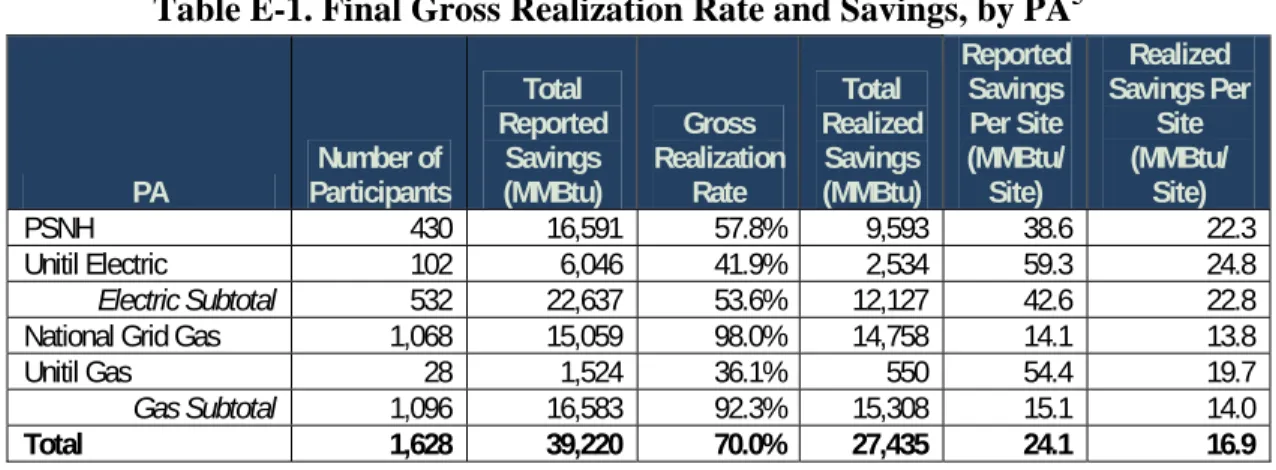
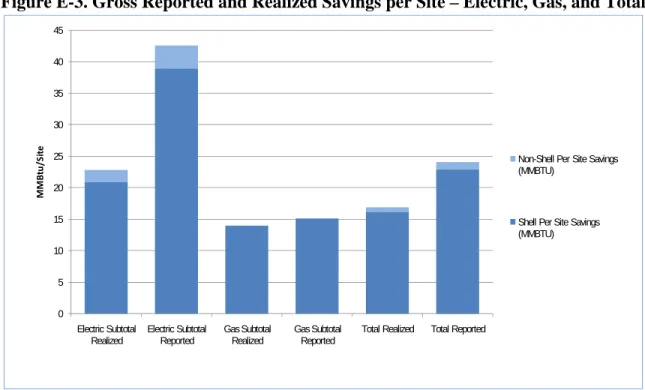
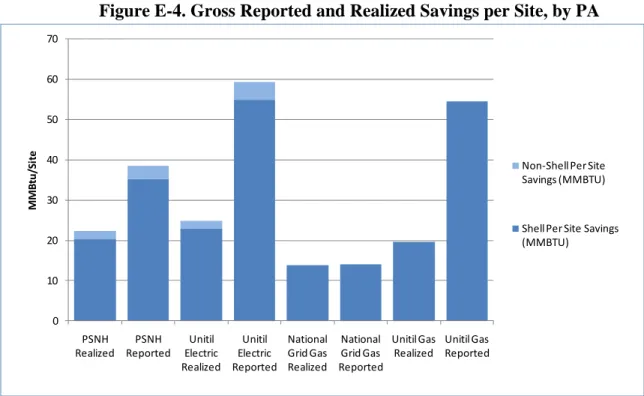
Realization rates varied widely among the PAs – from 36% to 98%. Table E-1 shows the final gross realization rates, total reported and realized savings, and reported and realized savings per site. Realization rates varied primarily because reported savings estimates varied widely, by about a factor of four, as each PA employed a different method for estimating reported savings. Low realization rates were most likely due to high unit saving estimates for insulation driven by underestimated base R-values of construction/insulation. Figures E-1 and E-2 show total reported and realized savings by gas PAs (National Grid and Unitil Gas) and electric PAs (PSNH and Unitil Electric) and by specific PA, respectively. Figures E-3 and E-4 show total reported and realized savings per site by gas PAs and electric PAs and by specific PA, respectively. Figures
1
EnergyNorth Natural Gas, Inc. d/b/a National Grid NH
2
Northern Utilities, Inc. d/b/a Unitil
3
E-1 through E-4 show shell and non-shell measures for each grouping as well. Cadmus has several recommendations:
o Cadmus analyzed the drivers of the low realization rates and it appears that the average savings for attic, wall and basement insulation calculated by the Targeted Residential Energy Analysis Tool (TREAT) and the PSNH unit savings values are high due to several factors including incorrectly established baseline R-value. During installation of shell measures, contractors should focus on establishing the correct baseline R-value in order to more accurately estimate savings. In addition, PAs should evaluate limiting shell measure installation to homes with lower existing insulation levels. Cadmus also found in discussions with Unitil that some sites had high predicted savings because a particular contractor did not correctly use TREAT.
o National Grid Gas and Unitil Gas should collect more data on the use of supplemental heat sources at homes in their service territories to ensure that all savings are captured. Billing analysis only captures energy use and savings of the primary heating fuel, and does not capture use of supplemental fuels. During site visits, we found that 13% of National Grid Gas sites and 20% of Unitil Gas sites used supplemental fuels – mainly wood stoves.
o Unitil Gas and Unitil Electric should ensure that detailed information on implemented measures is collected, to allow for the calculation of more precise savings estimates. The engineering analysis of Unitil sites was limited by incomplete descriptions of insulation work.
o Unitil should consider using unit savings instead of the TREAT simulation model to estimate savings at sites. The benefit of a simpler approach is that it is easier for contractors to use and may improve the data that contractors use to establish savings. Cadmus is willing to work with Unitil and PSNH to develop a standard set of unit savings for measures to be used consistently across New Hampshire.4
4
At the time of the final report, Cadmus is reviewing PSNH unit savings estimates and will be working with them to update their unit savings.
Table E-1. Final Gross Realization Rate and Savings, by PA5 PA Participants Number of Total Reported Savings (MMBtu) Gross Realization Rate Total Realized Savings (MMBtu) Reported Savings Per Site (MMBtu/ Site) Realized Savings Per Site (MMBtu/ Site) PSNH 430 16,591 57.8% 9,593 38.6 22.3 Unitil Electric 102 6,046 41.9% 2,534 59.3 24.8 Electric Subtotal 532 22,637 53.6% 12,127 42.6 22.8
National Grid Gas 1,068 15,059 98.0% 14,758 14.1 13.8
Unitil Gas 28 1,524 36.1% 550 54.4 19.7
Gas Subtotal 1,096 16,583 92.3% 15,308 15.1 14.0
Total 1,628 39,220 70.0% 27,435 24.1 16.9
Figure E-1. Gross Reported and Realized Total Savings – Electric, Gas, and Total
‐ 5,000 10,000 15,000 20,000 25,000 30,000 35,000 40,000 45,000 Electric Subtotal Realized Electric Subtotal Reported Gas Subtotal Realized Gas Subtotal Reported
Total Realized Total
Reported
MMB
tu Non‐Shell Total Savings
(MMBTU) Shell Total Savings
(MMBTU)
5
These savings figures include both gas and electric savings. Electric savings were converted to MMBtu. Cadmus estimates PSNH measure savings to be 6% electric savings; Unitil Electric measure savings to be 3% electric; and National Grid Gas/Unitil Gas to be less than 0.4%.
Figure E-2. Gross Reported and Realized Total Savings, by PA 0.0 2000.0 4000.0 6000.0 8000.0 10000.0 12000.0 14000.0 16000.0 18000.0 PSNH Realized PSNH Reported Unitil Electric Realized Unitil Electric Reported National Grid Gas Realized National Grid Gas Reported Unitil Gas Realized Unitil Gas Reported MMB
tu Non‐Shell Total Savings
(MMBTU)
Shell Total Savings
(MMBTU)
Figure E-3. Gross Reported and Realized Savings per Site – Electric, Gas, and Total
0 5 10 15 20 25 30 35 40 45 Electric Subtotal
Realized Electric Subtotal Reported Gas Subtotal Realized Gas Subtotal Reported Total Realized Total Reported
MM B tu /S it e
Non-Shell Per Site Savings (MMBTU)
Shell Per Site Savings (MMBTU)
Figure E-4. Gross Reported and Realized Savings per Site, by PA 0 10 20 30 40 50 60 70 PSNH Realized PSNH Reported Unitil Electric Realized Unitil Electric Reported National Grid Gas Realized National Grid Gas Reported Unitil Gas Realized Unitil Gas Reported MMB tu /S it e
Non‐Shell Per Site
Savings (MMBTU)
Shell Per Site Savings
(MMBTU)
Analysis of oil heated homes in PSNH territory may indicate higher savings. An analysis of the oil bills of 13 customers yielded an average annual savings of 33 MMBtu/site. Cadmus engineering analysis for these same houses indicated a similar savings of 34 MMBtu/site. Cadmus recommends that this analysis be expanded in the future to include a statistically significant sample across both electric utilities.
Cadmus discovered some issues during site visits. Twenty-nine percent of CFLs were found in storage, insulation was sometimes installed incorrectly in a small number of instances, and hot water temperature setback did not always persist (two out of five sites examined appeared to have been re-set to their original temperature setting). Cadmus recommends that contractors and quality assurance personnel should be made aware of these issues during their training and continuing education sessions.
Introduction
New Hampshire’s Home Performance with ENERGY STAR (HPwES) pilot program improves the efficiency of the existing housing stock in New Hampshire by assisting customers with improvements to the energy efficiency of their homes. Services include insulation, air sealing, and cost-effective appliance and lighting upgrades. Participating customers can receive up to $4,000 in program services. Copayments are required and are determined based on the measures installed. The program also has an educational component designed to help customers better understand their home and the factors that affect energy use.
This report summarizes an impact evaluation of the program conducted between March 16 and May 20, 2011 by the Cadmus Group, Inc. (Cadmus). The purpose of this evaluation was to examine the following programs:
Public Service Company of New Hampshire’s (PSNH) and Unitil Electric’s HPwES fuel neutral pilot program.
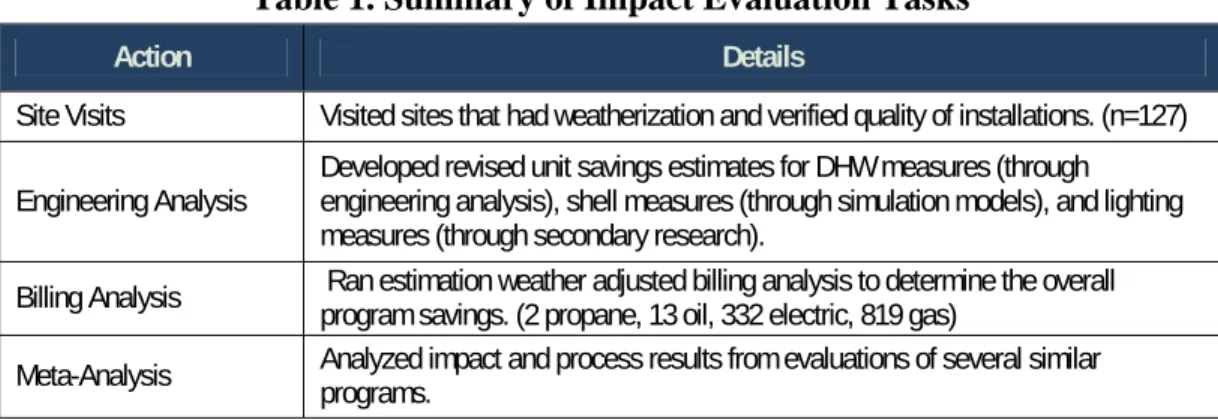
Unitil Gas’ and National Grid Gas’ weatherization program (also branded as HPwES). Cadmus used a variety of techniques to evaluate the impact of the HPwES program (see Table 1). Cadmus visited 127 sites and conducted an engineering analysis (including engineering review and simulation modeling6) to estimate program savings and gross realization rates. Cadmus performed gas, electric, oil, and propane billing analyses to provide additional estimates of savings. The billing analyses included a census analysis of 819 gas bills, a review of 332 electric bills, and an analysis of 13 oil and 2 propane bills (acquired from customers during site visits). A meta-analysis was also performed to examine savings data and information from similar programs. Finally a process evaluation was conducted by Cadmus team member NMR Group, Inc., and the results are included in a separate report.
Table 1. Summary of Impact Evaluation Tasks
Action Details
Site Visits Visited sites that had weatherization and verified quality of installations. (n=127) Engineering Analysis Developed revised unit savings estimates for DHW measures (through engineering analysis), shell measures (through simulation models), and lighting
measures (through secondary research).
Billing Analysis Ran estimation weather adjusted billing analysis to determine the overall program savings. (2 propane, 13 oil, 332 electric, 819 gas) Meta-Analysis Analyzed impact and process results from evaluations of several similar programs.
The impact analysis for this group of PAs produced varied results because each PA used a different technique to estimate savings.
6
Cadmus used the RESNET REM/Rate software to model a typical home, and then calculated shell measure unit savings per square foot.
Unitil Gas and Unitil Electric used the Targeted Residential Energy Analysis Tool (TREAT) to estimate savings for each participant.
PSNH mainly used deemed savings based upon the 2008 United Illuminating and Connecticut Light & Power Program Saving Document to estimate savings by measure type on a per unit basis for each participant. On occasion, PSNH pulled 2006, 2007, and 2008 data from its Online Tracking Tool for Energy Retrofits (OTTER) database to estimate savings. Values from OTTER were based on TREAT outputs.
National Grid Gas used the results of a previous billing analysis to estimate a uniform average savings value for all participants.
Table 2 shows the total and average site reported savings by PA, based on program database extracts provided to Cadmus. The range of savings is wide, with National Grid Gas at 14.1 MMBtu per participant and Unitil Gas approximately four times higher at 59.3 MMBtu per participant. Based on this range, Cadmus expected varying gross realization rates across PAs.
Table 2. Summary of Reported Savings
PA ParticipantsNumber of Total Reported Savings (MMBtu) Reported Savings Per Participant (MMBtu/Participant) Impact Estimation Method PSNH 430 16,591 38.6 Deemed Savings
National Grid Gas 1,068 15,059 14.1 Billing Analysis Flat Rate
Unitil Electric 102 6,046 59.3 TREAT
Unitil Gas 28 1,524 54.4 TREAT
Total 1,628 39,220 24.1
Methods
Site Visits
Cadmus designed a site visit sample to reach the goal, stated in the RFP, of 90% confidence and ±10% precision (90/10) across gas and electric PAs separately. As shown in Table 3, we
estimated that 123 participant site visits would be required to reach 90/10.
Table 3. Projected Sample Sizes Needed for 90/10 across Electric and Gas PAs
Electric and Gas PA Groups ParticipantsNumber of
90/10 Sample Size w/ Finite Population
Correction
Statewide Electric PAs (PSNH and Unitil Electric) 532 60
Statewide Gas PAs (National Grid Gas and Unitil Gas) 1,096 63
Total 1,628 123
Cadmus used probability-proportional-to-size (PPS) sampling to select participants for site visits. In PPS sampling, the selection probability for each site is proportional to the size of its tracked energy savings. The sample included several backup sites to account for any customers not available for a site visit.
Cadmus visited sites over three weeks in April 2011. During these site visits, Cadmus technicians:
Offered a $25 incentive to participants to accept the site visit.
Recorded HVAC system information (efficiency, capacity, etc.) to enter into the REM/RateTM model used to develop deemed savings estimates for the shell measures.
Examined the ceiling insulation and ensured that the appropriate depth and type of ceiling insulation had been installed.
Examined the thickness of basement insulation.
Recorded where CFLs were installed.
Verified model numbers of installed appliances.
Recorded temperature settings of thermostats for use as an input in the REM/Rate model.
Confirmed installation of hot water measures. Checked aerator and showerhead flow rates through flow bags.
Recorded temperature setting of water heaters.
Confirmed installation of pipe insulation and tank wrap on water heaters.
Used infrared cameras to check that wall and ceiling insulation was installed
appropriately and assigned a RESNET® insulation grade. Average insulation grades for ceiling and wall insulation were used as inputs into REM/Rate model to develop unit
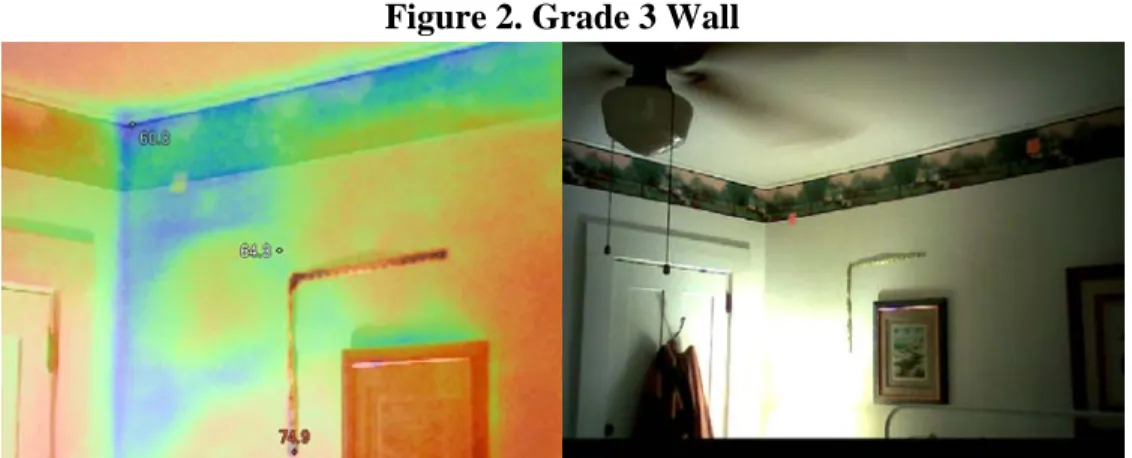
measure savings (e.g., MMBtu per square foot of wall insulation). Most wall insulation was assigned Grade 2 – the highest grade that can be assigned with a thermal camera.7 Figure 1 shows side by side infrared (left) and normal images (right). In Figure 1, the infrared photo shows a cooler blue area reading 60.1oF and warmer yellow area reading 65.4oF. The blue area represents a header where the solid wood has a lower insulation value than the surrounding insulation.
Figure 1. Side by Side Thermal Image and Photograph
Table 4 below shows that 127 sites visits were completed. All of the sites either had weatherization or air sealing installed.
Table 4. Number of Sites Visited Across Electric and Gas PAs
PA Number of Site Visits Air Sealing Weatherization
PSNH 43 41 43
Unitil Electric 18 15 18
National Grid Gas 61 39 46
Unitil Gas 5 4 5
Total 127 99 112
7
Grades for insulation are based on the percentage of area with a temperature anomaly of greater than 4oF. A temperature anomaly is not necessarily poorly installed insulation but in some cases can be structural components. Grade 2 is between 0.5% and 2% anomalies. Grade 3 is 2% to 5%. Grade 1 is less than 0.5% anomalies and is verified via visual inspection – therefore Grade 1 can only be determined during the audits for ceiling but not wall insulation. An anomaly is an area where the temperature distribution seen with an infrared imaging system differs by more than 4oF from the temperature distribution expected for the type of construction viewed. RESNET Interim
Engineering Analysis
Engineering analysis included developing a series of unit saving estimates to calculate realized savings based on measure data provided by the PAs. Cadmus developed unit savings values through a variety of techniques. For hot water, lighting, and appliance measures, we employed a combination of field results with secondary research and engineering analysis to establish unit savings. For shell measures, Cadmus used an REM/Rate8 model to simulate a home and varying shell measure installation levels.
Cadmus used the REM/Rate model to estimate unit savings values for air sealing, insulation (wall, ceiling, and basement/crawlspace), duct sealing and insulation, and hot water tank wrap. The model was run with a range of heating systems to capture heating system effects. For each heating system type, the model was run with a variety of wall, ceiling, and basement insulation values.
While the model was built for a home that reflected the average size, dimensions, and heating system efficiencies observed during site visits, insulation savings per square foot are determined by pre- and post-installation insulation levels, outside weather, heating system type, and indoor set points. The savings are nearly independent of the size of the house and other house attributes. This is based on engineering principles but was also tested in the model. A home was modeled then re-run changing a variety of parameters including windows and ceiling insulation. During these changes, the savings per square foot from installing wall insulation were unchanged. Model runs were conducted using varying insulation levels and heating systems, then a series of unit savings for shell measures were calculated.
Census Billing Analysis
Cadmus conducted a billing analysis on all HPwES participants by examining gas billing data from National Grid Gas and Unitil Gas, and electric billing data from PSNH and Unitil Electric. To estimate energy savings due to the program, Cadmus used a pre- and post-installation
Conditional Savings Analysis (CSA) for the gas savings analysis. Cadmus used a Statistically Adjusted Engineering (SAE) modeling approach using monthly data for the electric savings analysis. Separate models were performed for the gas and electric measures. Since detailed deemed savings estimates were available for the electric measures, the SAE modeling approach allowed for direct estimation of each program measure. The gas savings billing analysis was performed as a total, across all the measures, because National Grid Gas does not report savings at the measure level. Described below are the steps taken in the billing analysis.
Data Gathering. Data gathered from the PAs had the following characteristics:
Insulation and air sealing measures were the predominant gas measures installed.
8
REM/Rate software produces a home energy rating report based on the RESNET National HERS Technical Standards. Cadmus ran a series of tests comparing TREAT to REM/Rate and found they yielded similar results (within 5%) when the exact same assumptions (temperature profile, r-values, etc.) were used. In Cadmus’ opinion, where TREAT over-predicts savings, the cause is incorrect contractor inputs.
There were 1,049 National Grid Gas participants, and 60 Unitil Gas participants.
National Grid Gas did not estimate measure level unit savings, but instead estimated the typical measure package to save a total of 14.1 MMBtu. Unitil Gas provided detailed measure level modeled gas savings estimates.
The predominant electric savings measures installed were: CFLs, hot water measures (primarily showerheads and aerators), appliances (primarily refrigerators), and insulation measures.
There were 349 PSNH participants and 43 Unitil Electric participants with electric savings measures.
Both PSNH and Unitil Electric provided detailed measure-level data based on unit and modeled electric savings estimates, respectively.
Initial Data Analysis. Table 5 presents the billing data availability and the dates of installations for the four PAs used in the billing analysis. Initial data analysis included the following steps:
For each household, we defined the pre-installation period as the 12-month period before the earliest measure installation, and the post period as the months immediately after the latest measure was installed.
Due to data limitations and some customers installing measures into 2011, some participants had fewer than the standard 12 months of post-installation billing data. Therefore, we paired the pre and post months used in the billing analysis. This ensured that the same months were used in both the pre and post periods, to prevent bias of using mismatching months.
Next, we obtained daily weather data from 11 weather stations corresponding to the program participant zip codes. From the daily weather data, we obtained the heating and cooling degree days (using 65oF reference temperature). We then matched the participant billing data to the nearest weather station by zip code, and matched each monthly billing period to the associated heating and cooling degree days.
Table 5. Summary of Measure Installation Dates and Billing Data Received
Fuel / PA Earliest Measure Install Date Measure Latest Install Date
Earliest Read Date of Billing Data Received
Latest Read Date of Billing Data
Received
Natural Gas: National Grid Gas 1/1/2009 2/5/2011 1/1/2008 3/31/2011
Natural Gas: Unitil Gas 6/10/2009 12/6/2010 1/1/2007 4/6/2011
Electric: PSNH 6/5/2009 2/10/2011 7/21/2008 4/8/2011
Data Screening. Cadmus removed participants from the analysis if they had:
Fewer than three paired months in either the pre or post period.
Billing readings spanning less than 15 days or more than 70 days.
Imbalances in the number of pre or post months due to changes in the day that the meter was read, if the change was more than 70%.
Average usage less than 1 therm per day in either the pre or post period, which would indicate that homes were vacant.
Average usage less than 1 kWh per day in either the pre or post period, which would indicate that homes were vacant.
More than 13 therms per day in either the pre or post period, which would typically indicate a commercial account.
After applying these screens, 75% of the gas program participants, and 85% of the electric program participants remained for the modeling. The final modeling analysis groups consisted of 819 gas accounts and 332 electric accounts.
Model Specification. Our primary approach to obtaining the gas and electric savings was to use pre and post fixed-effects modeling methods that use pooled monthly time-series (panel) billing data. The modeling approach corrected for differences between the pre- and
post-installation weather conditions, as well as differences in usage consumption magnitudes between participants by estimating a separate intercept for each participant. Our approach assures that model savings estimates will not be skewed by any unusually high usage or low usage participants. The model specifications are described in greater detail below.
The following fixed-effects Conditional Savings Analysis (CSA) model specification was used to estimate the overall gas program savings.9 The model below was estimated separately for National Grid Gas and Unitil to obtain the PA-specific gas overall savings estimates:
it it AVGHDD it POST it AVGHDD i it ADC * 2 1
Where, for participant ‘i’ and monthly billing period ‘t’,
i is the average daily therm base load intercept for each participant, part of the fixed effects specification.
ADC it is the average daily therm consumption during the pre-, post-program period.
AVGHDDit is the average daily heating degree days (base 65) based on home location.
9
The gas measures installed were predominantly measures that affect heating use. To isolate the associated weather sensitive gas savings only, the model was run only on the subset of paired 8 non-summer months (October through May) with heating degree days.
POSTit is an indicator variable that is 1 in the post-period after the weatherization installation, and 0 in the pre-weatherization period.
POSTit * AVGHDDit is an interaction between the post indicator (POSTit) and the heating degree days (AVGHDDit).
it is the modeling estimation error.
β2 is the therm savings per heating degree day for the program.
The model estimates the savings per heating degree with β2. To obtain the actual savings under normal weather conditions, the annual average typical month year (TMY2) (1971-2000) normals from the National Climatic Data Center were applied to obtain the annual savings.
Since the measure level deemed estimates were readily available for all electric measures installed through the program, the following fixed-effects Statistically Adjusted Engineering (SAE) model specification was used to estimate the electric measure level savings10:
it it HVACENV it APPLIANCE it WATER it LIGHT it AVGCDD it AVGHDD i it ADC 1 2 3 4 5 6
Where, for participant ‘i’ and monthly billing period ‘t’,
i is the average daily electric base load intercept for each participant, part of the fixed effects specification.
ADCit is the average daily kWh consumption during the pre-, post-program period.
AVGHDDit is the average daily heating degree days (base 65) based on home location.
AVGCDDit is the average daily cooling degree days (base 65) based on home location.
LIGHTit is the average daily deemed savings estimate for lighting participants in the post period, and 0 otherwise.
WATERit is the average daily deemed savings estimate for hot-water measure installation participants in the post period, and 0 otherwise.
APPLIANCEit is the average daily deemed savings estimate for appliance measure installation participants in the post period, and 0 otherwise.
HVACENVit is the average daily deemed savings estimate for HVAC and envelope measure
installation participants in the post period, and 0 otherwise.11
it is the modeling estimation error
β3 is the realization rate for lighting measure installations. A coefficient of -0.9 indicates, that
the 90% of the deemed engineering measure level savings were achieved.
β4 is the realization rate for hot-water measure installations.
β5 is the realization rate for appliance measure installations.
β6 is the realization rate for HVAC and envelope measure installations.
10
Due to small sample sizes the Unitil savings could not be separated out, and the final models are based on a pooled billing analysis including billing data from both PAs. The detailed pooled measure level realization rates can then be applied to each specific PA.
11
The sample sizes for envelope measures was very low, and the measure level savings estimates could not be separated across these two measures.
Each of the specific SAE model realization rates was directly multiplied by the actual deemed estimate to obtain the actual savings from each measure.
Preliminary Oil and Propane Billing Analysis
Many New Hampshire residents use fuels other than electricity and natural gas for heating, such as oil, propane, kerosene, and wood. Of the 541 participants in the PSNH and Unitil Electric programs in 2009-2010, 79% used at least one of these alternate fuels, with a significant portion using a combination of two alternate fuels. (Alternate fuel use is expected to be much lower for gas customers, but it is not quantified because no alternate fuel savings were reported for Unitil gas projects and National Grid did not provide project-specific energy savings information.) Customers using any of these alternate fuels had to provide 2 years of billing data to the utilities as part of the review process before having an audit. During the initial phone calls to these customers, Cadmus asked them to prepare copies of their bills so the information could be
collected on site visits. PSNH and Cadmus staff then worked together to compile before and after billing data from 15 PSNH program participants (13 oil accounts, 2 propane accounts) for use in a billing analysis of alternate fuel savings.
The model estimation methodology for the billing analysis of other fuels is similar to the gas billing analysis described above. We estimated a Fixed Effects Paired Monthly Billing Analysis, comparing billing data on a monthly basis before and after project implementation, weather normalizing for heating degree day differences between the pre- and post- participation periods.
Meta-Analysis
Cadmus conducted a meta-analysis as part of the impact evaluation in order to gauge how effective the New Hampshire HPwES program is when compared to other home performance programs from across the country. We identified other evaluated HPwES programs with similar measure offerings and examined impact evaluation results. Cadmus focused on the broad program-wide metrics that could easily be compared across evaluated programs, using the following criteria to select appropriate programs:
The evaluations had to be completed in the past 2 years. The PA impact evaluation field has evolved considerably over the past few years – with standardized evaluation
techniques being used across the country more and more consistently. Cadmus wanted to take advantage of the latest evaluations using these standard methods.
The evaluations had to be within a reasonably similar climate. Numerous California evaluations were not examined because the impact would be so different due to the different climate.
Cadmus then compared these program metrics with the results of the New Hampshire HPwES program analysis.
Findings
Observations from the Site Visits
Below are selected observations Cadmus made during the 127 sites visits. In general, Cadmus found that the measures reported in the tracking database were installed. However, Cadmus found instances where the established protocols were not followed:
While 71% of CFLs were installed, Cadmus found 29% of CFLs in storage. According to the NH HPwES contractor guidance document,12 CFLs only should be provided when replacing an incandescent lamp of higher wattage and the fixture is on for 3 hours or more per day, and “every effort to avoid installing lights to locations where lights are not needed for 3 hours per day shall be taken.”
Of the five homes that indicated a hot water temperature setback in the database, one site appears to have been set below the safe level of 125oF. The measurements in the other four homes were 157, 134, 127, and 125 oF. It appears that two of the five participants set their water heaters back to the original temperatures (157oF or 134oF). The water heater turndown procedure is to lower the temperature if hot water is found to be above 130oF, the state maximum. Temperature should not be set lower than 125oF due to concerns about bacterial growth, as stated in the contractor program guidance. Cadmus measured hot water temperature in 124 of the 127 homes visited and found that the average water temperature was 124 oF.
In some cases, vapor barrier (paper facing) was not oriented properly by contractors. Out of the three crawlspace insulation jobs where the determination could be made, one of them had a vapor barrier that was not correctly oriented toward the heated space. Of the 49 ceiling insulation jobs with fiberglass batts we could access and inspect, 47 were installed correctly but two had the vapor barrier incorrectly on the cold side of the insulation.
Of the 127 sites visited, ceiling insulation was accessible in 109. Of the 42 with ceiling insulation at an R-equivalent less than 40, the average insulation was R-24, with all but one site greater than R-11. Among candidate homes, all had some ceiling insulation measures installed and all but one had R-11 or better.
Of sites where air sealing was performed, Cadmus found 86% had weather-stripping on the outside doors and 63% had weather-stripping on their attic hatches.
Cadmus field staff received positive feedback from many program participants and noted the following observations:
o Overall, customers reported high satisfaction with the program, and several were very happy about the services and incentives they received.
12
Program Implementation Manual for Contract Coordinators and Quality Assurance Contractors, March 2011,
o New Hampshire customers displayed a high level of interest in home performance during site visits.
o Many customers reported being more comfortable in their house last winter. o Some oil users reported a noticeable decrease in fuel use since project
implementation.
During the 127 sites visits, thermal cameras were used to examine ceiling insulation at 117 homes and wall insulation at 118 homes. Because the site visits were performed in April, due to the overall schedule of the project, temperature differences between the inside space and
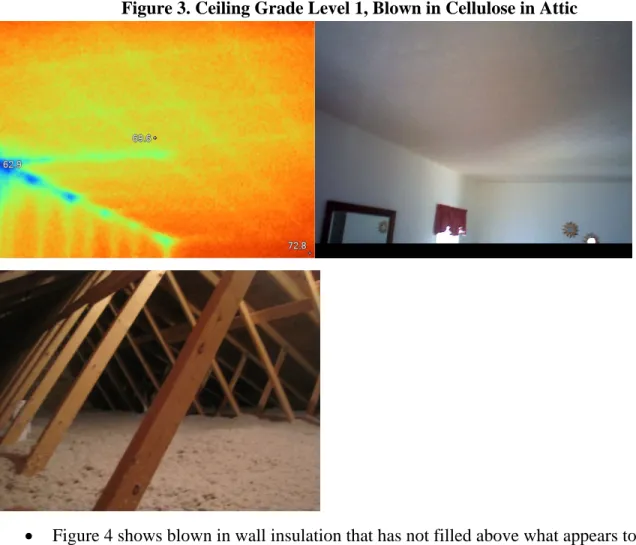
outdoors were low, making thermal imaging challenging. Nevertheless, Cadmus was able to obtain images for the majority of homes. As outlined in the methods section, the purpose of the thermal imaging was to generally assess the quality of insulation, not to fault-diagnose every installed measure. In general the insulation installations were found to be of high quality with few issues detected. Of 39 sites with added wall insulation, 72% had the highest grade allowed by a thermal camera analysis, and the 28% with Grade 3 exhibited only 2% to 5% problem areas, usually toward the low end of that range. Of the 91 sites with added ceiling insulation, 92% had Grade 1 or 2, and even the 8% of Grade 3 locations had less than 5% problem areas. Please see the example figures below.
Figure 2 shows a room corner where insulation has apparently slipped, reducing the overall value of that wall’s insulation value. This home’s wall insulation was recorded as Grade 3.
Figure 2. Grade 3 Wall
Figure 3 shows a well insulated ceiling (Grade 1) with photographs above and below the ceiling, and a thermal image taken from below. The insulation is well installed and level, and the thermal image show no large anomalies.
Figure 3. Ceiling Grade Level 1, Blown in Cellulose in Attic
Figure 4 shows blown in wall insulation that has not filled above what appears to be a blank space above a window header.
Figure 4. Blown in Wall Cellulose into 1780 Post and Beam (Grade 3)
Cadmus also gathered data on size and age of the homes during site visits. Figures 5 and 6 below show the average age and square footage of homes visited in the sample. National Grid Gas sites appeared to have the newest homes and Until Gas the smallest.
Figure 5. Age of Homes in Years, by PA
Unit Savings for Engineering Analysis
Shell Measure Unit Savings
Table 6 shows unit savings values for a few common measures in a gas furnace heated home. These are compared to unit savings values used by PSNH in calculating savings. National Grid did not use unit savings because their savings estimates, based upon a billing analysis, are a single estimate for each site that integrates all installed measures. Unitil did not use unit savings but rather modeled each home using TREAT. In general the PSNH and RemRate unit savings agree well, with the exception of wall and basement ceiling insulation.
Table 6. REM/Rate-Based Unit Savings Estimates
Measure Units RemRate Value Values PSNH REM Rate/ PSNH
Air Sealing MMBTU per CFM reduction 0.012 0.0143 80%
Ceiling Insulation (R-11 to R49) MMBTU per square foot 0.011 0.0092 115%
Wall Insulation (R0 to R-11) MMBTU per square foot 0.020 0.0464 42%
Basement Ceiling Insulation (R-0 to R-30) MMBTU per square foot 0.004 0.0137 28%
Rim & Band Joist (R-0 to R-11) MMBTU per linear foot 0.042 0.0382 109%
Thermostat MMBTU per job 2.799 2.2686 123%
Duct Sealing MMBTU per job 6.072 NA
Duct Insulation (R-0 to R-8) MMBTU per job 7.277 NA
Figure 7 shows energy savings from ceiling insulation as the base R-value changes. The figure illustrates that underestimating low baseline R-values can exaggerate savings substantially. It shows that attic insulation savings steeply increase as the baseline R-value approaches zero (meaning there was no insulation at all in the ceiling). Based on examination of building codes, known construction practices, and findings of the 127 site visits, Cadmus set a minimum baseline R-value for ceilings at R-11 to avoid over estimating savings.
The importance of correctly recording the base R value as illustrated in Figure 7 came to light during conversations regarding ceiling insulation with PSNH’s program administrator. We discussed those cases where the contractor entered the measure “Attic Insulation – Add R49” into the PSNH database. With this measure entry, PSNH calculated the savings for going from a baseline of no insulation (R0) to R49 insulation. However, New Hampshire homes generally have some pre-existing attic insulation. In these cases, the contractor most likely removed old insulation from the attic during the air sealing process before blowing in the R49 insulation. From the contractor’s perspective, R49 of insulation had been added. However, the savings attributed to that measure should not be based upon increasing insulation from R0 to R49 but rather increasing insulation from R11 to R49. In these cases, the measure entered should be “Attic Insulation – Add R38”. As shown in Figure 7, the savings for going from R0 to R49 (0.04 MMBtu/sq. ft – red dashed arrow) are almost four times higher than going from R11 to R-49 (0.105 MMBtu per sq. ft. – green solid arrow).
Figure 7. Ceiling Insulation Measure Savings per R-value
In addition to ceiling insulation, Cadmus examined the PSNH wall insulation estimate of 0.0464 MMBtu/square foot that was based upon the 2008 United Illuminating and Connecticut Light & Power Program Saving Document. PSNH unit savings for wall insulation appeared to use a baseline R-value that was low and an installed R-value that appeared higher than our assumptions. A possible cause of this higher value was not accounting for the portions of the wall without insulation (i.e., wall framing studs).
In addition, Cadmus examined 5 TREAT files from Unitil Gas. In some cases the initial R value of an un-insulated wall was under-predicted with a value of less than two including air films. In other cases basement insulation savings calculations appeared to be based on high temperature differentials and savings appear to be estimated on the high side.
CFL Unit Savings
The tracking data provided by the PAs did not include the wattage of bulbs installed and replaced. Cadmus used the NH HPwES contractor guidance document13 to estimate the change in wattage and used a study completed for an evaluation of the Ameren Illinois HEP program to determine the portions of various bulbs installed. The Ameren study included over 20,000
13
Program Implementation Manual for Contract Coordinators and Quality Assurance Contractors, March 2011, p. 27.
incandescent bulb replacements. In that study, the average weighted wattage reduction was approximately 50 watts (see Table 7).
This evaluation did not include light logging to determine operating hours. Cadmus used a 2009 study14 that found that in high-use areas (living rooms, dining rooms, kitchens, family rooms, and offices) lights are on an average of 2.97 hours per day and 2.05 hours per day in other areas. During the 127 site visits in this evaluation, Cadmus found that 50% of CFLs are installed in high-use areas, 21% in other areas, and 29% are in storage. As shown in Table 8, of the installed CFLs (excluding those in storage), 71% are placed in high-use areas and 29% in other areas, for an average use of 2.70 hours per day – leading to 48.65 kWh savings annually per installed CFL. However, taking into account the amount of CFLs in storage (29%) reduces this unit savings to 34.50 kWh (0.1177 MMBtu) savings – 66% and 68% of the PSNH and Unitil Electric reported CFL unit savings, respectively.
Table 7. Determination of Wattage Reduction for CFLs
Average CFL Wattage Wattage of Replaced Incandescent Change in Watts % Used in Ameren Illinois HEP Program 16.5 60 43.5 68% 22 75 53 18% 27.5 100 72.5 14%
Average Weighted Wattage Reduction 49.36
Table 8. Determination of Operating Hours and Unit Savings for CFLs
Type of Replacement Area Hours of Use Per Day % Installed Found On Audit
High-Use Areas 2.97 71%
Other 2.05 29%
Average Hours of Use 2.70
Reported Unit Savings Per CFL Installed (kWh) 48.65 Realized Unit Savings Per CFL Installed (kWh)
Accounting for Placement in Storage 34.50 Realized Unit Savings Per CFL Installed (MMBtu)
Accounting for Placement in Storage 0.1177 PSNH Reported Unit Savings Per CFL Installed
(MMBtu) 0.1794 Unitil Electric Reported Unit Savings Per CFL
Installed (MMBtu)
0.1743 Realized/PSNH Electric Reported 66% Realized/Unitil Electric Reported 68%
14
RESIDENTIAL LIGHTING MARKDOWN IMPACT EVALUATION FINAL, January 20, 2009. Submitted to: Markdown and Buydown Program Sponsors in Connecticut, Massachusetts, Rhode Island, and Vermont.
These lighting unit savings were later compared to those developed through an electric billing analysis (see page 27).
Hot Water Measure Unit Savings
Cadmus used engineering analysis, field measurement, and secondary research to establish hot water measure savings for pipe insulation, low-flow showerheads, and bathroom and kitchen aerators. We researched appropriate defaults for a number of factors (e.g., water temperature of showers, frequency and duration of showers, throttled flow rates, etc.) and used energy
engineering calculations to estimate savings from these measures.15 Hot water setback was based on unit savings data in the 2010 UI/CLP Program Savings Documentation, which considered that setback leads to increased hot water use (for users to maintain the same shower temperature) and increased use of dishwasher heating elements. Results are shown in Table 9. With the
exception of the showerhead measure, the realized savings are substantially lower than the PSNH values.
Table 9. Hot Water Measure Unit Savings
Measure Realized Electric Water Heater Unit Savings (kWh) Realized Gas Water Heater Unit Savings (MMBtu) PSNH Reported Gas Water Heater Unit Savings (MMBtu)* Realized/ PSNH Reported
Annual savings per pipe insulation job 51 0.23 0.0187/foot NA
Annual savings per showerhead 234 1.03 0.606 170%
Annual savings per kitchen aerators 29 0.13 0.566 24%
Annual savings per bathroom aerators 19 0.07 0.566 13%
Hot water heater setback 86 0.065 0.364 18%
*.0187pipe insulation savings are per foot for PSNH
These hot water unit savings were later compared to those developed through an electric billing analysis (see page 27).
Refrigerator Unit Savings
PSNH developed savings estimates using on-site metering and a default value for the energy used by ENERGY STAR qualified refrigerators. Auditors meter energy used by existing refrigerators to determine eligibility for replacement and provide the appropriate rebate level. Cadmus updated these estimates with current ENERGY STAR qualified refrigerator energy data. As shown in Table 10, the savings are slightly larger than the values used by PSNH.
15
Table 10. Refrigerator Unit Savings
Rebate Realized Per Unit Savings (kWh) Realized Per Unit Savings (MMBtu) PSNH Reported Per Unit Savings (MMBtu) Realized/ PSNH Reported $ 100 475 1.619 1.5470 105% $ 150 646 2.205 2.1330 103% $ 200 818 2.791 2.7190 103% $ 250 990 3.377 3.3050 102% $ 300 1162 3.963 3.8910 102% $ 350 1333 4.549 4.4770 102% $ 400 1505 5.135 5.0630 101% $ 450 1677 5.721 5.6490 101%
These appliance unit savings were later compared to those developed through an electric billing analysis (see page 27).
Based on the 127 site visits, refrigerator ages were determined and logged in Table 11. Older refrigerators with high potential savings were present in the population. Approximately 27% were made from 1990 to 1999 (units that use roughly twice as much energy as a new ENERGY STAR qualified refrigerator) and 3% were 20 years or older (units that use 3 times as much energy as a new ENERGY STAR qualified refrigerator).
Table 11. Age of Refrigerators
Age of Refrigerator Percentage
New 11%
Installed 2000 - 2009 59%
Installed 1990 - 1999 27%
Installed 1980 - 1989 3%
Breakdown of Realized Utility Savings
Presented below in Figures 8 through 11 are a series of pie charts that show a breakdown of PA savings by the following categories:
Air sealing
Attic Insulation
Wall Insulation
Basement Insulation
In examining the graphs, Cadmus found the following:
The gas PAs generally installed only shell measures. In contrast, the electric PAs
installed a wide range of measures beyond shell measures – including lighting, domestic hot water measures, and thermostats.
Air sealing, ceiling insulation, and wall insulation contribute the bulk of savings for all four of the utilities, with basement insulation and other measures combined contributing less than 30%.
Billing Analysis
Gas
Table 12 summarizes the results of a gas billing analysis completed for 819 program participants. Although the per heating degree savings model estimates are higher for Unitil, the estimated gas savings for National Grid Gas and Unitil Gas from the program are 11.4 MMBtu per participant. The 90% confidence intervals indicate precise estimates for National Grid Gas, and a wider interval for Unitil due to a smaller sample size.16
Table 12. Gas Savings Summary
PA Model n Model Savings Per HDD Normal Heating Degree Days Realized Savings Per Participant (MMBtu/Part.) Relative Precision 90% Confidence Interval Lower 90% Confidence Interval Upper 90%
National Grid Gas 773 0.0160 7,137 11.4 5% 109 120
Unitil 46 0.0172 6,607 11.4 26% 84 143
Total 819 0.0162 7,027 11.4 7% 106 122
16
A pooled model was also estimated, however that model yields lower savings for Unitil and more to National Grid.
Electric
Table 13 summarizes the measure level electric billing analysis results for PSNH and Unitil Electric. The estimated electric savings are 361 kWh for lighting measures, 432 kWh for hot-water measure measures, and 590 kWh for appliances. The 90% confidence intervals indicate precise estimates for lighting with a relative precision of 17%. However, the realized savings estimates for hot water and appliances are not as precise with relative precision at 90%
confidence at 32% and 43%, respectively. Cadmus compared the electric billing analysis savings to the unit savings for lighting, hot water, and appliances developed for the engineering analysis (see Tables 7 through 10) and concluded the following:
The electric billing analysis-based savings of 361 kWh per lighting installation were used in our analysis as the unit savings for lighting (for PSNH and Unitil Electric) instead of the value of 34.50 kWh per CFL installed (see Table 7). Based upon 310 electric bills, the 361 kWh estimate was a better estimate of savings than the 34.50 per CFL estimate – which was developed based on estimated hours of use and CFL wattage from secondary research.
The electric billing analysis-based savings for hot water measures (432 kWh) and appliances (590 kWh) were not used. The relative precision of hot water and appliance estimates – 32% and 43%, respectively – reflected a less precise estimate of savings than the lighting measure. Instead, Cadmus preferred the engineering analysis-based estimates of hot water savings and refrigerator savings found in Tables 9 through 11. The method for estimating refrigeration savings – where the technician meters the old refrigerator to establish energy use and subtracts a default savings number for a typical ENERGY STAR refrigerator – was sound. The unit savings method for estimating hot water measures – based on secondary research and field data on showerhead and aerator flow rates – allowed for savings based on the particular hot water measures installed at a home. The billing analysis-based savings estimates relied upon a single flat rate of 432 kWh for all homes with hot water measures – regardless of which hot water measures (showerheads, aerators, pipe wrap, or setback) were installed.
Table 13. Electric Savings Summary
Measure Model n %Install-ing Reported Savings Per Participant (kWh/Part.) Realized Savings Per Participant (kWh) Relative Precision 90% Confidence Interval Lower 90% Confidence Interval Upper 90% Gross Realization Rate Lighting 310 93% 336 361 17% 300 421 107% Hot Water 58 17% 449 432 32% 293 572 96% Appliances 21 6% 879 590 43% 335 846 67%
Oil and Propane
Table 14 summarizes the results of the oil and propane billing analysis conducted for 15 sites. Cadmus calculated average realization rates to be 48% for oil savings and 30% for propane savings. While the precision on these results is low due to a limited number of projects included in the analysis, these realization rates indicate that the alternate fuel savings is lower than expected.
Table 14. Results of Alternate Fuel Billing Analysis, Weather Normalized
Fuel Projects in Number of Analysis Annual Fuel Consumption Before (MMBtu) Reported Fuel Savings (MMBtu) Annual Fuel Savings - Billing Analysis (MMBtu) Fuel Savings Percentage - Billing Analysis Realization Rate Precision at 90% Confidence Oil 13 131 68 33 25% 48% +/-34% Propane 2 122 67 20 23% 30% +/-84%
Table 15 shows that the results of billing analysis and engineering analysis are similar for the same 15 participants.
Table 15. Comparison of Alternate Fuel Billing Analysis & Engineering Analysis
Annual Fuel Savings (MMBtu) Number of
Projects in
Analysis Weather Normalized Billing Analysis, Engineering Analysis
Oil 13 33 34
Propane 2 20 26
In addition to the small sample size, the accuracy of the oil and propane billing analysis is limited by the fact that these are delivered fuels, which are purchased in bulk periodically rather than purchased as used and billed monthly. We obtained detailed data on fuel deliveries but do not have information on how much fuel remained in the tank at the end of the analysis period. Furthermore, Cadmus and PSNH agreed to focus this analysis on oil and propane, the fuels for which we had the best data, but some of these customers use more than one other fuel. A more complete analysis would include a larger sample size and all fuels used by each customer.
Meta-Analysis
Table 16 below shows the annual participation, reported savings, and realized savings for several different home energy performance evaluations. A number of issues are worth noting:
The reported and realized gross savings per participant values in Table 16 include participants that only had the initial audit (receiving instant savings measures such as CFLs or aerators), but decided not to have further work done. For example, in the Rhode Island programs, only 30% of participants installed insulation. In the Ameren Illinois program only 68 homes out of almost 3,000 participants installed insulation. As shown in Figure 12, the NH HPwES program saves more than most other
programs on a per participant basis because of the high closure rates – 80% to 95% for PSNH and Unitil – which are related to a sound screening process and audit fee. The National Grid Gas closure rate was 40% without a screening process or audit fee.
The column labeled “Annual Fuel Savings Per Treated Home for Shell Measures” in Table 16 provides a realized savings per home for those that had shell measures installed. For three other PAs, this value ranges from 13.1 to 31.3 MMBtu per home. As shown in Figure 13, this range is in line with estimated fuel savings from shell measures for PSNH, Unitil Electric, National Grid Gas, and Unitil Gas.
Realization rates ranged from 88% at Ameren Illinois to a low of 58% at the Energy Wise RI Electric. There seems to be a consistent trend of overestimation of savings across different PAs. Engineering analysis generally revealed inaccurate savings assumptions used in the reported savings estimates. For example, in Wisconsin an evaluation of savings led to unit savings reduction for wall insulation from 411 therms per home to 225 therms per home. For the Rhode Island billing analysis, analysts postulated that the difference between estimated and expected electricity savings for single-family homes may be due to a different mix of measures installed in 2008 than was predicted or historically installed. In addition, CFLs and refrigerator savings estimates were higher than expected.
Reported gross savings in these other evaluated programs are generally lower than those estimated by Unitil Gas and Unitil Electric (54.4 and 59.3 MMBtu/participant, respectively). However, reported savings for PSNH (38.6 MMBtu/participant) and National Grid Gas (14.1 MMBtu/participant) fall within the range of other programs.
Table 16. Overall Meta-Analysis PA and Year of Evaluation Report Annual Part. Type of Real. Rate Study Annual Ex-Ante Savings (MMBtu) Real. Rate Realized Gross Savings (MMBtu) Ex-Ante Savings per Part. (MMBtu/ Part.) Realized Gross Savings per Part. (MMBtu/ Part.) Annual Fuel Savings Per Treated Home for Shell Measures (MMBtu/ Home) NYSERDA, 2010 8,475 Engineering Analysis 174,525 87% 152,044 21 17.9 Energy Wise RI
Electric, 2010 67 Analysis 304 Billing 58% 177 5 2.6
Energy Wise RI
Gas, 2010 512 Analysis 4,427 Billing 67% 2,949 9 5.8 13.3
Energy Trust of
Oregon, 2009 13,955 Analysis Billing 136,561 117% 160,378 8 11.5 13.1
WI Focus on
Energy, 2010 1,843 Engineering Analysis - 70% - 48 33.4 31.3 Ameren Illinois, 2010 2,987 Deemed Savings Review 11,757 88% 10,343 3.9 3.5 PSNH 430 Engineering Analysis 16,591 58% 9,593 38.6 22.3 20.3 Unitil Electric 102 Engineering and Billing Analysis 6,046 42% 2,534 59.3 24.8 23.0
National Grid 1,068 Engineering Analysis 15,059 98% 14,758 14.1 13.8 13.8
Unitil Gas 28
Engineering and Billing
Figure 12. Realized Gross Savings Per Participant
Program Level Results
Using site visits, billing analysis, and engineering analysis, Cadmus estimated gross realization rates and confidence and precision levels for combined gas and combined electric PAs. The site visit and file review sample was drawn proportionally from the PAs. The small sample size of the Until sites and limitations of their data files mean that the Unitil values have low precision, but based on PA requests Cadmus also presents values for each PA individually.
Engineering Analysis
Table 17 shows savings per participant for the electric PAs (PSNH and Unitil Electric combined) and gas PAs (National Grid Gas and Unitil Gas combined) based on a sample of 126 sites.17 The electric and gas PAs had realized savings of 24.4 MMBtu/participant and 16.9
MMBtu/participant, respectively. The electric PA value has a relative precision at 90%
confidence of ±18% and the gas PA value is ±20%. Calculated gross realization rates were 54% and 103%, respectively. Cadmus did not reach the 90/10 goals for the gas and electric PAs, because of higher than anticipated variability among sites.
Table 17. Electric and Gas Summary of Results for Sample
PA Fuel Type Number of Site Visits Realized Savings Per Participant (MMBtu/ Part.) Precision at 90% Confidence Reported Savings Per Participant (MMBtu/ Part.) Gross Realization Rate Electric 60 24.4 17.5% 45.5 53.6% Gas 66 16.9 20.1% 16.5 102.7% Total 126 20.5 14.4% 30.3 67.6%
Table 18 provides similar values by PA. Realized savings ranged from 16 to 26
MMBtu/participant. Gross realization rates ranged from 42% to 115%. Precision at 90% confidence ranges from ±14% to ±68%, with the PAs with smaller number of site visits having less precise (higher relative precision) estimates. The Unitil unit savings values are approximate, as indicated by their high relative precision. In addition to having been subjected to limited site visits, the Unitil data extracts did not precisely describe measures (e.g., extracts indicate only “insulation” rather than “wall insulation, R-11”) – further increasing variability in our realized savings estimates.
17
One site was poorly described in its file and had to be dropped from further analysis, leaving 126 of the 127 sites visited.
Table 18. PA Summary of Results for Sample PA Number of Site Visits Realized Savings Per Participant (MMBtu/Part.) Relative Precision at 90% Confidence Reported Savings Per Participant (MMBtu/Part.) Gross Realization Rate PSNH 43 23.9 14.4% 41.3 57.8% Unitil Electric 17 26.4 68.3% 63.0 41.9%
National Grid Gas 61 16.2 16.4% 14.1 115.1%
Unitil Gas 5 25.5 56.1% 45.7 55.8%
Combining Engineering and Fuel Billing Analysis
As summarized in Table 19, engineering-analysis estimates for National Grid Gas and Unitil Gas are higher than those derived through the billing analysis. However, Cadmus recognized that gas billing analysis in New Hampshire will trend toward estimating lower savings due to:
Supplemental Heating. Analysis of gas bills cannot account for participants that use secondary sources of heat during the winter in New Hampshire. Supplemental sources include wood burning stoves, wood pellet stove, fireplaces, and kerosene heaters.
Take Back. Customers may “take back” some of the energy savings in the form of greater comfort (e.g., changing the thermostat setting.)
Cadmus also recognized that the energy simulation models such as REM/Rate used as the basis of the engineering-analysis estimate can overestimate savings. In some cases contractors install supplemental insulation over residual existing insulation that was not accounted for in tracking sheets. Small changes in the baseline R-value cause big changes in actual savings.
To provide the best estimate of gross realization rate for National Grid Gas and Unitil Gas, Cadmus took the average of the engineering analysis and billing analysis. The resulting average of the gross realization rates is shown in Table 20.
Table 19. Gas PA Realized Savings Per Participant by Analyses Method
PA Billing Analysis Based Realized Savings Per Participant (MMBtu/Part .)
Engineering Analysis Based Realized Savings Per Participant
(MMBtu/Part .)
National Grid Gas 11.4 16.2
Unitil Gas 11.4 25.5
Table 20. Average Realization Rate Used for National Grid Gas and Unitil Gas
Analysis Type National Grid Gas Unitil Gas
Billing Analysis Gross Realization Rate 80.9% 16.5%
Engineering Analysis Gross Realization Rate 115.1% 55.8%
As shown in Table 21, Cadmus also conducted a limited fuel use billing analysis for PSNH. As described in the billing analysis section the analysis was limited, based on 13 sites, and relatively imprecise (±34%). For this reason, analyses for PSNH are based on the engineering analysis and not this fuel analysis. Should more bills become available, the precision of the fuel analysis could be improved.
Table 21. PSNH Oil and Propane Analysis
Annual Fuel Savings (MMBtu) Fuel Type Number of Projects in Analysis Billing Analysis, Weather Normalized Engineering
Analysis 90% Confidence Precision at
Oil 13 33 34 +/-34%
Propane 2 20 26 +/-84%
Table 22 shows the final gross realization rates and realized savings for the four PAs. Across all the PAs, Cadmus estimated the gross realization rate to be 70%. The electric PAs (PSNH and Unitil Electric) and gas PAs (National Grid Gas and Unitil Gas) were estimated to have gross realization rates of 54% and 92%, respectively.
Table 22. Gross Reported and Realized Savings by PA
PA Participants Number of Total Reported Savings (MMBtu) Gross Realization Rate Total Realized Savings (MMBtu) Reported Savings Per Site (MMBtu/ Site) Realized Savings Per Site (MMBtu/ Site) PSNH 430 16,591 57.8% 9,593 38.6 22.3 Unitil Electric 102 6,046 41.9% 2,534 59.3 24.8 Electric Subtotal 532 22,637 53.6% 12,127 42.6 22.8 National Grid 1,068 15,059 98.0% 14,758 14.1 13.8 Unitil Gas 28 1,524 36.1% 550 54.4 19.7 Gas Subtotal 1,096 16,583 92.3% 15,308 15.1 14.0 Total 1,628 39,220 70.0% 27,435 24.1 16.9
Conclusions and Recommendations
This report presented the evaluation of the 2009-2010 New Hampshire Home Performance with ENERGY STAR (HPwES) program. Cadmus visited 127 participant homes and conducted engineering analysis and billing analysis to develop savings estimates. Savings estimates were used to calculate gross realization rates for the PAs by fuel type and by individual PA. Following are the main findings:
The HPwES program was successful, with high participation rates and high savings per participant compared to other home energy performance programs. In part because of pre-qualification procedures, the New Hampshire HPwES program has a high closure rate. Savings on a per participant level are higher than other programs around the country.
Cadmus field staff received positive feedback from many program participants. In addition to being very satisfied with the services and incentives received, many
participants reported increased comfort and noticeable drops in fuel use.
Cadmus combined engineering and billing analyses to estimate utility savings. Cadmus engineering analysis showed savings values higher than gas billing analysis for National Grid Gas and Unitil Gas. In our opinion, two factors drove this difference: (1) A portion of homes use supplemental heating not captured in the billing analysis causing it to estimate low; and (2) In some cases contractors install insulation on top of residual existing insulation that was not accounted for, which could lead to higher engineering analysis estimates. For these reasons, Cadmus averagedthe results of the engineering analysis and billing analysis to calculate gross realized savings for National Grid Gas and Unitil Gas. For PSNH and Unitil Electric, electric billing analysis was used to establish lighting measure unit savings estimates which were then used as a part of the engineering analysis. Table 23 shows the results of these analyses. The realization rate was 92% for the gas utilities and 54% for the electric utilities.
Realization rates varied widely among the PAs – from 36% to 98% (see Table 23).
Realization rates varied primarily because reported savings estimates varied widely, by about a factor of four – from 14.1 MMBtu/site for National Grid Gas to 59.3 MMBtu/site for Unitil Electric. PSNH, Unitil Electric, and Unitil Gas savings estimates appear high in relation to Cadmus’ findings and to National Grid Gas savings estimates. This variation results in realization rates for the three PAs ranging from 36% to 58%. Low realization rates were most likely due to high unit saving estimates for insulation driven by