The FAO High-Level Policy Learning Programme (HLPLP) is an event aimed at strengthening the capacities of influential stakeholders in policy processes to identify emerging development issues and translating innovative ideas into evidence based policy options. See: HLPLP material is hosted on the EASYPol website EASYPol is a multilingual repository of freely downloadable resources for policy making in agriculture, rural development and food security. The resources are the results of research and field work by policy experts at FAO.
The site is maintained by FAO’s
Value Chain Analysis
FAO VCA Software Tool 3.1
FOOD AND AGRICULTURE ORGANIZATION OF THE UNITED NATIONS
By
Lorenzo Giovanni Bellù, Policy Officer and
Piera Tortora, Consultant
Policy Assistance Support Service, Policy and Programme Development Support Division
FAO High-Level
Policy Learning Programme for decision makers and policy analysts
2 of 20
What is the FAO VCA-tool?
• The FAO VCA tool is a software for
carrying out value-chain analyses for
agricultural and rural development
policies.
• By storing relevant data it calculates
flows of physical outputs and inputs,
flows of aggregated costs,
value-added and net benefits.
• It also allows users to directly
compare different hypothetical
scenarios.
Why use a dedicated software?
What does the FAO VCA-tool software
allow you to do?
How do you structure data in the
software?
4 of 20
Why use a dedicated software? 1/2
1. Provides support to
value chain analysis in
concrete situations
2. Suitable for training
and learning events
Why use a dedicated software? 2/2
It allows you
to store a
large amount
of data from
different
sources
It allows you
to check/
enhance data
consistency
It carries out
calculations
and saves
your time
SPECIFIC FUNCTIONS OF VCA6 of 20
Structure the accounting framework of a value chain
Organize data for different agents
Compute the inflows and outflows for each agent
Compute indicators regarding the contribution of each agent
Harmonize the flows of the different segments of the chain
Compute shadow prices
Compute competitiveness indicators and protection indicators
What does FAO VCA software tool allow you to do?
Software manual and methodological guidelines
The FAO VCA software tool comes together with:
The conceptual and methodological framework for value chain analysis [EASYPol module 129]
Detailed instructions on how to install the software, insert and manage data and
carry out calculations of indicators for the different components and levels of a value
chain analysis [EASYPol module 074]
8 of 20
Good= Inputs and Outputs
Activity = a phase in the
production/ processing process
Plan = Aggregate of activities and/or goods and/or other plans (e.g. an agent or a group of agents)
How do you structure data in VCA?
Good A Good B Good C Good D
Activity 1 Activity 2 Activity 3
Plan Beta Plan Alpha Plan Delta (Plan of Plans) Plan Gamma (Plan of plans)
Left hand window:
Main menu (File, Tools, Options,
Help)
Project name and related
information
Access to value chain elements
(inputs/outputs, activities, etc)
Modify name and delete item
facilities
List of items from the chosen
element
10 of 20
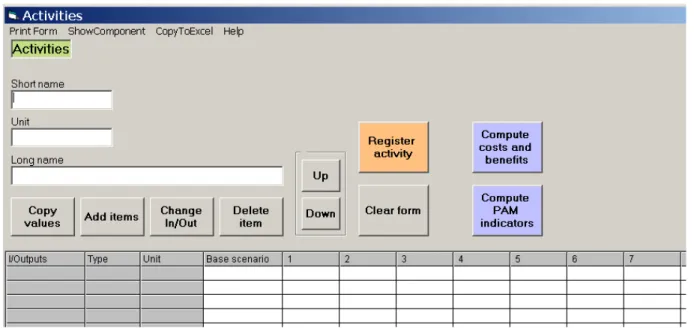
Right hand window (i.e. clicking on Activities)
Chosen element
Table to insert data
Scenarios
Access to computational facilities
Why carry out an economic analysis of value chain at market prices?
1. Are agents earning profits?
2. Is the profit enough to ensure sustainability of the agents’ activities (e.g. maintenance and replacement of equipment, ability to cover financial charges)?
3. Is the profit a sufficient and acceptable return on investment?
4. How much value are they creating? 5. Is the whole chain profitable?
Economic analysis at market prices* allows you to assess the profitability, and
contribution in terms of value added creation, of each activity and of the chain
as a whole, in a given period.
12 of 20
More specifically, the economic analysis builds on:
the functional analysis with the identification and quantification of key elements of the chain, such as the economic agents playing a role in the chain and their activities
the production account (sales, intermediate inputs and value
added) and the income account allocation of value added among production factors of each activity, as defined by the System of National Accounts*.
* See : the United Nations System of National Accounts, 2008
Computing Production and Income accounts
1 Select the plan for which you want to compute the two accounts from the main menu on the left
2 Press the “Compute Costs and Benefits” button on the right hand side menu
14 of 20
Computing Production and Income accounts
3 The software will display the quantities involved in the accounts
4 By pressing on the “show values” button on the top right, the computed
accounts will be displayed
The accounts values window:
• shows the accounts in a detailed or compact fashion (=only the balances)
• shows aggregates
Value chain analysis and reference prices
Another important function of the FAO VCA-Tool is the calculation of
the reference prices
In value chain analysis you may want to formulate (and explore the socio-economic impacts of) policy options that are based on the opportunity costs to the whole society (= reference prices).
Prices observed on markets often differ from social prices (because of policy and market failures).
The gap between market prices and (estimated) reference prices is a measure of the extent of policy and market failures distortions (PAM indicators).
16 of 20
Calculating reference prices:
categories of goods
You can also calculate the reference prices for the different kinds of
goods present in the chain:
Land Labour
OUTPUTS
NOT TRADED EXPORTABLE IMPORT SUBSTITUTE INPUTS AND PROD FACTORS NOT TRADED EXPORTABLE IMPORTED NON-TRADABLECalculation of a reference prices
1. Select the good which is needed for the reference price calculation
2. Select the method (idepending on the type of goods
3. Upload the data needed for the
18 of 20
Policy analysis matrix and competitiveness indicators
The FAO VCA-Tool allows you to build the Policy Analysis Matrix for an activity, for a plan or for a plan of plan(s).
What is a Policy Analysis Matrix (PAM)?
A PAM allows you to assess the competitiveness of a good of the chain through the relative indicators (e.g. the Domestic Cost Resources, the Nominal Protection
Coefficient, Nominal protection coefficient on inputs, Effective Protection Coefficient).
Structure of a PAM
Sales Revenues, Costs of Production and Profits in the PAM are valued both at market prices
(First Row) and at reference prices (Second Row)
By comparing the elements of a PAM and their values at market and social prices, you obtain a number of indicators that shed light on the efficiency and policy/market distortions in a given economic system.
Policy analysis matrix and competitiveness indicators
1.Select the activity or the plan for which the computation of the PAM is needed
2.Select the scenario
3.After the computation indicators and the price analysis will appear
20 of 20
Links to related FAO VCA software tool resources
EASYPol module 073
EASYPol Module 129
EASYPol Module 074
To find all FAO VCA resources, see EASYPol resource package