Failure-aware Resource Provisioning For Hybrid Cloud
Infrastructure
Bahman Javadia,∗, Jemal Abawajyb, Rajkumar Buyyac aSchool of Computing, Engineering and Mathematics,
University of Western Sydney, Australia
bSchool of Information Technology,
Deakin University, Geelong, Australia
cCloud Computing and Distributed Systems (CLOUDS) Laboratory,
Department of Computing and Information Systems, University of Melbourne, Australia
Abstract
Hybrid Cloud computing is receiving increasing attention in recent days. In order to realize the full potential of the hybrid Cloud platform, an ar-chitectural framework for efficiently coupling public and private Clouds is necessary. As resource failures due to the increasing functionality and com-plexity of hybrid Cloud computing are inevitable, a failure-aware resource provisioning algorithm that is capable of attending to the end-users quality of service (QoS) requirements is paramount. In this paper, we propose a scal-able hybrid Cloud infrastructure as well as resource provisioning policies to assure QoS targets of the users. The proposed policies take into account the workload model and the failure correlations to redirect users’ requests to the appropriate Cloud providers. Using real failure traces and workload model, we evaluate the proposed resource provisioning policies to demonstrate their performance, cost as well as performance-cost efficiency. Simulation results reveal that in a realistic working condition while adopting user estimates for the requests in the provisioning policies, we are able to improve the users’ QoS about 32% in terms of deadline violation rate and 57% in terms of slowdown with a limited cost on a public Cloud.
Keywords: Hybrid Cloud Computing; Quality of Service; Deadline;
∗Corresponding author. Telephone: +61-2-9685 9181; Fax: +61-2-9685 9245
Workload Model; Resource Provisioning; Resource Failures
1. Introduction
Cloud computing is a new computing paradigm that delivers IT resources (computational power, storage, hardware platforms, and applications) to businesses and users as subscription-based virtual and dynamically scalable services in a pay-as-you-go model. Utilization of Cloud platforms and ser-vices by the scientific and business communities is increasing rapidly and existing evidences demonstrate performance and monetary cost-benefits for both scientific and business communities [1, 2, 3, 4]. In addition to provid-ing massive scalability, another advantage of Cloud computprovid-ing is that the complexity of managing an IT infrastructure is completely hidden from its users.
Generally, Cloud computing is classified intoprivateClouds,public Clouds, andhybrid Clouds. Public Clouds provide shared services through large-scale data centers that host very large number of servers and storage systems. The purpose of public Cloud is to sell IT capacity based on open market offerings. Any one can deploy applications from anywhere on the public Cloud and pay only for the services used. Amazon’s EC2 [5] and GoGrid [6] are examples of public Clouds. In contrast, the purpose of private Clouds is to provide local users with a flexible and agile private infrastructure to run workloads within their own administrative domain. In other words, private Clouds are small-scale systems compared to public Clouds and usually managed by a single organization. Examples of private Clouds include NASA’s Nebula [7] and GoFront’s Cloud [8].
A hybrid Cloud [9] is the integration and utilization of services from both public and private Clouds. The hybrid Cloud platform will help scientists and businesses to leverage the scalability and cost effectiveness of the pub-lic Cloud by paying only for IT resources consumed (server, connectivity, storage) while delivering the levels of performance and control available in private Cloud environments without changing their underlying IT setup. As a result, hybrid Cloud computing is receiving increasing attentions recently. However, a mechanism for integrating private and public Clouds is one of the major issues that need to be addressed for realizing hybrid Cloud computing infrastructure. Also, due to the increased functionality and complexity of the hybrid Cloud systems, resource failures are inevitable. Such failures can
result in frequent performance degradation, premature termination of execu-tion, data corruption and loss, violation of Service Level Agreements (SLAs), and cause a devastating loss of customers and revenue [10, 11]. Therefore, a failure-aware resource provisioning approaches is necessary for uptake of hybrid Cloud computing. Although security and privacy are also major con-cerns in hybrid Clouds systems, we will not address them in this paper and interested reader can refer to [12, 13] for more information.
In this paper, we propose a flexible and scalable hybrid Cloud archi-tecture along with failure-aware resource provisioning policies. Although there are approaches that address how an organization using a private Cloud utilize public Cloud resources to improve the performance of its users’ re-quests [4, 14], existing approaches do not take into account the workload type and the resource failures to make decision about redirection of requests. In contrast, our proposed policies take into account the workload model and the failure correlations to redirect resource requests to the appropriate Cloud providers. The proposed policies also take advantage of knowledge-free ap-proach, so they do not need any statistical information about the failure model (e.g., failure distribution). This approach is in contrast to knowledge-based techniques where we need specific characteristics of the failure events in the form of statistical models. For instance, authors in [15] discovered the statistical model of failures in a large-scale volunteer computing systems and adopted these models for stochastic scheduling of Bag-of-Task jobs. Al-though knowledge-based techniques could be more efficient, they are quite complex and hard to implement.
In summary, our main contributions in this paper are threefold:
• We provide a flexible and scalable hybrid Cloud architecture to solve the problem of resource provisioning for users’ requests;
• In the hybrid Cloud architecture, we propose various provisioning poli-cies based on the workload model and failure correlations to fulfill a common QoS requirement of users, request deadline;
• We evaluate the proposed policies under realistic workload and fail-ure traces and consider different performance metrics such as deadline violation rate, job slowdown, and performance-cost efficiency.
The rest of the paper is organized as follows. In Section 2, the background and problem statement are presented. We describe related work in Section 3.
In Section 4, we present the system architecture and its implementation. We then present the proposed resource provisioning policies in Section 5. We discuss the performance evaluation of the proposed policies in Section 6. Finally, we summarize our findings and present future directions in Section 7.
2. Background
In this section, we will present the problem statement, the workload and failures models considered in this paper1.
2.1. System Model
In this paper, we focus on Infrastructure-as-a-Service (IaaS) Clouds, which provide raw computing and storage in the form of Virtual Machines (VMs) and can be customized and configured based on application demands.
LetNpub and Nprv denote the number of resources in public Cloud (Cpub) and private Cloud (Cprv), respectively. The hybrid Cloud (H) of interest can be expressed as follows:
H :Cpub [
Cprv
NH =Npub+Nprv (1)
Since we focus on resource provisioning in the presence of failures, we assume that the private Cloud resource to be homogeneous. We also assume that some public Cloud resources have similar capacity in terms of memory size and CPU speed as the private Cloud resources. As public Clouds have diversity of resource types (e.g., 12 instance types in Amazon’s EC2 [5]), this assumption is easy to hold. Although we are able to utilize more resources from the public Cloud, for this research we consider using the same amount of resource from both providers. In case of scaling of a job on more resources, we can estimate the duration of the given job on the public Cloud resources using a speedup model proposed by Downey [16]. We leave this extension for the future work.
2.2. System Workload
In this paper, we consider a broad range of high-performance applica-tions including many different jobs requiring large number of resources over short periods of time. These jobs vary in terms of nature (data or compute-intensive), size (small to large), and communication pattern. Computational Fluid Dynamic (CFD) applications are examples of such applications. Each job could include several tasks and they might be sensitive to communica-tion networks in terms of delay and bandwidth. As this type of jobs may not benefit heavily from using resources from multiple providers in virtualized environments [17], we assume that the jobs are tightly-coupled and will be allocated resources from a single provider.
Users submit their requests for Cloud resources to the private Cloud through a gateway (i.e., broker) and the gateway makes the decision as to which Cloud to service the requests. In this paper, a request corresponds to a job. At the time of submitting request for Cloud resources, the user also provides the following information:
• Type of required virtual machines
• Number of virtual machines (S)
• Estimated duration of the request (R)
• Deadline of the request (D)
The type of required VM can be chosen from an existing list which can be deployed in both private and public Clouds. To be more precise, we can define the system workload as the set of M requests each of them includes several tasks:
W orkload={J1, J2, ..., JM} where Ji ={τ1, τ2, ..., τSi} (2)
For the sake of simplicity, we refer toJi as request i. So, requestihas Si tasks (τi) whereDiis specified based on the desired user’s QoS (i.e., deadline to return the results)2. For each accepted request, the gateway must provide
2For instance, a given request x in cluster fs1 in DAS-2 systems [18] requires 4 VMs
Si virtual machines for the duration of Ri time unit such that the results must be ready before deadline Di as expressed in the following equation:
sti+Ti ≤Di (3)
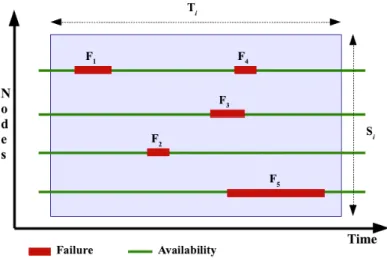
where sti and Ti are the submission time and execution time of request i. Note that Ri is the estimated duration of the request while Ti is the actual request duration. Therefore, user requests can be thought of as a rectangle whose length is the request duration (Ti) and the width to be the number of required VMs (Si) as is depicted in Figure 1. This can be helpful to understand how the requests get served in the available resources.
Figure 1: Serving a request in the presence of resource failures.
2.3. Failure Model
We define a failure as an event in which the system fails to operate accord-ing to its specifications. A system failure occurs when the system deviates from fulfilling its normal system function, the latter being what the system is aimed at. An error is that part of the system state which is liable to lead to subsequent failure: an error affecting the service is an indication that a failure occurs or has occurred. The adjudged or hypothesized cause of an error is a fault. In this paper, we consider resource failures that refer to any anomaly caused by hardware or software faults that make unavailability in service. We term the continuous period of a service outage due to a failure
as an unavailability interval. A continuous period of availability is called an
availability interval.
The public Cloud providers adopt carefully engineered modules that in-clude redundant components to cope with resource failures [19, 20]. We assume that this design style is too expensive to consider for private Clouds which make them less reliable as compared to the public Clouds. Thus, we concentrate on resource failures in the private Cloud.
Suppose, we have some failure events (Fi) in compute nodes while a re-quest is getting served. In the presence of a failure, hosted VMs on the compute node stop working. LetTs(.) and Te(.) be the functions that return the start and end time of a failure event. Te(.) is the time when a resource recovers form a failure event and starts its normal operation again. So, the unavailability interval (i.e., recovery time) of a given VM in the presence of failure Fi is Te(Fi)−Ts(Fi). As a given requesti needs all VMs to be avail-able for the whole required duration, any failure event in any of Si virtual machines would stop execution of the whole request i. The request can be started again, if and only if all VMs become available again. For instance, in Figure 1, the given request can be started at the end of failure event F1
or F2, but can not be resumed at the end of failure event F3 and have to
wait until the end of event F5. We analyze the effect of failure events on the
requests in Section 4.3.
Furthermore, it has been shown that in distributed systems there are
spatial and temporal correlations in failure events as well as dependency of workload type and intensity on the failure rate [21, 22, 23]. Spatial correlation means multiple failures occur on different nodes within a short time interval, while temporal correlation in failures refers to the skewness of the failure distribution over time. To be more precise about the temporal correlation of failures, we can define the time distance between two failure events as
Lij = ||Fi − Fj||= |Ts(Fi) − Ts(Fj)|. To determine the temporal failure correlation, a spherical covariance model is proposed in [22] as follows:
Ct(L) = 1−α L θ +β L θ 3 (4)
whereθ is a timescale to quantify the temporal relation of two failure events, and α and β are positive constants with α = β + 1. In this analysis, if
L > θ there is no temporal correlation (i.e., Ct(L) = 0). Moreover, we can consider the failure events as a time series and use the Autocorrelation
function (ACF) to determine the temporal correlation. In this case, temporal correlation means failure events exhibit considerable autocorrelation at small time lags, so the failure rate changes over time [23].
In addition to temporal failure correlation, the occurrence of a failure in a component can trigger a sequence of failures in other components of the system within a short period [21]. Let us consider A as the set of failure events according to increasing the start time of events as follows:
A={Fi |Ts(Fi)< Ts(Fi+1), i >0} (5)
So, we can define the space-correlated failures as follows:
Ec={Fi |Ts(Fi)≤Ts(Fj) +4, Fi, Fj ∈A} (6) where 4 is a time window and we can quantify the space-correlated failures by changing this parameter3.
These failure characteristics are essentially prominent for our case where we are dealing with workload of parallel requests and any failure event could violate the users’ QoS. To deal with these failure properties, in Section 5 we propose different strategies which are based on the workload model for the general failure events.
2.4. Problem Statement
The resource provisioning problem can be formulated as follows: Given a set of requests (e.g., parallel jobs) and a hybrid Cloud system with a failure-prone private Cloud, the problem is how to decide if a request should be executed in a public Cloud or in a private Cloud such that the end-user QoS requirements are satisfied.
3. Related Work
The related work can be classified in two groups: load sharing in the dis-tributed systems and solutions utilizing Cloud computing resources to extend the capacity of existing infrastructure. We also present a brief overview on QoS-based scheduling algorithms to complete this section.
3It has been shown that value of4 is between 100 to 250 seconds for several parallel
Iosupet al.[24] proposed a matchmaking mechanism for enabling resource sharing across computational Grids. In the proposed mechanism, whenever the current system load exceeds the delegation threshold, the delegation al-gorithm will be run to borrow a resource from a remote site to execute the request. They showed that by using this delegation mechanism, the number of finished jobs will be considerably increased. In contrast, we utilize the workload model in provisioning policies to borrow resources from a public Cloud provider to improve the users’ QoS of an organization in the presence of resource failures.
VioCluster [25] is a system in which a broker is responsible for dynami-cally managing a virtual domain by borrowing and lending machines between clusters. The authors proposed a heuristic brokering technique based on the information provided by PBS scheduler. Given the current load and avail-able machines in a cluster, they calculate the number of machines needed to run the input jobs. They did not consider the workload characteristics and resource failures in their proposed policy. Moreover, our proposed policies do not rely on any information from the local schedulers.
Montero et al. [26] introduced GridWay architecture to deploy virtual machines on a Globus Grid. They also proposed the GridGateWay [27] to enable Grid interoperability of Globus Grids. They provided a basic broker-ing strategy based on the load of the local resources. In contrast, we develop the InterGrid environment that is based on virtual machine technology and can be connected to different types of distributed systems through Virtual Machine Manager (VMM). Moreover, we consider a new type of platform which is commonly called hybrid Cloud and propose some provisioning poli-cies, which are part of the InterGrid Gateway (IGG), to utilize the public Cloud resources.
The applicability of public Cloud services for scientific computing has been demonstrated in existing work. Kondo et al.[1], provided a cost-benefit analysis between desktop grids and Amazon’s elastic model. They tried to answer several questions pertaining to these two platforms. One of the issues they addressed is the cost benefit of combining desktop grids with Cloud platform to solve large scale compute intensive applications. They concluded that hosting a desktop grid on a Cloud would be cheaper than running on stand alone desktop grids if bandwidth and storage requirements are less than 100Mbps and 10TB, respectively. In contrast to this work, we study the cost-benefit analysis of a private Cloud augmented with public Cloud and also propose different provisioning policies for scheduling requests between
these two platforms under resource failures.
In [28], the authors proposed a model that elastically extends the physical site cluster with Cloud resources to adapt to the dynamic demands of the application. The central component of this model is an elastic site manager that handles resource provisioning. The authors provided extensive imple-mentation, but evaluate their system under non-realistic workloads. In this paper, we take into account the workload model and failure correlation to borrow the public Cloud resources. Moreover, we evaluate the performance of the system under the realistic workload and failure traces.
Assun¸c˜ao et al. [4] proposed scheduling strategies to integrate resources from public Cloud provider and local cluster. In their work, the requests are first instantiated on cluster and in the event more resources are needed to serve user requests, IaaS Cloud provider virtual machines are added to the cluster. This is done to reduce users’ response time. Their strategies, however, do not take into consideration the workload characteristics when making decisions on redirection of requests between local cluster and public Cloud. Furthermore, the authors do not consider the trade-off between cost and performance in case of resource failures on local cluster.
Recently, Moschakis and Karatza [29] have evaluated the performance of applying Gang scheduling algorithms on Cloud. The authors addressed tasks that require frequent communication for which Gang scheduling algorithms are suitable. They compared two gang scheduling policies, Adaptive First Come First Serve (AFCFS) and Largest Job First Served (LJFS) on a Cloud computing environment. Their study is restricted to a single public Cloud which consists of a cluster of VMs on which parallel jobs are dispatched. In contrast, we develop our scheduling strategies on a hybrid Cloud computing environment.
There are several research works that investigated the QoS-based schedul-ing in the parallel and distributed systems. QoPS [30] is a scheduler that provide completion time guarantee for parallel jobs through job reservation to meet the deadlines. He et al. [31] used Genetic algorithm for scheduling of parallel jobs with QoS constraints (e.g., deadline). In addition, admission control policies have been applied to provide QoS guarantees to parallel ap-plications in resource sharing environments [32]. On the contrary, we utilize the selective and aggressive (EASY) backfilling with checkpointing as the fault-tolerant scheduling algorithms, due to their sub-optimal performance and popularity in the production systems [33, 34, 35].
Figure 2: The hybrid Cloud architecture.
4. The Hybrid Cloud System
In this section, we present a flexible and scalable hybrid Cloud architec-ture which is designed and implemented by the Cloudbus research group4.
In the following, an overview of the hybrid Cloud architecture of interest and its implementation is presented.
4.1. System Architecture
Figure 2 shows the system architecture used in this paper. We use the concepts developed for interconnecting Grids [36] to establish a hybrid Cloud computing infrastructure that enables an organization which wants to sup-ply its users’ requests with local infrastructure (i.e., private Cloud) as well as computing capacity from a public Cloud provider. The system has several components that includes InterGrid Gateways (IGGs), the Virtual Infrastruc-ture Engine (VIE) and Distributed Virtual Environment (DVE) manager for creating a virtual environment to help users deploy their applications [37].
Peering arrangements between the public and private Clouds is estab-lished through an IGG. An IGG is aware of the peering terms between source providers and selects suitable one that can provide the required re-sources for incoming request. The provisioning policies is also part of the IGG which include the scheduling algorithms of the private and the public
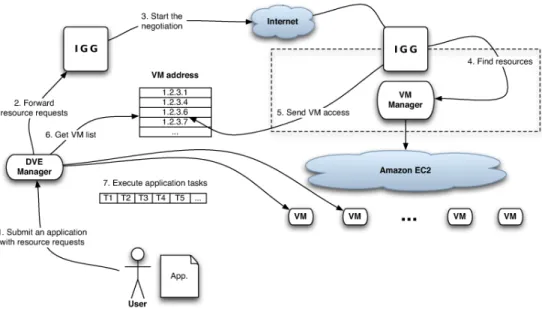
Figure 3: Resource provisioning through IGG.
Cloud as well as brokering strategies to share the incoming workload with the public Cloud provider.
The Virtual Infrastructure Engine (VIE) is the resource manager for the private Cloud and can start, pause, resume, and stop VMs on the physical resources. A three-step scenario in which an IGG allocates resources from a private Cloud in an organization to deploy applications, is indicated in Figure 2. In some circumstances, this IGG interacts with another IGG that can provision resources from a public Cloud to fulfill the users’ requirements (see Figure 3). Since we have a system that creates a virtual environment to help users deploy their applications, a Distributed Virtual Environment (DVE) manager has the responsibility of allocating and managing resources on behalf of applications.
As many organizations intend to provide the best possible services to their customers, they usually instrument their system’s middleware (e.g., VIE) to monitor and measure the system workload. This information in short-term can be used by system administrators to overcome the possible bottlenecks in the system. Furthermore, characterization of the system workload based on a long-term measurement can lead us to improve the system performance [38]. In this study, we assume that the organization has such a workload charac-terization, so we can adopt it in the resource provisioning policies. However,
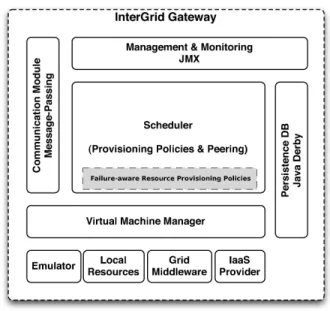
Figure 4: IGG components.
in Section 5 we also investigate a case where we do not have a comprehensive workload model.
4.2. Systems Implementation
The IGG has been implemented in Java and a layered view of its com-ponents is depicted in Figure 4. The core component of the IGG is the
Scheduler, which implements provisioning policies and peering with other IGGs. The scheduler maintains the resource availability information as well as creating, starting and stopping the VMs through the Virtual Machine Manager (VMM). VMM implementation is generic, so different VIEs can be connected and make a flexible architecture. Currently, VIE can connect to OpenNebula [39], Eucalyptus [40], or Aneka [8] to manage the local resources as a private Cloud. In addition, two interfaces to connect to a Grid middle-ware (i.e., Grid’5000) and an IaaS provider (i.e., Amazon’s EC2 [5]) have been developed. Moreover, an emulated VIE for testing and debugging has been implemented for VMM.
The persistence database is used for storing information of the gateway such as VM templates and peering arrangements. In this work, we assume the case where the public Cloud provider has a matching VM template for each available template at the database. The Management and Monitoring enables
gateway to manage and monitor resources such as Java applications. The Communication Module provides an asynchronous message-passing mecha-nism, and received messages are handled in parallel by a thread-pool. That makes gateway loosely coupled and allows for more failure-tolerant commu-nication protocols.
Figure 3 shows the main interactions in the system when the user sends a request to the DVE manager. The local IGG tries to obtain resources from the underlying VIEs. This is the point where the IGG must make decision about selecting resource provider to supply the user’s request, so the resource provisioning policies come to the picture. As it can be seen in Figure 3, the request is redirected to the remote IGG to get the resource from the public Cloud provider (i.e., Amazon’s EC2). Once the IGG has allocated the requested VMs, it makes them available and the DVE manager will be able to access the VMs and finally deploy the user’s application.
4.3. Fault-Tolerant Scheduling Algorithms
As depicted in Figure 4, we need an algorithm for scheduling the requests for the private and public Clouds. For this purpose, we utilize a well-known scheduling algorithm for parallel requests, which is called selective backfill-ing [33]. Backfillbackfill-ing is a dynamic mechanism to identify the best place to fit the requests in the scheduler queue. In other words, Backfilling works by identifying hole in the processor-time space and moving forward smaller requests that fit those holes. Selective backfilling grants reservation to a request when its expected slowdown exceeds a threshold. That means, the request has waited long enough in the queue. The expected slowdown of a given request is also called eXpansion Factor (XFactor) and is given by the following equation:
XF actor = Wi+Ti
Ti
(7) where Wi and Ti is the waiting time and the run time of request i, respec-tively. We use the Selective-Differential-Adaptive scheme proposed in [33], which lets the XFactor threshold to be the average slowdown of previously completed requests. It has been shown that selective backfilling outperforms other types of backfilling algorithms [33].
We used another scheduling algorithm,aggressive backfilling [41], in our experiments as the base algorithm. In the aggressive backfilling (EASY), only the request at the head of the queue, called the pivot, is granted a reservation. Other requests are allowed to move ahead in the queue as long
as they do not delay the pivot. The reason we choose EASY backfilling as the base policy is its popularity in the production systems [9, 34].
After submitting requests to the scheduler, each VM runs on one avail-able node. In the case of resource failure during the execution, we assume
checkpointing so that the request is started from where it left off when the VM becomes available again. To this end, we argue that having an optimal fault-tolerant scheduling in a failure-prone private Cloud is not good enough to meet the users’ QoS and utilizing public Cloud resources is required.
In case of k failure events, let Es and Eo be the set of singular and
overlapped failure events respectively ordered in ascending manner by the start time. These sets can be defined as follows:
Es={Fi |Te(Fi)< Ts(Fj),1≤i < j ≤k} (8)
Eo ={Xi |Xi = (F1, ..., Fn), Ts(Fi+1)≤Te(Fi),1≤i≤n−1} (9)
The union of these two sets is a series of failure events which causes the service unavailability for a given request (i.e., E = Es ∪Eo). It is worth noting that since failures are numbered based on their occurrence, n-tuples in Eo are time ordered. For each member of E, the service unavailability time can be obtained by the following equations:
ds = X ∀Fi∈Es [Te(Fi)−Ts(Fi)] (10) do = X ∀Xi∈Eo [max{Te(Xi)} −min{Ts(Xi)}] (11)
where ds applies for singular failures and do applies for overlapped failures. As mentioned earlier, all VMs must be available for the whole requested duration, so any failure event in any of Si virtual machines would stop the execution of the whole request i.
For instance, E = {F1, F2,(F3, F4, F5)} is the failure set for Figure 1.
So, ds= [(Te(F1)−Ts(F1)) + (Te(F2)−Ts(F2))] anddo = [Te(F5)−Ts(F3)]
would be the service unavailability time for singular failures and overlapped failures, respectively.
The above analyses reveal that even in the presence of an optimal fault-tolerant mechanism (e.g., perfect checkpointing) in the private Cloud, a given request is faced withds+dotime unit of delay which may consequently breach the request’s deadline. In other words, if the request only has been stalled
for the duration of singular and overlapped failures (i.e., ds+do), without need to restart from the beginning or the last checkpoint, still we suffer a long delay due to service unavailability. This is the justification of utilizing highly reliable services from a public IaaS Cloud provider.
To complete these analyses, we consider a case of independent tasks in the requests, so VMs can fail/recover independently. In this scenario, we only take into accounts the singular failures. In other words, a single failure just stops a single task and not the whole request. Therefore, the service unavailability time can be obtained by Equation (10) for all failures events (i.e., ∀Fi). Comparing to the previous scenario, a request with independent tasks encounters less delay when getting service and consequently less likely to breach the deadline. In this paper, we focus on the former scenario and investigate requests with tightly-coupled tasks. We leave the details of mixed workloads as the future work.
We modified the backfilling scheduling algorithms to support the per-fect checkpointing mechanism and provide a fault tolerant environment for serving requests in the private Cloud. The checkpointing issues are not in the scope of this research and interested readers can refer to [42] to see how checkpoint overhead and period can be computed based on the failure model.
5. The Proposed Resource Provisioning Policies
In this section, we propose a set of provisioning policies that include the scheduling algorithms of private and public Clouds as well as brokering strategies to share the incoming workload with the public Cloud provider. The scheduling algorithms are discussed in Section 4.3, so in the following we present some brokering strategies to complete provisioning policies.
The proposed strategies are based on the workload model as well as the failure correlations and aimed to fulfill the deadline of users’ requests. They also take advantage of knowledge-free approach, so they do not need any sta-tistical information about the failure model (e.g., failure distribution) which subsequently makes the implementation of these policies easier in the IGG (see Section 4.2).
5.1. Size-based Brokering Strategy
There are several studies that found the spatial correlation in failure events in distributed systems [21, 22]. That means, one failure event could trigger multiple failures on different nodes within a short time interval. In
other words, resource failures occur often in bursts. For instance, a single power supply fault in a rack server can creates a series of failure events in the nodes within the rack server. This property is very detrimental for our case where each request needs all VMs to be available for the whole required duration. Moreover, as it is mentioned in Equations (10) and (11), the service unavailability is dependent on the spatial behavior of the failures in the sys-tem (i.e., number of elements in Fs and Fo). Therefore, the more requested VMs, the more likely the request to be affected by nearly simultaneous fail-ures.
To cope with this situation, we propose a redirecting strategy that sends wider requests (i.e., larger Si) to the highly reliable public Cloud resources, while serving the narrow requests in the failure-prone private Cloud. This strategy needs a value to distinguish between wide and narrow requests and we specify it as the mean number of VMs per request.
To find the mean number of VMs per request, we need the probability of different number of VMs in the incoming requests. Without loss of generality, we assume thatPone andPpow2 are probabilities of request with one VM and
power of two VMs in the workload, respectively. So, the mean number of virtual machines required by requests is given as follows:
S =Pone+ 2dre(Ppow2) + 2r(1−(Pone+Ppow2)) (12)
where r is the mean value of requests in form of power of two. Based on the parallel workload models, the size of each request follows a two-stage uniform distribution with parameters (l, m, h, q) [18, 43]. This distribution consists of two uniform distributions where the first distribution would be in the interval of [l, m] with probability of q and the second one with the probability of 1−q would be in the interval of [m, h]. So, m is the middle point of possible values between l and h. Intuitively, this means that size of requests in the real parallel workloads tend to be in a specific range. For instance, in a system with 64 nodes, the parallel requests would be in a range of [21...26]. In this case, l= 1 andh= 6 wheremandqare determined based on the tendency of parallel requests. For a two-stage uniform distribution, the mean value is (l+m)/2 with probabilityqand (m+h)/2 with probability 1−q. Hence,r in Equation (12) can be found as the mean value of the two-stage uniform distribution as follows:
r= ql+m+ (1−q)h
The redirection strategy submits requests to the public Cloud provider if the number of requested VMs is greater than S, otherwise the request is served by the private Cloud resources.
5.2. Time-based Brokering Strategy
In addition to spatial correlation, failure events are correlated in the time domain which means the skewness of the failure distribution over time [22]. So, the failure rate is time-dependent and some periodic failure patterns can be observed in the different time-scale [23]. The larger requests in terms of duration mainly have been affected by this temporal correlation as these requests stay longer in the system and are likely to see more failures. So, there is a strong relation between the service unavailability and the (estimated) request duration.
On the other hand, the requests duration (job runtime) in real distributed systems are long-tailed [38, 44]. This means that a very small fraction of all requests are responsible for the main part of the load. To be more precise, Figure 5 shows the mass-count disparity of the request duration in a typical parallel workload (i.e., cluster fs3 in multi-cluster DAS-2 system [18]). We can observe that the shortest 80% of the requests contribute only the 20% of the total load. The remaining longest 20% of requests contribute about 80% of the total load. This reveals the long-tailed distribution for request duration in such systems [38].
In the time-based brokering strategy, we propose to redirect longer re-quests to the public Cloud to handle the above-mentioned issues. For this purpose, we can adopt a single or combination of global statistics of the re-quest duration (e.g., mean, median, or variance) on the basis of the desired level of QoS and system performance. In this paper, we use the mean re-quest duration as the decision point for the gateway to redirect the incoming requests to the Cloud providers.
In this strategy, if the request duration is less than or equal to the mean request duration, the request will be redirected to the private Cloud. By this technique, majority of short requests could meet their deadlines as it is less likely to encounter many failures. Moreover, longer requests will be served by the public Cloud resources and can meet their deadlines under nearly unlimited resource availability in the public Cloud provider. However, some short requests which are affected with the long failures in the private Cloud, or the requests with long waiting time in the public Cloud provider, may not meet their deadlines.
Figure 5: Mass-Count of the request duration in a typical parallel workload (cluster fs3 in DAS-2 system).
Global statistics of the request duration can be obtained from the fitted distribution provided by the workload model. For instance, the request du-ration of the DAS-2 multi-cluster system is the Lognormal distribution with parameters µ and σ [18], so the mean value is given as follows:
T =eµ+σ
2
2 (14)
Another advantage of this strategy is better utilization of the allocated public Cloud resources. For example in Amazon’s EC2, if a request uses a VM for less than one hour, the cost of one hour must be paid. So, when we redirect longer requests to the public Cloud, the money paid will be worth for the service received. This advantage is explored in detail in Section 6.4.
5.3. Area-based Brokering Strategy
The two aforementioned strategies are based on only one aspect of the request i: the number of VMs (Si) or duration (Ti). The third proposed strategy is aimed to make a compromise between the size-based and the time-based strategies. Hence, we utilize the area of a request which is the area of the rectangle with length Ti and width Si as the decision point for the gateway (see Figure 1). We are able to calculate the mean request area by multiplying the mean number of VMs by the mean request duration, as follows:
The redirection strategy submits requests to the public Cloud provider if the area of the request is greater than A, otherwise it is served in the private Cloud. This strategy sends long and wide requests to the public Cloud provider, so it would be more conservative than the size-based strategy and less conservative than the time-based strategy.
5.4. Estimated Time-based Brokering Strategy
All three proposed strategies are based on the workload model, which must be known beforehand. However, in the absence of such a workload model we should be able to adopt an alternative strategy for a typical hy-brid Cloud system. As mentioned in Section 2.2, users provide an estimated duration at the submission time of the request i (i.e., Ri). There are sev-eral studies about utilizing user estimates in the scheduling of parallel work-loads [45, 34, 35]. It has been shown that users do not provide accurate estimate for the duration of requests where they are usually modal (i.e., users tend to provide round values). However, it has been shown that there is a strong correlation between estimated duration and actual duration of a request [18]. That means, requests with larger estimated duration generally run longer. Therefore, we can leverage this correlation to determine longer requests and redirect them to the public Cloud.
For instance, Figure 6 shows the cumulative distribution function (CDF) of the estimated and actual duration of requests in a typical parallel workload (i.e., cluster fs4 in DAS-2 multi-cluster system). We can easily observe the positive correlation in this figure. Besides, since CDF of the estimated request duration is below the CDF of actual request duration, we can conclude that users usually overestimate the request duration. This fact has been observed in distributed-memory parallel systems as well [45].
The modality of the estimated request durations can help us to find a decision point for the brokering strategy. As it is depicted in Figure 6, re-quests with estimation bigger than 2×10⁵ seconds are good candidates to
redirect to the public Cloud as they are the longest 30% of the requests. In Section 6.2, we illustrate the simulation results of this strategy with a real workload trace.
6. Performance Evaluation
In order to evaluate the performance of the proposed policies, we imple-mented a discrete event simulator using CloudSim [46]. We used simulation
Figure 6: Cumulative distribution function of the estimated and actual request duration in a typical parallel workload (cluster fs4 in DAS-2 system).
as experiments are reproducible and controllable.
The performance metrics that are considered in all simulation scenarios are the deadline violation rate and the bounded slowdown [47]. The violation rate is the fraction of requests that do not meet their deadlines. The bounded slowdown is response time normalized by running time and can be defined as follows: Slowdown= 1 M M X i=1 Wi+max(Ti, bound) max(Ti, bound) (16) where Wi and Ti is the waiting time and the run time of request i, respec-tively. Also, boundis set to 10 seconds to eliminate the effect of very short requests [47].
To show the efficiency of public Cloud resource provisioning to reduce the violation rate, we define the Performance-Cost Efficiency (PCE) as follows:
P CE= Vbase−Vpo
CloudCostpo
(17)
whereVbase and Vpoare the number of deadline violations using abasepolicy andpopolicy, respectively. TheCloudCostpois the price to be paid to utilize the public Cloud resources for the po policy. We consider, the base policy as the EASY backfilling in the Earliest Deadline First (EDF) manner on the private Cloud without using the public Cloud resources. It should be noted that bigger value of PCE means the higher efficiency in terms of spending money to decrease the violation rate.
Table 1: Input parameters for the workload traces.
Input Parameters Distribution/Value (fs4) Distribution/Value (fs1)
Inter-arrival time trace-based trace-based
No. of VMs Loguniform (l= 0.8, m= 3.5, h, q= 0.9) Loguniform (l= 0.8, m= 3.0, h, q= 0.6) Request duration Lognormal (µ= 5.3, σ= 2.5) Lognormal (α= 4.4, β= 1.7)
Pone 0.009 0.024
Ppow2 0.976 0.605
R 2×10⁵ 3×10³
To compute the cost of using resources from a public Cloud provider, we use the amounts charged by Amazon to run basic virtual machines and network usage at EC2. The cost of using EC2 for policypo can be calculated as follows:
CloudCostpo= (Upo+Mpo·Us)Cn+ (Mpo·Bin)Cx (18) where Upo is the public Cloud usage per hour for the policypo. That means, if a request uses a VM for 40 minutes for example, the cost of one hour is considered. Mpois the fraction of requests which are redirected to the public Cloud. Also, Us is the startup time for initialization of operating system on a virtual machine which is set to 80 seconds [48]. We take into account this value as Amazon commences charging users when the VM process starts.
Bin is the amount of data which transfer to Amazon’s EC2 for each request. The cost of one specific instance on EC2 is determined as Cnand considered as 0.085 USD per virtual machine per hour for a small instance (in us-east). The cost of data transfer to Amazon’s EC2 is also considered asCx which is 0.1 USD per GB5. It should be noted that we consider a case where requests’ output are very small and can be transfered to the private Cloud for free [5].
6.1. Experimental Setup
For evaluation of the proposed policies under realistic and various working conditions, we choose two different workloads. First, we use two different real workload traces of DAS-2 multi-cluster system (i.e., fs4 and fs1 cluster) obtained from Parallel Workload Archive [49]. Second, we use the workload model of the DAS-2 system [18], as a typical parallel workload to analyze performance of the proposed policies while input workload changes. The aim
of the first experiment is to validate our policies and show their ability to perform in a real hybrid Cloud system. However, as we want to explore the system performance with various workloads, we run extensive simulations in the second experiment with some synthetic workload traces.
Table 1 illustrates the parameters for two different traces for the first experiment. The parameters for the second experiments are listed in Ta-ble 2. Based on the workload characterization, the inter-arrival time, request size, and request duration follow Weibull, two-stage Loguniform and Lognor-mal distributions, respectively [18]. In the trace experiment, we only used the workload distributions in the brokering strategies, while in the second experiment, the synthetic workload is also generated by the corresponding distributions.
In order to generate different workloads for the second experiment, we modified three parameters of the workload model, one at a time (see Ta-ble 2). To change the inter-arrival time, we modified the second parameter of the Weibull distribution (the shape parameter β). Also, to have requests with different duration, we changed the first parameter of the Lognormal distribution between 4.0 and 5.0 which is mentioned in Table 2. Moreover, we vary the middle point of the Loguniform distribution (i.e., m) to generate the workload with different number of VMs per request wherem=h−ωand
h = log2Nprv, where Nprv is the number of resources in the private Cloud. We modified the value of ω between 2.0 to 3.0, where the larger value of
ω, the narrower the requests. It should be noted that when we change one parameter in the workload model, other parameters are fixed and set to be in the middle of their interval. For instance, when we change the arrival rate (β), we set ω = 2.5 and µ = 4.5. These values have been chosen in a way that the generated synthetic workloads can reflect the realistic parallel workloads [18].
For each simulation experiment, statistics were gathered for a two-month period of the DAS-2 workloads. For the workload traces, we choose eight months of the traces in four two-months partitions. The first week of work-loads during thewarm-up phase were ignored to avoid bias before the system reached steady-state. For the second experiment, each data point is the av-erage of 50 simulation rounds including with number of jobs varying between 3,000 to 25,000 (depends on the workload parameters). In our experiments, the results of simulations are accurate with a confidence level of 95%.
Table 2: Input parameters for the workload model.
Input Parameters Distribution/Value
Inter-arrival time Weibull (α= 23.375,0.2≤β≤0.3) No. of VMs Loguniform (l= 0.8, m, h, q= 0.9) Request duration Lognormal (4.0≤µ≤5.0, σ= 2.0)
Pone 0.024
Ppow2 0.788
Nprv = Npub = 64 with homogeneous computing speed of 1000 MIPS6. The time to transfer the application (e.g., configuration file or input file(s)) for the private Cloud is negligible as the local infrastructures are interconnected by a high-speed network, soLprv= 0. However, to execute the application on the public Cloud we must send the configuration file as well as input file(s). So, we consider the network transfer time asLpub = 64 sec., which is the time to transfer 80 MB data7 on a 10 Mbps network connection8. So,Bin is equal to 80 MB in Equation (18).
The failure trace for the experiments is obtained from the Failure Trace Archive [52]. We analyzed 9 different failure traces from the Failure Trace Archive to choose the suitable failure trace. Grid’5000 traces has “medium” volatility, availability and scale over the period of 18 months (see [52] for more details). So, we use the failure trace of a cluster in the Grid’5000 with 64 nodes for duration of 18 months, which includes on average 800 events per node. The average availability and unavailability time in this trace is 22.26 hours and 10.22 hours, respectively. Nevertheless, the proposed strategies are based on the general characteristics of failure events in distributed systems and can be utilized with any failure pattern.
To generate the deadline of requests, we utilize the same technique de-scribed in [30], which provides a feasible schedule for the jobs. To obtain the deadlines, we conduct the experiments by scheduling requests on the pri-vate Cloud without failure events using EASY backfilling. Then we used the
6This assumption is made just to focus on performance degradation due to failures. 7This is the maximum amount of data for a real scientific workflow application [50]. 8The network latency is negligible as it is less than a second for public Cloud
following equations to calculate the deadline di for request i: Di = ( sti+ (f · tai) if [sti+ (f· tai)]< cti cti otherwise (19)
wheresti is the request’s submission time,cti is its completion time,taiis the request’s turn around time (i.e., tai =cti−sti). We definef as a stringency factor that indicates how urgent the deadlines are. If f = 1.0, then the request’s deadline is the completion under the EASY backfilling scenario. We evaluate the strategies with different stringency factors where f is 1.0, 1.3 and 1.7 termedtight,normal andrelaxed deadline scenarios, respectively. This assumption generates a realistic deadline for each request and has been applied by similar studies such as [4].
6.2. Validation Through Trace-based Simulations
In this section, we present the results of simulation experiments where the input workload is a real trace. The violation rate, Cloud cost per month, and slowdown for different brokering strategies are reported in Table 3 and Table 4 for fs4 and fs1 traces, respectively. In these tables, Size, Time, Area, and EsTime refer to size-based, based, area-based, and estimated time-based brokering strategies, respectively. SB stands for Selective Backfilling. For the EsTime-SB strategy, we adopt Ri > R to redirect requests to the public Cloud. The last row of each table, EASY, is the case when we do not redirect the requests to the public Cloud and the private Cloud serves all incoming requests while using EASY backfilling algorithm.
The results, at first, confirm the validity and functionality of the pro-posed strategies under realistic working conditions. As it is illustrated in Table 3 and Table 4, our brokering strategies are able to improve the slow-down in any circumstance where the improvement on the violation rate is mainly for the tight deadlines. Moreover, the proposed strategy based on the estimated request duration (EsTime-SB) yields comparable performance to other strategies in terms of the violation rate and slowdown. For instance, using EsTime-SB strategy with fs4 trace, an organization can improve its services to the users’ requests about 32% in terms of violation rate for the tight deadlines and 57% in terms of slowdown by only paying 135 USD per month. This indicates that we are able to use the user estimates for requests to improve the system performance.
Table 3: Results of simulation for fs4 trace.
Violation rate (%) Cloud cost/month (USD) Slowdown Strategy tight normal relaxed
Size-SB 22.52 0.19 0.0 471.65 315.65
Time-SB 39.18 0.29 0.0 220.08 1016.55
Area-SB 38.72 0.22 0.0 253.53 761.89
EsTime-SB 36.49 0.02 0.0 134.97 1051.25
EASY 53.99 0.94 0.1 0.0 2447.76
Table 4: Results of simulation for fs1 trace.
Violation rate (%) Cloud cost/month (USD) Slowdown Strategy tight normal relaxed
Size-SB 38.14 0.0 0.0 1794.23 797.91
Time-SB 43.14 0.0 0.0 649.85 904.09
Area-SB 41.09 0.0 0.0 901.20 812.71
ESTime-SB 41.58 0.0 0.0 861.17 919.32
EASY 59.60 1.67 0.52 0.0 4427.28
The results in these tables express that the performance of area-based strategy is between size-based and time-based strategies while size-based strategy outperforms others in terms of violation rate as well as slowdown. However, the difference between performance of size-based and area-based strategies is marginal for fs1 trace, while the size-based strategy is much better than the area-based for fs4 trace. The reason of this difference is the correlation between request duration and request size in these workload traces, which can be positive or negative [18, 43]. The positive correlation means requests with longer duration have larger number of VMs.
To be more precise, cumulative distribution functions of request dura-tion and request size for fs1 and fs4 traces are depicted in Figure 7. We observe that fs1 has much wider request size with respect to fs4, while fs4 has marginally longer request duration in comparing to fs1. Focusing on Figure 7(a) and Figure 7(b) reveals that fs4 has negative correlation between request duration and request size, while this correlation is positive for fs1 trace. This observation is quantitatively confirmed through Spearman’s rank
correlation coefficient [18]. In this circumstance, we find that the perfor-mance of the size-based and area-based strategies gets closer when there is a positive correlation between request duration and request size. It should
(a) CDFs of request duration (b) CDFs of request size
Figure 7: Cumulative distribution functions of request duration and request size for con-sidered workload traces.
be noted that we conducted some experiments with other real traces and the same behavior has been observed.
As these trace-based experiments only reveal a few possible points from the state space, so they are not sufficient to conclude about the performance of our brokering strategies. In the following section, we present the simulation results for the workload model to analyze the performance of the provisioning policies under various working conditions. It is worth noting that as we do not have any model for the estimated duration of requests, we are not able to explore the performance of EsTime-SB for the workload model simulations.
6.3. Performance Analysis Through Model-based Simulations
The results of workload model simulations for the violation rate versus various workloads are depicted in Figure 8, Figure 9, and Figure 10 for dif-ferent provisioning policies and tight, normal and relaxed deadline scenarios, respectively. As it can be seen in Figure 8, the size-based strategy has the lowest violation rate while the other two strategies have about the same vi-olation rates for the tight deadlines. Based on Figure 9 and Figure 10, by increasing the workload intensity (i.e., arrival rate, duration or size9 of re-quests), we observe increase in the violation rate for all provisioning policies. However, the violation rate of size-based brokering strategy, in contrast to others, has reverse relation with the request size where we observe increasing in the number of fulfilled deadlines by reducing the size of requests. This
(a) Request arrival rate (b) Request duration (c) Request size Figure 8: Violation rate for all provisioning policies versus different workloads with tight deadlines (f = 1.0).
behavior is due to increasing the number of redirected requests to the failure-prone private Cloud in the size-based brokering strategy. This fact is more pronounced in Figure 8(c).
Moreover, the size-based brokering strategy yields a very low violation rate for normal and relaxed deadlines, as illustrated in Figure 9 and Figure 10. The area-based strategy also shows a comparable performance to the size-based brokering where the time-size-based strategy has the worst performance specially when the workload intensity increases.
Based on the results of trace-based simulations, we observe a considerable improvement in terms of violation rate mainly in the case of tight deadlines. However, model-based simulations with various workloads elaborate more on results. Here, for the tight deadlines, the violation rate is improved about 39.78%, 16.61%, and 15.11% with respect to the single private Cloud (EASY) for the size-based, time-based, and area-based strategies, respectively. How-ever, for the normal and relaxed deadline scenarios, the improvement is much higher and it is more than 90% for all cases. This is because of higher work-load intensity in the model-based simulation with respect to the workwork-load traces used in Section 6.2. Therefore, the proposed policies are able to im-prove the users’ QoS in all circumstances, specially when we have an intensive workload with normal deadlines.
Figure 11 expresses the slowdown of requests for all provisioning poli-cies versus different workloads with the same configuration as previous ex-periments. It is worth noting that the slowdown is independent from the requests’ deadlines.
ar-(a) Request arrival rate (b) Request duration (c) Request size Figure 9: Violation rate for all provisioning policies versus different workloads with normal deadlines (f = 1.3).
(a) Request arrival rate (b) Request duration (c) Request size Figure 10: Violation rate for all provisioning policies versus different workloads with re-laxed deadlines (f = 1.7).
rival rate the slowdown will be increased where size-based and area-based strategies have a more gradual slope than the time-based strategy.
Moreover, the slowdown versus request duration, which is plotted in Fig-ure 11(b), reveals that slowdown is decreasing gradually by increasing the request duration. Based on the results in Figure 11(c), slowdown diminishes by reducing the request size (number of VMs per request) for the time-based and area-based strategies. In contrast, slowdown gradually increases in the size-based strategy due to more redirection of requests to the failure-prone private Cloud. Nevertheless, size-based strategy has the best slowdown in all cases with respect to other strategies for different workload types.
Based on these results, utilizing the proposed brokering strategies can improve the slowdown of requests more than 95% with compare to the single failure-prone private Cloud as we are able to use highly reliable resources form the public Cloud platform.
(a) Request arrival rate (b) Request duration (c) Request size Figure 11: Slowdown for all provisioning policies versus different workloads.
As mentioned in Section 6.2, we have a positive or negative correlation between request duration and request size. Although the workload model does not take into account this correlation, we synthetically generate this correlation by changing the parameters of the workload model. For instance, for a given request duration, we changed the request size from large number of VMs to small number of VMs. The results of this correlation are more pronounced in the third figure of each row (Figure (c)) from Figure 8 to Figure 11. As it can be seen in these figures, positive correlation makes the performance of area-based strategy to get closer to the size-based strategy.
(a) Request arrival rate (b) Request duration (c) Request size Figure 12: Cloud cost on EC2 per month for all provisioning policies versus different workloads.
Figure 12 shows the amount of money spent on EC2 per month to re-spond to the incoming requests for different workload types. Similar to the slowdown, cost on EC2 is not dependent on the requests’ deadlines. As it can be observed in all workload types, the size-based strategy utilizes more resources from the public Cloud than other strategies and this is the reason
of the lower violation rate and slowdown which were described before in this section. Moreover, the time-based strategy has the lowest Cloud cost on EC2 while the area-based incurs the cost between size-based and time-based strategies. Expectedly, the Cloud cost has direct relation with the workload intensity, specially with the request arrival rate as depicted in Figure 12(a). The validity of the presented results in this section can be confirmed by the trace simulation in Section 6.2 where we present the performance met-rics only for two workload traces. In general, size-based brokering strategy surpass other strategies in terms of violation rate and slowdown for all dead-line scenarios, specially when there is negative correlation between request duration and request size. Moreover, time-based strategy incurs the lowest Cloud cost while the area-based and size-based strategies are in the next ranks, respectively.
6.4. Discussions
Selecting a suitable strategy for an organization is strongly dependent on many issues like desired level of QoS as well as budget constraints. In this section, to compare the different proposed policies in terms of cost and performance under different working conditions, we applied the Performance-Cost Efficiency (PCE) metric. For all provisioning policies, the measurements using the PCE metric for tight, normal, and relaxed deadlines are shown in Figures 13, 14, and 15, respectively.
We can infer that time-based brokering strategy has the best PCE among all proposed strategies, which means more efficiency in terms of fulfilled dead-lines with respect to the amount spent for the public Cloud resources. This result confirms the better resource utilization in the time-based strategy, which is mentioned at the end of Section 5.2.
For the tight deadlines (Figures 13), the size-based strategy has better PCE with respect to the area-based brokering. However, for other deadline scenarios (Figure 14, and 15), area-based yields the better PCE. This reveals that to select a proper brokering strategy, the users’ requirements in terms of slowdown and QoS must be taken into account carefully.
One possible question about selecting the best brokering strategy for a hybrid Cloud is the effect of failure patterns on the system performance. For instance, if we have a highly reliable or highly volatile private Cloud, which strategy would be the best. As mentioned earlier, the reported results are based on a system with medium reliability. However, we are able to provide some advices for other cases as well. In case of highly reliable private Cloud,
we may need to redirect a limited number of requests to the public Cloud, so we can adopt time-based strategy which is a low-cost brokering strategy with reasonable performance improvement. In contrast, if an organization has a volatile private Cloud (e.g., an old system), the size-based strategy might be a good candidate to fulfill the users’ QoS while incurs reasonable monetary cost for utilizing the public Cloud resources.
(a) Request arrival rate (b) Request duration (c) Request size Figure 13: Performance-Cost Efficiency for all provisioning policies versus different work-loads with tight deadlines (f = 1.0).
(a) Request arrival rate (b) Request duration (c) Request size Figure 14: Performance-Cost Efficiency for all provisioning policies versus different work-loads with normal deadlines (f = 1.3).
7. Conclusions
We considered the problem of QoS-based resource provisioning in a hy-brid Cloud computing system where the private Cloud is failure-prone. Our specific contributions in this work were as follows:
(a) Request arrival rate (b) Request duration (c) Request size Figure 15: Performance-Cost Efficiency for all provisioning policies versus different work-loads with relaxed deadlines (f = 1.7).
• We developed a flexible and scalable hybrid Cloud architecture to solve the problem of resource provisioning for users’ requests. The proposed architecture utilizes the InterGrid concepts which is based on the vir-tualization technology and adopt a gateway (IGG) to interconnect dif-ferent resource providers;
• We proposed brokering strategies in the hybrid Cloud system where an organization that operates its private Cloud aims to improve the QoS for the users’ requests by utilizing the public Cloud resources. Various failure-aware brokering strategies which adopt the workload model and take into account the failure correlations are presented. The proposed policies take advantage of knowledge-free approach, so they do not need any statistical information about the failure model of the local resources in the private Cloud;
• We evaluated the proposed policies and consider different performance metrics such as deadline violation rate and job slowdown. Experimental results under realistic workload and failure events, reveal that we are able to adopt the user estimates in the brokering strategy while using the workload model provides flexibility to choose the suitable strategy based on the desired level of QoS, needed performance, and available budget.
In future work, we intend to implement the proposed strategies inside the IGG and run real experiments. For this purpose, we will investigate different checkpointing mechanisms in our analysis and implementation as well. In
addition, we are going to investigate another type of applications like loosely-coupled Many-Task Computing (MTC) with ability of resource co-allocation. In this case, moving VMs between private and public Cloud will be another approach to deal with resource failures in the local infrastructure.
Acknowledgments
The authors would like to thank Rodrigo N. Calheiros and Prof. Andrzej Goscinski for useful discussions. The authors also would like to thank the reviewers for their comments that help improve this paper.
References
[1] D. Kondo, B. Javadi, P. Malecot, F. Cappello, D. P. Anderson, Cost-benefit analysis of Cloud computing versus desktop grids, in: Proceed-ings of the 23rd IEEE International Parallel and Distributed Processing Symposium (IPDPS 2009), IEEE Computer Society, Washington, DC, Rome, Italy, 2009, pp. 1–12.
[2] E. Deelman, G. Singh, M. Livny, B. Berriman, J. Good, The cost of doing science on the Cloud: The montage example, in: Proceedings of the 19th ACM/IEEE International Conference on Supercomputing (SC 2008), IEEE Press, Piscataway, NJ, Austin, Texas, 2008, pp. 1–12. [3] M. R. Palankar, A. Iamnitchi, M. Ripeanu, S. Garfinkel, Amazon S3
for science Grids: a viable solution?, in: Proceedings of the 1st Inter-national Workshop on Data-aware Distributed Computing (DADC’08) in conjunction with HPDC 2008, ACM, New York, NY, Boston, MA, 2008, pp. 55–64.
[4] M. D. de Assun¸c˜ao, A. di Costanzo, R. Buyya, Evaluating the cost-benefit of using cloud computing to extend the capacity of clusters, in: Proceedings of the 18th International Symposium on High Performance Parallel and Distributed Computing (HPDC 2009), ACM, New York, NY, Garching, Germany, 2009, pp. 141–150.
[5] Amazon Inc., Amazon Elastic Compute Cloud (Amazon EC2), http: //aws.amazon.com/ec2.
[7] J. McKendrick, NASA’s Nebula: a stellar example of private clouds in government, http://nebula.nasa.gov/.
[8] C. Vecchiola, X. Chu, R. Buyya, Aneka: A Software Platform for .NET-based Cloud Computing, IOS Press, Amsterdam, 2009, pp. 267–295. [9] B. Sotomayor, R. S. Montero, I. M. Llorente, I. Foster, Virtual
infras-tructure management in private and hybrid clouds, IEEE Internet Com-puting 13 (5) (2009) 14 –22.
[10] D. Ford, F. Labelle, F. I. Popovici, M. Stokely, V.-A. Truong, L. Barroso, C. Grimes, S. Quinlan, Availability in globally distributed storage tems, in: Proceedings of the 9th USENIX conference on Operating sys-tems design and implementation, USENIX Association, Berkeley, CA, Vancouver, BC, Canada, 2010, pp. 1–7.
[11] D. Oppenheimer, A. Ganapathi, D. A. Patterson, Why do internet ser-vices fail, and what can be done about it?, in: Proceedings of the 4th conference on USENIX Symposium on Internet Technologies and Sys-tems, USENIX Association, Berkeley, CA, Seattle, WA, 2003, pp. 1–15. [12] T. Mather, S. Kumaraswamy, S. Latif, Cloud Security and Privacy: An Enterprise Perspective on Risks and Compliance, O’Reilly Media, Inc., 2009.
[13] J. H. Abawajy, Determining service trustworthiness in Intercloud com-puting environments, in: The 10th International Symposium on Perva-sive Systems, Algorithms, and Networks (ISPAN 2009), 2009, pp. 784– 788.
[14] M. Mattess, C. Vecchiola, R. Buyya, Managing peak loads by leasing cloud infrastructure services from a spot market, in: Proceedings of the 12th IEEE International Conference on High Performance Computing and Communications (HPCC 2010), IEEE Press, Piscataway, NJ, Mel-bourne, Australia, 2010, pp. 180–188.
[15] B. Javadi, D. Kondo, J.-M. Vincent, D. P. Anderson, Discovering sta-tistical models of availability in large distributed systems: An empirical study of seti@home, IEEE Trans. Parallel Distrib. Syst. 22 (11) (2011) 1896–1903.
[16] A. Downey, A model for speedup of parallel programs, Technical Report UCB/CSD-97-933, Computer Science Division, U.C. Berkeley, Califor-nia, CA (1997).
[17] M. Tatezono, N. Maruyama, S. Matsuoka, Making wide-area, multi-site MPI feasible using Xen VM, in: Proceedings of the 4th Workshop on Frontiers of High Performance Computing and Networking in conjuction with ISPA 2006, Springer-Verlag, Berlin, Sorrento, Italy, 2006, pp. 387– 396.
[18] H. Li, D. Groep, L. Wolters, Workload characteristics of a multi-cluster supercomputer, in: Proceedings of the 10th International Workshop on Job Scheduling Strategies for Parallel Processing (JSSPP ’04), Springer-Verlag, Berlin, New York, USA, 2004, pp. 176–193.
[19] J. Varia, Best Practices in Architecting Cloud Applications in the AWS Cloud, Wiley Press, Hoboken, NJ, 2011, pp. 459–490.
[20] U. Hoelzle, L. A. Barroso, The Datacenter as a Computer: An Introduc-tion to the Design of Warehouse-Scale Machines, Morgan and Claypool Publishers, San Rafael, CA, 2009.
[21] M. Gallet, N. Yigitbasi, B. Javadi, D. Kondo, A. Iosup, D. Epema, A model for space-correlated failures in large-scale distributed systems, in: Proceedings of the 16th International European Conference on Parallel and Distributed Computing (Euro-Par 2010), Springer-Verlag, Berlin, Ischia, Italy, 2010, pp. 88–100.
[22] S. Fu, C.-Z. Xu, Quantifying event correlations for proactive failure man-agement in networked computing systems, Journal of Parallel and Dis-tributed Computing 70 (2010) 1100–1109.
[23] N. Yigitbasi, M. Gallet, D. Kondo, A. Iosup, D. Epema, Analysis and modeling of time-correlated failures in large-scale distributed systems, in: Proceedings of the 11th IEEE/ACM International Conference on Grid Computing (Grid 2010), IEEE Computer Society, Washington, DC, Brussels, Belgium, 2010, pp. 65 – 72.
[24] A. Iosup, D. H. J. Epema, T. Tannenbaum, M. Farrellee, M. Livny, Inter-operating Grids through delegated matchmaking, in: Proceedings of the
18th ACM/IEEE Conference on Supercomputing (SC 2007), ACM, New York, NY, Reno, Nevada, 2007, pp. 1–12.
[25] P. Ruth, P. McGachey, D. Xu, VioCluster: Virtualization for dynamic computational domain, in: Proceedings of the 7th IEEE International Conference on Cluster Computing (Cluster 2005), IEEE Press, Piscat-away, NJ, Burlington, MA, 2005, pp. 1–10.
[26] A. J. Rubio-Montero, E. Huedo, R. S. Montero, I. M. Llorente, Manage-ment of virtual machines on Globus Grids using GridWay, in: Proceed-ings of the 21st IEEE International Parallel and Distributed Processing Symposium (IPDPS 2007), IEEE Press, Piscataway, NJ, Long Beach, USA, 2007, pp. 1–7.
[27] E. Huedo, R. S. Montero, I. M. Llorente, Grid architecture from a metascheduling perspective, IEEE Computer 43 (7) (2010) 51 –56. [28] P. Marshall, K. Keahey, T. Freeman, Elastic site: Using clouds to
elasti-cally extend site resources, in: Proceedings of the 10th IEEE/ACM In-ternational Conference on Cluster, Cloud and Grid Computing (CCGrid 2010), IEEE Computer Society, Washington, DC, Melbourne, Australia, 2010, pp. 43–52.
[29] I. Moschakis, H. Karatza, Evaluation of gang scheduling performance and cost in a cloud computing system, The Journal of Supercomputing 1 (2010) 1–18.
[30] M. Islam, P. Balaji, P. Sadayappan, D. K. Panda, QoPS: A QoS based scheme for parallel job scheduling, in: Proceedings of the 9th Interna-tional Workshop on Job Scheduling Strategies for Parallel Processing (JSSPP ’03), Springer-Verlag, Berlin, Seattle, WA, 2003, pp. 252–268. [31] L. He, S. A. Jarvis, D. P. Spooner, X. Chen, G. R. Nudd, Dynamic
scheduling of parallel jobs with QoS demands in multiclusters and Grids, in: Proceedings of the 5th IEEE/ACM International Workshop on Grid Computing (Grid 2004), IEEE Computer Society, Washington, DC, Pittsburgh, USA, 2004, pp. 402–409.
[32] P. Xavier, W. Cai, B.-S. Lee, A dynamic admission control scheme to manage contention on shared computing resources, Concurrency and Computation: Practice and Experience 21 (2) (2009) 133–158.