Project Design Decisions of Egalitarian and
Non-Egalitarian International Organizations:
Evidence from the Global Environment Facility
and the World Bank
Alice Iannantuoni
⇤[email protected]
Charla Waeiss
†[email protected]
Matthew S. Winters
⇤[email protected]
*Department of Political Science, University of Illinois at Urbana-Champaign
†
Hoover Institution, Stanford University
October 2019
Abstract
Foreign aid flows result from agreements reached between states that need resources and other states or
international organizations that can provide those resources. Recent literature has argued that di↵erent
international development organizations bargain with aid-receiving states in particular ways. Specifi-cally, some authors argue that non-egalitarian international development organizations seek to secure more gains when bargaining with economically weak states. Global Environment Facility projects are negotiated by the international agency that will implement the project, allowing us to examine this claim in the context of a set of similar development projects. Correcting and reanalyzing an existing dataset describing the composition of financing in GEF projects, we find no evidence that the financing terms
provided by di↵erent GEF implementing agencies varies by the type of organization. Both egalitarian
and non-egalitarian agencies provide more external funding to poorer countries. We replicate this re-sult using data from development projects financed by the World Bank, the archetypal non-egalitarian international organization. We discuss how our results are consistent with organizational behavior that originates in the interests of an international bureaucracy oriented toward poverty alleviation.
Keywords: international organizations; bargaining; counterpart funding; foreign aid; Global Environ-ment Facility; World Bank
1
Introduction
Popular discourse often describes developing countries as being “forced” to accept foreign aid programs and
the conditions contained within them; academic analyses similarly tend to portray donors as making decisions
about funding commitments, and aid recipients automatically accepting those decisions. In reality, however,
many foreign aid projects—and particularly those involving international organizations—result from
nego-tiations between international development partners and the governments in developing countries. As one
seminal paper in the study of foreign aid argues, “Despite conventional wisdom that portrays borrowing
countries as helpless in the face of a unified ‘Northern Bloc,’ developing countries often—if not always—have
significant leverage over the architecture of the final loan document” (Nielson and Tierney 2003, p. 265).
Recent literature on foreign aid has sought to characterize this bargaining and the agreements that
result from it (Bueno de Mesquita and Smith 2007, 2009; Bayer et al. 2015; Wang 2016, 2018). This
literature highlights both that we might expect certain kinds of aid-receiving states to have leverage to strike
better or worse bargains and also that we might expect di↵erent kinds of international organizations to
pursue di↵erent bargaining outcomes depending on the aid-receiving state with which they are bargaining.
Bayer, Marcoux, and Urpelainen (2015) describe international development organizations as having either
egalitarian or non-egalitarian voting structures and argue that the two types of organizations will behave
di↵erently in bargaining with aid-seeking states. They propose that non-egalitarian organizations, such as
the World Bank, will work to secure more gains when they bargain with economically weak states. By
asking aid-receiving states with less bargaining power to pay a larger share of project costs, an international
development organization would be able to implement more and larger projects. Studying variation in the
distribution of costs within Global Environment Fund (GEF) projects that involve implementing agencies
with either non-egalitarian or egalitarian voting structures, Bayer, Marcoux, and Urpelainen (2015) find an
apparent positive correlation between the size of a country’s economy and the GEF funding share when the
non-egalitarian World Bank is the implementing agency for the project.
The idea that international development organizations would show this type of favoritism toward
eco-nomically powerful aid-receiving countries is surprising. These organizations are charged with facilitating
economic development in countries struggling with it. Reexamining the data used by Bayer, Marcoux, and
Urpelainen (2015), we show that their measure of the division of project costs looks only at GEF funding
rather than at the combined external funding from the GEF, the implementing agency, and other foreign
funders. When we correct the data to study the total external funding in GEF projects, we find that
coun-tries with larger economies contribute more of their own resources to projects of a given size. We find that
non-egalitarian voting structures. We show that the negative relationship is even more pronounced when
studying the aid recipient’s GDP per capita (a measure of economic development) as the main explanatory
variable, as opposed to GDP (a measure of the size of a country’s economy). We then show that similar
results obtain when studying the breakdown of financing in regular World Bank projects. Overall, these
results cast doubt on the claim that non-egalitarian international development organizations try to capture
a larger share of bargaining gains when interacting with economically weaker countries and provide
evi-dence that these organizations are in fact operating in accordance with their development mandate when it
comes to divvying up the costs of development interventions. In the conclusion, we discuss how these results
are consistent with a model in which organizational behavior originates in the interests of a bureaucracy
interested in poverty alleviation.
2
Bargaining Over Development Project Design
International development assistance takes the form of wealthy (or middle-income) countries transferring
resources to poorer countries, either directly as bilateral aid or else indirectly through multilateral
organiza-tions.1 There is variation in how international development programs are implemented: sometimes bilateral
and multilateral aid agencies transfer funds to a government while on other occasions they provide financing
to a private contractor or non-governmental organization to implement a development intervention (Dietrich
2013). In either case, there is usually an explicit understanding with the recipient government about how
much financing will be provided, for what purposes, and subject to what sorts of oversight and control
mechanisms (Winters 2010).
The specific characteristics of aid programs often are subject to bargaining between the aid-receiving
governments and the donor. Recipients may prefer that foreign aid projects be targeted at politically
important regions of the country (Briggs 2012, 2014, 2017; Jablonski 2014), whereas donors might prefer
to target the poorest areas of the country (Azam and La↵ont 2003) or a set of regions that are relevant
for specific political ends (Winters 2012). Recipients may prefer to have foreign financing run through
government systems, whereas foreign aid donors may prefer the greater control that they have if they
establish parallel implementing units (Dietrich 2013, 2016; Godfrey et al. 2002; Knack and Rahman 2007).
In addition, receiving governments and donors may bargain over policy concessions that the
aid-receiving government gives in exchange for the foreign financing (Bueno de Mesquita and Smith 2007, 2009;
Wang 2016, 2018). These policy concessions may be changes in economic policy that benefit the donor
1Milner (2006) explores why states choose to provide development financing through multilateral organizations, while
country or else concessions related to the military or geostrategic interests of the donor country. In a classic
article, Morgenthau (1962) argues that certain foreign policy objectives can be achieved only through such
aid-for-policy deals.
This literature makes claims about what types of states will receive and what kinds of international
development organizations will o↵er better or worse bargains. Bueno de Mesquita and Smith (2007, 2009)
argue that poor, small-winning-coalition countries are most likely to receive aid but that the magnitude of
the aid flows increases as winning-coalition size, wealth, and the salience of the policy concessions to the
donor increase. Wang (2016, 2018) uses a stochastic frontier analysis to identify the bargaining surplus
associated with agreements about aid flows and finds that democracies and countries experiencing a civil
war extract more of the surplus, while U.S. allies extract less. Bayer, Marcoux, and Urpelainen (2015)
distinguish between international organizations with egalitarian and non-egalitarian voting schemes and
argue that organizations of each type respond di↵erently to an aid-receiving state’s economic power.2
Bayer, Marcoux, and Urpelainen (2015) assume that the overall value of having a project realized is
greater than the overall costs of the project and use the Nash (1950) bargaining model to study the division
of the resulting surplus between the international development organization and the aid-receiving state. The
authors assume that each side wants to contribute as little as possible while still having the project realized,
that states have di↵erent levels of bargaining power, and that non-egalitarian organizations are more sensitive
to bargaining power. From this set of assumptions, it follows directly that non-egalitarian organizations will
realize deals where states with weaker bargaining power contribute more toward the total costs of a project.
Although the literature on foreign aid allocation sometimes appears to treat foreign aid as an
always-desirable flow of “free” money, Bayer, Marcoux, and Uprelainen (2015) begin from the important observation
that aid-receiving countries often contribute domestic resources to the realization of a development
interven-tion funded with foreign aid (see also Over 1981; Pallage and Robe 2015; Kotchen and Negi 2016; Winters
and Streitfeld 2018). In their model, a project will come to fruition only if a sufficient total amount of money
is provided by both the donor and the aid-receiving country.3
Empirically, the authors operationalize the bargaining power of an aid-seeking state as the overall size of
its economy (i.e., its gross domestic product (GDP)), and they provide empirical evidence that the division
of costs in some Global Environment Facility projects varies with GDP: as GDP rises, the share of the
project financed by the GEF rises. Crucially for their key claim about variation across types of international
development organizations, they find that this is true only for GEF projects implemented by the World Bank,
2An egalitarian voting scheme is most commonly one country, one vote, whereas non-egalitarian voting schemes typically
weight a state’s vote by its level of financial contributions to the international organization. The United Nations exemplifies the former, whereas the World Bank exemplifies the latter.
a non-egalitarian institution. Among projects implemented by U.N. agencies or regional development banks,
the level of GEF financing does not vary with the size of the aid-receiving country’s economy.4 The authors
raise the normative concern that this favoritism toward economically powerful countries by the World Bank
means that fewer resources are available for less powerful, likely poorer countries.
We find these results surprising for two reasons. First, sta↵making project-level decisions in international
development organizations are likely motivated by development objectives and therefore are likely to resist
making burdensome demands of countries with fewer resources (i.e., countries with smaller economies or
poorer countries).5 While pressure from powerful principals appears often to drive overall aid allocation and
policy innovations within international development organizations (Andersen et al. 2006; Fleck and Kilby
2006; Weaver 2008; Copelovitch 2010; Stone 2011; Clegg 2013; Lim and Vreeland 2013; Vreeland and Dreher
2014), day-to-day operational decisions, such as those about the division of project financing between the
donor and the recipient, are more likely to be driven by the preferences of individual bureaucrats.6
Second, rather than trying to limit the levels of financing that an international development organization
provides, we expect development agency sta↵to be motivated by disbursement pressure to maximize the
amount of money that they can reasonably dedicate to any given project (Easterly 2002; Woods 2006). Other
literature on the way that project costs get divvied up between international development organizations and
aid-receiving states, for instance, treats development organizations not so much as resource misers, trying
to protect the pool of resources that they might disburse, but rather as development-oriented actors trying
to ensure that any money dedicated to a development intervention is used wisely (Over 1981; Pallage and
Robe 2015; Kotchen and Negi 2016; Winters and Streitfeld 2018).
Based on these alternative assumptions about what types of projects will maximize utility for
bureau-crats within international development agencies, we expect that international development organizations
will negotiate projects in which poorer countries, relative to wealthier countries, contribute lower levels of
domestic financing for a given amount of external financing. We expect this pattern to hold regardless of the
voting structure of the international development organization involved in the project. Although we
acknowl-edge that di↵erent international development organizations have di↵erent bureaucratic cultures and that the
background characteristics of sta↵often vary across organizations, we are not aware of a bureaucratic
char-4In the main text, Bayer, Marcoux, and Uprelainen (2015) include regional development banks with U.N. agencies despite
the fact that regional development banks tend to have non-egalitarian voting structures. In the Online Appendix to the article, they show that their results are in fact stronger when they compare all development banks against the U.N. agencies (section 23).
5That said, working in the poorest countries in the world comes with risks: projects may be less likely to meet their
development objectives in difficult environments (Honig 2018). This might drive bureaucrats interested in promotion to be more hesitant about allocating funds to the poorest countries. We appreciate a reviewer pointing out this competing tension to us.
6See Sharma (2013) for an argument that even major policy innovations in international development organizations may
acteristic correlated with voting structure that would also correlate with the propensity to extract more or
less of a bargaining surplus during project negotiations. Therefore, we expect that projects overseen by
inter-national development organizations with either egalitarian or non-egalitarian voting structures will feature
the same pattern of supplying more international funding to poorer countries for a given contribution made
by those countries. Using a corrected version of the replication data for Bayer, Marcoux, and Uprelainen
(2015), we reexamine the evidence from the original context studied by those authors, Global Environment
Facility projects from the period 1991 to 2011. As in the original article, we examine whether or not there is
variation across GEF implementing agencies with egalitarian and non-egalitarian voting structures. We then
extend the analysis to World Bank projects from the period 1999 to 2016; as described above, the World
Bank is an international development organization with a non-egalitarian voting structure. In both cases, we
find that levels of external financing fall as countries become wealthier (i.e., poorer countries contribute less
domestic resources relative to a given level of foreign resources in a project), and for GEF projects, we find
no evidence of variation across implementing agencies with di↵erent voting structures. Before we present
our empirical analyses, we describe the GEF financing mechanism and the GEF cofinancing data in more
depth.
3
Project Financing through the GEF
The Global Environment Facility was established in 1991 to help protect the global environment and support
sustainable development.7 During an initial pilot phase, the World Bank administered the GEF trust fund
and coordinated GEF activities. The formal voting structure for the organization during this time was an
egalitarian one-country, one-vote system. GEF projects were initially implemented by the World Bank, the
United Nations Development Programme (UNDP), or the United Nations Environment Programme (UNEP).
Funding for individual projects came from the GEF Trust Fund usually with additional financing provided
by the country in which the project would be located, the organization acting as the implementing agency,
and/or other foreign entities.
In 1994, the GEF was reconstituted as an independent international organization with a four-year funding
cycle. The formal voting system for the independent GEF became a double-majority regime in which more
than 60 percent of the states that are members of the GEF and states representing more than 60 percent of
total contributions given to the GEF over its history must vote to approve major decisions; the GEF itself
therefore combines the egalitarian and non-egalitarian models. Over the past 20 years, regional development
banks and other U.N. agencies have come to be included in the set of implementing agencies for GEF projects.
As of 2016, more than $13.5 billion in grants had been provided by the GEF trust fund, and the GEF
asserts that these grants have helped leverage $65 billion worth of cofinancing (Kotchen and Negi 2016).
Cofinancing began increasing after a 2003 revision of policies (Miller and Yu 2012).8
According to interviews with technocrats inside the GEF secretariat,9 cofinancing arrangements and
other project characteristics are largely decided in negotiations between the implementing agency and the
project country. One subject said that the GEF itself “remains quite removed from the process of project
development,” while the other two subjects spoke about project proposals arriving with proposed cofinancing
arrangements on which the GEF may provide comments (authors’ interviews, October 2018). The comments
by the interviewees reflect stated GEF policy: “The [Implementing] Agency prepares a project concept at
the request of and in consultation with relevant country institutions and other relevant partners” (Global
Environment Facility 2016, p. 10). As is true in other contexts where development agencies seek country
cofinancing, cofinancing is viewed as a sign of the project country’s commitment to the project (Over 1981;
Winters and Streitfeld 2018).
Because of this interest in understanding how GEF grants might catalyze funds from other sources,
several existing papers have studied the cofinancing activity in GEF projects. Both Miller and Yu (2012)
and Kotchen and Negi (2016) show that recipient-country cofinancing is higher in projects implemented
by the multilateral development banks, as compared to those implemented by U.N. agencies. The two
studies also show that projects classified as climate change projects attract more cofinancing and that the
proportion of project financing that comes from cofinancing is larger in projects that have larger overall
budgets. Kotchen and Negi (2016) find mixed results for whether or not quality of governance predicts
cofinancing. Looking at the e↵ects of cofinancing, Kotchen and Negi (2016) find that projects with greater
cofinancing are more likely to achieve a satisfactory rating.10
Bayer, Marcoux, and Urpelainen (2015) use data on GEF cofinancing to study the predictors of the
amount of GEF financing relative to total project costs. As described above, they argue that a country’s
bargaining power—conceptualized as the size of its economy—will positively predict the share of the project
that is funded by the GEF for projects where the World Bank is the implementer but not for projects with
other implementers.11 Controlling for total project size, whether or not a project is a climate-change project,
the level of corruption in the project country, whether or not the country is democratic, and region and year
fixed e↵ects, they find that GDP positively predicts the proportion of total project financing provided by
8Cofinancing policies were revised again in 2014 (Kotchen and Negi 2016) and 2018 (authors’ interviews, October 2018). 9At the time of the interviews, the subjects held the positions of Operations Analyst, Biodiversity Specialist, and
Environ-mental Specialist.
10For other examinations of the links between cofinancing and aid e↵ectiveness, see Shin et al. (2017) and Winters (2019). 11Although the authors sometimes characterize their study as being about “bargaining between the Global Environment
the GEF for GEF projects implemented by the World Bank, while the same relationship is small, negative,
and not significant for GEF projects implemented by other agencies. The authors interpret this as evidence
supportive of H1 in their paper: “The IO’s funding share is an increasing function of the recipient’s economic
strength. Ceteris paribus, this e↵ect is stronger for non-egalitarian than for egalitarian IOs” (Bayer et al.
2015, p. 1083)
The specification of the outcome measure used in Bayer, Marcoux, and Urpelainen (2015), however,
nor-malizes the amount of GEF funding by total project funding: the denominator includes not only cofinancing
from the aid-receiving country but also cofinancing from the international implementing agency and possibly
from other foreign sources as well.12 Whereas the authors interpret the positive correlation between GDP
and GEF financing as indicating that countries with larger economies obtain more GEF financing relative
to the amount of money that they contribute to the project (i.e., an increase in the numerator relative
to the denominator), we would observe the same correlation if countries with larger economies receive less
implementing agency financing relative to the amount of money that they contribute to the project for a
given level of GEF funding (i.e., a decrease in the denominator relative to the numerator). Given the way
that the outcome variable is specified in Bayer, Marcoux, and Urpelainen (2015), we do not know how the
overall external financing envelope relates to the amount of country cofinancing.13
In the following section, we describe how we have updated Bayer, Marcoux, and Urpelainen’s (2015)
replication data, and we present regression models that show that the proportion of external financing in
GEF projects is consistently decreasing in the size of a country’s economy. We also show that this rate of
decrease is indistinguishable across egalitarian and non-egalitarian GEF implementing agencies. We then
change the key explanatory variable to test the prediction that we present above: that a country’s level of
development will negatively predict the proportion of external financing in GEF projects. We find evidence
that this is so and show that the correlation is robust to a variety of specifications of the outcome variable and
the estimating equation. We then replicate these results among standard World Bank projects to show more
generally that the patterns of country cofinancing that we predict hold for this non-egalitarian institution. In
the concluding section, we discuss how these findings contribute to broader debates about how international
organizations operate and about the power of bureaucrats within such organizations.
12In the data that we analyze below, 1,217 out of 1,256 GEF projects for which we can identify cofinancing information have
funding from some source other than the GEF. Of those 1,217, 850 have funding from at least three sources: (1) the GEF, (2) the government of the country where the project takes place, and (3) one or more other international entities. In the Online Appendix to Bayer, Marcoux, and Urpelainen (2015), Tables A45 and A46 study the unnormalized amount of funding that countries receive from the GEF and show a positive correlation with GDP, which we also produce below in Model 5 of Table 3. 13Bayer, Marcoux, and Urpelainen (2015) note, “Sometimes recipients secure funding from third parties to cover their share
4
Data and Methods
The data used in Bayer, Marcoux, and Urpelainen (2015) contain information on 2,793 GEF projects
ap-proved between 1991 and 2011.14 For each of these projects, the dataset includes the GEF’s funding share:
a variable falling in the [0,100] interval, which the authors use as a dependent variable to measure bargaining
outcome. The dataset also indicates the implementing agency for each of the projects, which the authors
classify as being either the World Bank or another (presumably more egalitarian) agency through a binary
indicator variable.15
The main independent variable used in the original article is the logarithm of gross domestic product
(GDP), measured in constant 2000 dollars, which proxies for the bargaining power of recipient countries.
The data also include an indicator that equals one if the focal area of a GEF project is climate change. In
the original article, this variable proxies for the likely availability of private capital.16
Information on the characteristics and funding of GEF projects is retrievable from the GEF’s website,
which features a project database with individual pages for each GEF-sponsored project. On each project’s
web page, there are various pieces of information about the project: the recipient country, the implementing
agency, the focal area, and the total cost. The cost information is split into a GEF grant component
and a “cofinancing total” component. Bayer, Marcoux, and Urpelainen (2015) construct their dependent
variable—the GEF’s funding share—as the GEF grant component divided by the total cost. The financial
information found on each project page, however, may give an incomplete picture of the ratio of recipient
to international financing when used to calculate recipient contributions to projects in this way. The agency
that implements a GEF project often contributes to funding the project as well, meaning that the total
project cost information provided on the GEF website includes funding beyond that which is provided by
the GEF and the recipient country. In other words, the “cofinancing total” is both recipient cofinancing and
non-GEF international cofinancing.
For example, imagine a situation in which the GEF funds $4 million of a $10 million project. Following
14Of these 2,793 projects, Bayer, Marcoux, and Urpelainen (2015) exclude 538 projects from their analyses, as these projects
have a regional or global focus and therefore include multiple countries, such that they are not relevant to the study of bargaining between an international organization and a single state. The resulting dataset includes 2,255 projects, of three types: 964 full-size projects, 447 medium-size projects, and 844 enabling activities. The authors exclude small grants from the analysis “because the Global Environment Facility (GEF) administers them separately and the stakes are too low to test our two hypotheses” (2015, note 4).
15As noted above, in their Online Appendix, Bayer, Marcoux, and Urpelainen (2015) split the cases by development banks
and United Nations organizations and find stronger results (AP62-3). We estimate our main analyses with the World Bank versus non-World Bank distinction and show the results with the development bank versus United Nations distinction in Table A11 of the Online Appendix.
16The original paper proposes a second hypothesis: “The IO’s funding share is a decreasing function of the project’s ability
the operationalization strategy from Bayer, Marcoux, and Urpelainen (2015), we would calculate the GEF’s
funding share to be 0.4, and describe this as the IO’s funding share—implicitly interpreting the remaining
0.6 to be the recipient country’s share. Yet the total cofinancing amount (i.e., the total project cost devoid
of GEF funding) might consist of funding coming from a number of sources, including not only the recipient
country but also the implementing agency and other foreign actors (e.g., other countries’ international
development agencies). It might in fact be the case that the recipient country contributes less money than
the GEF does and that the implementing agency and other foreign actors cover the rest of the cofinancing
amount. If this were the case, it would be misleading to use the GEF’s funding share as the dependent
variable to assess the hypothesis that wealthier countries obtain more international financing relative to the
amount of money that they contribute to the project.
The example above is neither extreme nor uncommon: of the 1,256 projects that we analyze below,
908 of them involve funding from the implementing agency and/or other foreign sources. For instance, a
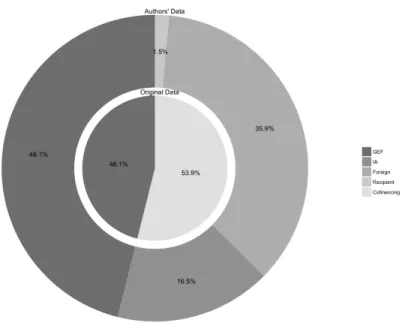
full-size project in Chad (GEF ID #1125) implemented by the United Nations has a total cost of $3,035,000.
The GEF grant is valued at $1.4 million, or about 46 percent of the total project cost. The $1,635,000
of cofinancing is split across $500,000 from the implementing agency (the United Nations Development
Programme); $1,090,000 from foreign sources (the European Union, the Government of France, and the
international nongovernmental organization CARE International); and only $45,000 from the Government
of Chad. The recipient country funds less than two percent of the total project cost. Using the GEF’s share
of 46 percent—rather than the total international share of 98 percent—to measure the bargaining outcome
would suggest that this was a “bad deal” for Chad, whereas the ratio of Chad’s contribution to the total
international contribution suggests that Chad had to put relatively little “skin in the game” in exchange for
the resources it was receiving.17
Accounting for the fact that actors other than the GEF and the recipient country contribute funding
to GEF projects is essential for understanding whether economically weaker countries are worse o↵ when
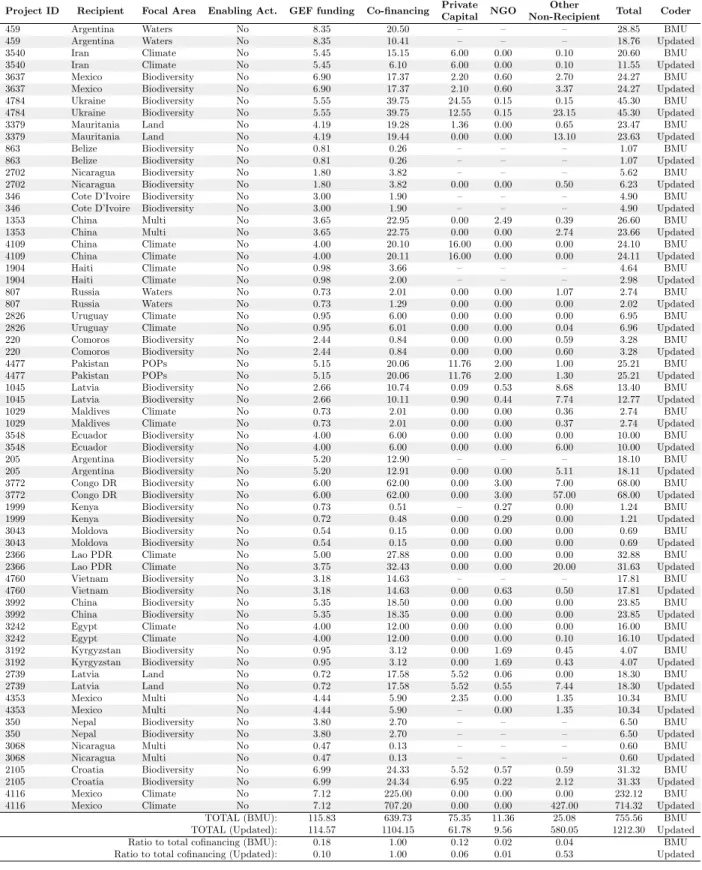
bargaining with non-egalitarian IOs. Therefore, we update the Bayer, Marcoux, and Urpelainen (2015)
replication data by breaking down the cofinancing into its various sources. We use the most up-to-date (as
of 2016) project document available on each project page on the GEF website to gather information about the
sources of cofinancing. We report amounts committed at the time when the project was approved—rather
than disbursed amounts—to more accurately reflect the outcome of the initial bargaining process.18
17As described in footnote 12 above, Bayer, Marcoux, and Urpelainen (2015) propose that other international financing
might be considered a component of recipient financing on the grounds that the recipient has acquired these resources to meet its financing obligations. In this particular case, the resources are most often coming from the very international development organization with which the recipient is negotiating, so they are, in fact, a core component of the bargain, not secondary resources that are obtained later to cover obligations previously committed to by the recipient.
Figure 1: Cofinancing Breakdown of GEF Project #1125
Starting from the original replication data set of 2,255 projects, we exclude from our analyses 844 projects
labeled as “enabling activities” as they are substantively di↵erent from the medium- and full-size projects
financed by the GEF. As noted above, Bayer, Marcoux, and Urpelainen (2015) exclude small projects from
their analysis because they argue that the GEF “administers them separately and the stakes are too low
to test our two hypotheses” (2015, note 4). Similarly, we argue that enabling-activity projects di↵er from
regular GEF projects in that they are typically funded almost entirely by a single GEF grant (i.e., there is
neither recipient nor international cofinancing) and are intended to aid in preparation for a potential project
or to help a country meet the requirements of an environmental treaty. Interviews with GEF technocrats
confirmed our understanding of enabling activities as fundamentally di↵erent from medium- and full-size
projects.19
We are left with a sample of 1,411 projects, of which 155 are dropped from our analysis because we
are unable to find accurate information to break down their cofinancing into its components. The dropped
projects are more likely to come from earlier years in the data, possibly due to changing attention to record
retention at the GEF.20 The subset of dropped projects splits into World-Bank-implemented projects and
19Enabling activities are much more formulaic than regular projects and are occasionally approved in blocks for a number
of countries. Examples include grants supporting the writing of a report or an assessment, the collecting or compiling of data, or the organizing of workshops and consultations.
20Records for older projects tend to include scanned versions of hard-copy documents. Records from older projects (e.g.,
non-World-Bank-implemented projects in a way that mirrors the rest of the sample.21 Although GEF funding
amounts and project costs both increase over time in our sample, the dropped projects do not appear to
present concerns for the robustness of our findings.22
Conversely, the average enabling activity project is in fact quite di↵erent from regular projects. The
size of the GEF funding share vis-`a-vis the cofinancing share for the average enabling activity project, as
compared to the average medium- and full-size project in our sample, is nearly flipped.23 Table 1 shows
descriptive statistics for the remaining 1,256 projects that enter our analyses.
Table 1: Descriptive Statistics for the Funding of the 1,256 Projects in Our Analysis
Total Project Cost
All WB Non-WB
Min. $200,000 $410,000 $200,000
Max. $1,363,400,000 $1,363,400,000 $339,466,000
S.D. $83,418,997 $129,768,250 $27,170,183
Mean $30,833,523 $57,509,926 $14,229,115
Median $10,060,000 $18,490,000 $7,270,000
GEF Grant GEF Share (%)
All WB Non-WB All WB Non-WB
Min. $150,000 $230,000 $150,000 1.07 0.75 1.07 Min.
Max. $60,000,000 $60,000,000 $20,200,000 100 100 100 Max.
S.D. $5,453,301 $7,667,732 $2,602,941 23.35 25.34 22.12 S.D.
Mean $4,448,521 $6,749,379 $2,942,976 35.59 33.64 37.45 Mean
Median $3,000,000 $5,000,000 $2,363,635 31.31 27.25 33.02 Median
IA Funding IA Share (%)
All WB Non-WB All WB Non-WB
Min. $0 $0 $0 0 0 0 Min.
Max. $349,000,000 $349,000,000 $141,000,000 94.67 93.75 94.67 Max.
S.D. $28,542,390 $43,347,199 $12,052,442 22.11 26.9 17.80 S.D.
Mean $7,715,928 $17,104,506 $2,474,167 12.26 19.17 8.40 Mean
Median $16,000 $0 $40,000 0.11 0 0.44 Median
Foreign Funding Foreign Share (%)
All WB Non-WB All WB Non-WB
Min. $0 $0 $0 0 0 0 Min.
Max. $959,400,000 $959,400,000 $100,000,000 87.56 87.56 82.54 Max.
S.D. $30,812,887 $50,692,723 $5,057,090 20.28 22.41 18.97 S.D.
Mean $4,318,621 $9,261,643 $1,558,869 12.75 14.08 12.01 Mean
Median $0 $0 $0 0 0 0 Median
Recipient Funding Recipient Share (%)
All WB Non-WB All WB Non-WB
Min. $0 $0 $0 0 0 0 Min.
Max. $695,000,000 $695,000,000 $328,493,000 97.63 95.74 97.63 Max.
S.D. $46,296,263 $71,237,173 $19,647,013 27.35 26.31 27.31 S.D.
Mean $14,350,452 $26,328,322 $7,663,056 39.40 33.14 42.90 Mean
Median $2,930,000 $3,705,000 $2,590,000 38.40 27.11 45.03 Median
External Funding External Share (%)
All WB Non-WB All WB Non-WB
Min. $200,000 $300,000 $200,000 2.37 4.26 2.37 Min.
Max. $1,229,500,000 $1,229,500,000 $150,670,000 100 100 100 Max.
S.D. $50,518,090 $79,552,840 $14,059,166 27.35 26.31 27.31 S.D.
Mean $16,483,070 $33,462,778 $7,003,086 60.60 66.86 57.10 Mean
Median $4,921,256 $11,195,000 $3,507,500 61.60 72.89 54.97 Median
21About 35.8 percent of projects in our sample are implemented by the World Bank, and about 36.3 percent of the projects
we drop are implemented by the World Bank (p <0.82).
22We replicated Models 3 and 4 from Table 3 below on the sample of projects for which cofinancing information was available,
and the results do not di↵er in substance or significance.
23The GEF contributes 15 percent on average to total project costs but 83 percent on average to the cost of enabling activities
4.1
Dependent Variables
In our analyses, we employ six related dependent variables. First, in order to replicate the results in Bayer,
Marcoux, and Urpelainen (2015), we begin by using the same dependent variable found in that article: the
proportion of total project financing provided by the GEF. We seek to verify that the substantive results
from the original article remain unchanged when the analysis is performed on our data.24
Second, we operationalize the outcome variable as a measure of the share of project funding provided by
all sources outside the recipient country (“external funding”). Insofar as we are interested in learning which
countries obtain better deals when bargaining with di↵erent types of international organizations, we want to
see which countries are able to obtain more external funding (i.e., from the GEF, the implementing agency,
and other foreign sources). Funding from the recipient country’s national and subnational governments, as
well as from other domestic sources, such as the private sector, NGOs, or project beneficiaries are considered
“recipient funding.”
Third, we look at the combined resources coming from the GEF and the implementing agency. Fourth,
we look only at the resources coming from the implementing agency. Fifth, we examine resources that come
from other foreign sources (i.e., international donors or non-governmental organizations that are not the
implementing agency or the GEF). Finally, we look at the recipient’s contribution to the project.
Table 1 and Figure 2 describe the distributions of these six dependent variables in the data, including
the subsamples of projects implemented by the World Bank or a non-World Bank agency. In both cases,
the majority of project funds for the average project come from external sources. When the World Bank
is the implementing agency, it provides about a quarter of project funding on average, whereas non-World
Bank agencies provide around 15 percent of project funding on average. When the World Bank is the
implementing agency, the recipient country provides approximately one-third of project funding on average,
whereas recipient countries provide over 40 percent of project funding on average when another agency is
the implementer.25 The average amount of funding coming from other foreign sources is similar across the
subsets (14 percent for World Bank projects and 12 percent for non-World Bank projects, p <0.10), and
the median project in either subset includes no other foreign funding at all.
24As discussed above, for our analyses, we will exclude enabling activities and code funding amounts directly from project
documentation.
Figure 2: Distribution of Main Dependent Variables (World Bank vs. Non-World Bank)
4.2
Independent Variables
To study the predictors of bargaining outcomes, we first follow Bayer, Marcoux, and Urpelainen (2015) in
operationalizing recipient countries’ bargaining power with log-transformed GDP in constant 2000 dollars.
Subsequently, we use recipient countries’ level of development as our key explanatory variable, measuring this
as log-transformed GDP per capita in constant 2000 dollars. As stated earlier, we expect poorer countries
to receive better bargains.
We use the same indicator variable as the original article to divide projects into those implemented by
a World Bank agency and those implemented by another agency. Additionally, we create another indicator
variable to divide projects into those implemented by any development bank (all of which have non-egalitarian
voting structures) and those implemented by a UN agency (all of which have egalitarian voting structures).
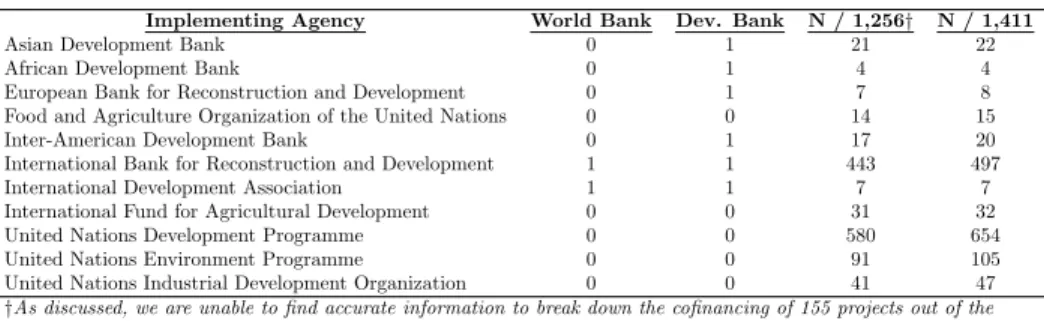
Table 2 presents a list of all implementing agencies in our sample and their classification under the
“World Bank” and “development bank” indicators; we list the number of projects in the data implemented
by each agency. Figure 3 shows the financing breakdown of the average project implemented by the World
breakdown of the average project implemented by a development bank (World Bank or otherwise) versus
that of the average project implemented by a UN agency. Note that on average, projects that are not
implemented by the World Bank—and in particular, projects implemented by a UN agency—tend to receive
a greater share of financing from the recipient country and a smaller share from the implementing agency.
Following the model specification in Bayer, Marcoux, and Urpelainen (2015), we also include an indicator
to identify projects whose focal area is climate change; we control for total project cost, political corruption
(operationalized by the ICRG measure), and political institutions in the recipient country (operationalized
with the Democracy and Dictatorship coding from Cheibub, Gandhi, and Vreeland (2010)); and we include
year and region fixed e↵ects in all regression models.
Table 2: Classification of Implementing Agencies
Implementing Agency World Bank Dev. Bank N / 1,256† N / 1,411 Asian Development Bank 0 1 21 22 African Development Bank 0 1 4 4 European Bank for Reconstruction and Development 0 1 7 8 Food and Agriculture Organization of the United Nations 0 0 14 15 Inter-American Development Bank 0 1 17 20 International Bank for Reconstruction and Development 1 1 443 497 International Development Association 1 1 7 7 International Fund for Agricultural Development 0 0 31 32 United Nations Development Programme 0 0 580 654 United Nations Environment Programme 0 0 91 105 United Nations Industrial Development Organization 0 0 41 47
†As discussed, we are unable to find accurate information to break down the cofinancing of 155 projects out of the 1,411 full- and medium-size projects in the original sample. We are left with 1,256 projects to analyze.
5
Analyses and Results
Our analysis begins with a replication of the main model specification in Bayer, Marcoux, and Urpelainen
(2015) and then goes on to revise and expand on it in a number of consequential ways. There are three key
elements of our analyses that are worth highlighting before discussing the results. First,we use several
opera-tionalizations of the outcome variable to capture the results of the bargaining over project funding. We start
by following Bayer, Marcoux, and Urpelainen (2015) in using the GEF share of total project cost (GEF/Total) as the outcome variable in Models 1-6. However, as discussed, this variable alone is not informative about
the amount of funding that all of the international organizations involved in a project provide, as sources
other than the GEF usually provide some project funding. Thus, we also use the share of all non-recipient
funding (External/Total) as the outcome variable in Models 7-8, as well as the share of funding provided by the two main international organizations, the GEF and the implementing agency (GEF+IA/Total), and then each individual funding source’s share (IA/Total;Foreign/Total;Recipient/Total) in Models 9-16. This allows us to gain insight into how each funder’s share of the total project cost is a↵ected by recipient wealth.
Second, each model is estimated separately for projects with the World Bank as the implementing agency
(the top panels of Tables 3 and 4) and projects with an implementing agency other than the World Bank
(the central panels of Tables 3 and 4), again following the original paper. We also estimate all of our models
on the full sample of projects using an interaction term to test whether the slope on GDP varies between
projects implemented by the World Bank and by non-World Bank agencies (the bottom panels of Tables
3 and 4). Third, we repeat the analyses with the substitution of GDP per capita for GDP as the measure
of the key recipient-country characteristic predicting the financing breakdown (all even-numbered Models
2-16). We argue that sta↵ in international development organizations negotiating projects are more likely
to pay attention to a country’s level of wealth rather than to the overall size of its economy.
All models are ordinary-least squares regressions with standard errors clustered by country to account
for the fact that a single country can have multiple projects within the dataset. As mentioned above, all
models include year fixed e↵ects and region fixed e↵ects.
Table 3 reports the result of the first set of analyses. Model 1 replicates the results from Bayer, Marcoux,
and Urpelainen’s third OLS model (2015: 1093). It is estimated using their dataset and their variables and
replicates their results exactly. Models 3 and 5 share the same specification as Model 1 but are estimated
using our data set of 1,411 projects described above. While Model 3 is limited to the projects in our dataset,
it uses the variables from Bayer, Marcoux, and Urpelainen’s (2015) replication dataset to measure the GEF’s
funding share, the World Bank indicator, and the total project costs.26
26The GEF share variable in the replication data set has missing data for four projects which we were able to code; this
Table 3: E↵ect of Recipient Wealth on GEF and External Share of Project Cost
Model Set: (1) (2) (3) (4) (5) (6) (7) (8)
Dependent Variable: GEF / GEF / GEF / GEF / GEF / GEF / External / External /
Total Total Total Total Total Total Total Total
Data Set: BMU BMU Mixed† Mixed† Updated Updated Updated Updated Wealth Measure: GDP GDPpc GDP GDPpc GDP GDPpc GDP GDPpc
WB Subsample
GDP 2000 (log) 1.246** 1.409** 1.206** -3.621***
(0.470) (0.447) (0.417) (0.779)
GDPpc 2000 (log) 0.700 0.976 1.114 -9.157***
(1.246) (1.104) (0.999) (1.774)
Climate Project -3.079 -3.189 -4.249* -4.427* -5.506* -5.704* -9.287** -8.556* (1.883) (1.858) (1.751) (1.722) (2.305) (2.291) (3.419) (3.380)
Project Cost (log) -11.12*** -10.87*** -9.730*** -9.459*** -10.30*** -10.05*** -1.507 -2.159* (0.538) (0.528) (0.599) (0.592) (0.765) (0.762) (1.018) (0.996)
Observations 416 416 390 390 394 394 354 354
R2 0.746 0.741 0.670 0.662 0.633 0.629 0.280 0.287
Non-WB Subsample
GDP 2000 (log) -0.179 0.491 1.333** -3.465***
(0.424) (0.407) (0.394) (0.799)
GDPpc 2000 (log) -1.624** -1.323 -0.692 -9.082***
(0.562) (0.747) (0.869) (1.364)
Climate Project 0.694 0.643 -2.560* -2.465* -3.461** -3.253** -11.51*** -11.39*** (0.909) (0.908) (1.128) (1.128) (1.143) (1.139) (2.767) (2.763)
Project Cost (log) -12.33*** -12.31*** -10.38*** -10.16*** -11.64*** -11.23*** -4.557*** -5.105*** (0.283) (0.278) (0.424) (0.420) (0.517) (0.524) (1.205) (1.170)
Observations 1079 1079 589 589 589 589 537 537
R2 0.832 0.833 0.664 0.665 0.610 0.604 0.290 0.305
Full Sample
GDP 2000 (log) -0.305 0.422 1.049* -3.422***
(0.422) (0.440) (0.427) (0.765)
GDPpc 2000 (log) -1.807** -1.669* -0.858 -9.000***
(0.563) (0.693) (0.760) (1.230)
WB Project -47.13*** -19.07*** -23.80* -19.12** -9.041 -10.79 17.50 16.79 (8.888) (5.557) (10.01) (5.942) (9.873) (6.182) (17.38) (9.290)
GDP 2000 (log) * WB 1.913*** 1.010* 0.461 -0.290
(0.366) (0.406) (0.399) (0.712)
GDPpc 2000 (log) * WB 2.576** 2.778** 1.794* -0.959
(0.823) (0.857) (0.867) (1.307)
Climate Project -0.115 -0.0580 -3.045*** -3.079*** -4.189*** -4.212*** -10.41*** -10.08*** (0.731) (0.726) (0.878) (0.835) (1.093) (1.085) (1.883) (1.819)
Project Cost (log) -12.08*** -12.01*** -10.06*** -9.768*** -10.95*** -10.59*** -3.014*** -3.604*** (0.253) (0.255) (0.363) (0.353) (0.383) (0.397) (0.658) (0.656)
Observations 1495 1495 979 979 983 983 891 891
R2 0.825 0.825 0.638 0.637 0.597 0.592 0.279 0.291 *p-value<0.05, **p-value<0.01, ***p-value<0.001. Standard errors in parenthesis.
All models include region and year fixed e↵ects, and control for democracy and corruption.
†Dependent variables, World Bank indicator, and total project cost are from BMU’s data; sample of projects is authors’. The authors coded GEF share information for 4 additional projects compared to BMU’s variables. This explains the discrepancy in observations in Models 3-4 versus Models 5-6. Of the 983 projects for which covariates are available, the authors were unable to code cofinancing breakdown information for 92 (of which 40 WB projects and 52 non-WB projects). This explains the discrepancy in the number of observations in Models 5-6 versus Models 7-16. When Models 5-6 are estimated on the same sample as Models 7-16 (891 projects, of which 354 WB projects and 537 non-WB projects) as a robustness check, the results remain substantively unchanged.
Conversely, Model 5 uses our re-coded version of the project cost variables but retains the proportion of
GEF funding in total project funding as the outcome variable.27
Models 3 and 5 largely replicate the main finding from Bayer, Marcoux, and Urpelainen (2015): for
projects with the World Bank as implementer, the proportion of project financing provided by the GEF as
a share of total project costs increases with the size of the recipient country’s economy. In Model 5 (where
we use our updated coding of the funding totals on our smaller sample of projects), however, we find this
same relationship for projects with non-World Bank implementers, and the partial correlation between GDP
and the share of GEF funding in the project is roughly equal for both subsamples. While the results of
Model 3 indicate that reducing the sample to exclude enabling activities does not meaningfully a↵ect the
key relationship, the results of Model 5 indicate that our recoding of the GEF share, World Bank project
indicator, and total project cost does significantly change the observed partial correlation between GDP and
GEF share for non-World Bank projects.
Models 2, 4, and 6 mirror the specifications of Models 1, 3, and 5, respectively, but substitute GDP
per capita for GDP as the main explanatory variable. In this case, even when we otherwise use the same
specification, data, and variables as the original Bayer, Marcoux, and Urpelainen (2015) analyses, we do not
find evidence that more developed countries enter into GEF projects where GEF financing makes up a larger
proportion of the total project costs (Model 2). In the non-World Bank subset, Model 2 provides evidence
that more developed countries receive less GEF financing for similarly sized projects, although the similarly
negative coefficient is not significant in Models 4 and 6.
As discussed above, the outcome variable in Models 1-6 (GEF/Total) does not di↵erentiate non-GEF external funding from recipient-country funding in accounting for total project costs. Therefore, in Models
7-8, we modify the outcome variable to focus on the share of external funding (i.e., all funding that does not
come from the recipient country) in the project. In these specifications, we do not find evidence that countries
with larger (Model 7) or more developed (Model 8) economies receive a greater share of external funding when
bargaining with a non-egalitarian organization. On the contrary, as the recipient country becomes wealthier
or more developed, the proportion of funding secured from sources external to the country decreases.
This finding holds regardless of the type of implementing organization. Specifically, as shown in Model
7, doubling a country’s GDP results in a decrease in the proportion of external funding by 3.6 percentage
points when the World Bank is the implementing agency. When looking among projects implemented by a
non-World Bank agency, doubling a country’s GDP results in a decrease in the proportion of external funding
by an extremely similar 3.5 percentage points. Analogously, Model 8 shows that doubling a country’s GDP
per capita results in a decrease in the proportion of external funding by 9.2 percentage points when the
World Bank is the implementing agency and by 9.1 percentage points when the implementer is not a World
Bank agency.
The bottom panel of Table 3 reports the results of the same eight models, now using an interaction
term. Confirming the results from the top two panels, the interaction term is only significant in the models
using the GEF share of project financing as the outcome variable. Once we shift to studying all external
project funding in Models 7-8, the size of a recipient country’s economy or its level of economic development
alters the bargaining outcome by decreasing the project funding share that the recipient is able to secure
from external sources. Consistent with our second hypothesis, this finding holds regardless of what type
of organization implements the project (i.e., the interaction term is not distinguishable from zero in these
models). In other words, when using a specification of the outcome variable that more adequately captures
the diverse origins of a GEF project’s funding package, we find consistent evidence that (i) as either the
size of a country’s economy or its level of development increases, the level of external financing relative to
country cofinancing decreases, and (ii) it does so regardless of whether the project is implemented by the
World Bank or by a non-World Bank organization.
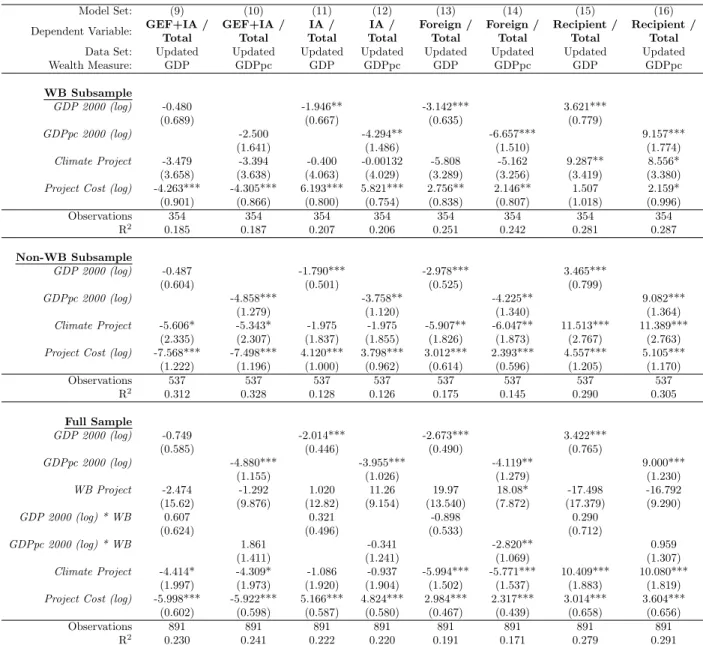
Table 4 reports the results of model specifications with outcome variables that specifically capture funding
from each source: the two prominent international organizations involved in each project, i.e. the GEF and
the implementing agency (Models 9-10); the implementing agency or agencies alone (Models 11-12); all
other foreign sources (Models 13-14); and all recipient sources (Models 15-16). These model specifications
are estimated on the sample of all medium- and full-size projects for which we are able to code cofinancing
information and for which covariates are available. Models 9-10 do not show evidence that the share of
project costs paid by the GEF and the main implementing agency increases as recipient wealth increases.
On the contrary, the coefficients representing the e↵ect of either the size (GDP) or level of development
(GDP per capita) of the recipient country’s economy suggest a negative relationship. The coefficients for
the interaction terms in the full-sample estimations of Models 9-10 are also not significant.
Moreover, recipient economy size and level of development are negatively related to the share of total
project costs provided by either the implementing agency alone or by any other foreign sources—with
sta-tistically significant negative coefficients across both types of implementer (Models 10-14). In the analyses
interacting the key explanatory variable and the implementer type, we again find evidence of a negative and
significant e↵ect of recipient wealth and an interaction term that cannot be distinguished from zero.28
Con-versely, recipient GDP and GDP per capita appear to have a positive and significant e↵ect on the funding
share provided by the recipient country itself, again regardless of implementer type (Models 15-16).
28The interaction term in Model 14 seems to indicate that when more developed recipients bargain with the World Bank
Table 4: E↵ect of Recipient Wealth on Each Funder’s Share of Project Cost
Model Set: (9) (10) (11) (12) (13) (14) (15) (16)
Dependent Variable: GEF+IA / GEF+IA / IA / IA / Foreign / Foreign / Recipient / Recipient /
Total Total Total Total Total Total Total Total
Data Set: Updated Updated Updated Updated Updated Updated Updated Updated
Wealth Measure: GDP GDPpc GDP GDPpc GDP GDPpc GDP GDPpc
WB Subsample
GDP 2000 (log) -0.480 -1.946** -3.142*** 3.621***
(0.689) (0.667) (0.635) (0.779)
GDPpc 2000 (log) -2.500 -4.294** -6.657*** 9.157***
(1.641) (1.486) (1.510) (1.774)
Climate Project -3.479 -3.394 -0.400 -0.00132 -5.808 -5.162 9.287** 8.556*
(3.658) (3.638) (4.063) (4.029) (3.289) (3.256) (3.419) (3.380)
Project Cost (log) -4.263*** -4.305*** 6.193*** 5.821*** 2.756** 2.146** 1.507 2.159*
(0.901) (0.866) (0.800) (0.754) (0.838) (0.807) (1.018) (0.996)
Observations 354 354 354 354 354 354 354 354
R2 0.185 0.187 0.207 0.206 0.251 0.242 0.281 0.287
Non-WB Subsample
GDP 2000 (log) -0.487 -1.790*** -2.978*** 3.465***
(0.604) (0.501) (0.525) (0.799)
GDPpc 2000 (log) -4.858*** -3.758** -4.225** 9.082***
(1.279) (1.120) (1.340) (1.364)
Climate Project -5.606* -5.343* -1.975 -1.975 -5.907** -6.047** 11.513*** 11.389***
(2.335) (2.307) (1.837) (1.855) (1.826) (1.873) (2.767) (2.763)
Project Cost (log) -7.568*** -7.498*** 4.120*** 3.798*** 3.012*** 2.393*** 4.557*** 5.105***
(1.222) (1.196) (1.000) (0.962) (0.614) (0.596) (1.205) (1.170)
Observations 537 537 537 537 537 537 537 537
R2 0.312 0.328 0.128 0.126 0.175 0.145 0.290 0.305
Full Sample
GDP 2000 (log) -0.749 -2.014*** -2.673*** 3.422***
(0.585) (0.446) (0.490) (0.765)
GDPpc 2000 (log) -4.880*** -3.955*** -4.119** 9.000***
(1.155) (1.026) (1.279) (1.230)
WB Project -2.474 -1.292 1.020 11.26 19.97 18.08* -17.498 -16.792
(15.62) (9.876) (12.82) (9.154) (13.540) (7.872) (17.379) (9.290)
GDP 2000 (log) * WB 0.607 0.321 -0.898 0.290
(0.624) (0.496) (0.533) (0.712)
GDPpc 2000 (log) * WB 1.861 -0.341 -2.820** 0.959
(1.411) (1.241) (1.069) (1.307)
Climate Project -4.414* -4.309* -1.086 -0.937 -5.994*** -5.771*** 10.409*** 10.080***
(1.997) (1.973) (1.920) (1.904) (1.502) (1.537) (1.883) (1.819)
Project Cost (log) -5.998*** -5.922*** 5.166*** 4.824*** 2.984*** 2.317*** 3.014*** 3.604***
(0.602) (0.598) (0.587) (0.580) (0.467) (0.439) (0.658) (0.656)
Observations 891 891 891 891 891 891 891 891
R2 0.230 0.241 0.222 0.220 0.191 0.171 0.279 0.291
*p-value<0.05, **p-value<0.01, ***p-value<0.001. Standard errors in parenthesis. All models include region and year fixed e↵ects, and control for democracy and corruption.
Of the 983 projects for which covariates are available, the authors were unable to code cofinancing breakdown information for 92 (of which 40 WB projects and 52 non-WB projects). This explains the discrepancy in the number of observations in Models 5-6 versus Models 7-16. When Models 5-6 are estimated on the same sample as Models 7-16 (891 projects, of which 354 WB projects and 537 non-WB projects) as a robustness check, the results remain substantively unchanged.
In other words, wealthier, more developed recipients enter into GEF projects that feature smaller funding
shares from the implementing agency and from other foreign sources; they cover larger proportions of the
project with domestic resources. Taken together, our analyses of the updated data support our understanding
that development organizations provide better deals to less economically prosperous countries, and we do
not find di↵erential e↵ects for GEF projects implemented by egalitarian and non-egalitarian agencies.29
29In the Online Appendix, we show that these results hold when splitting the sample into projects implemented by
In order to provide a more intuitive understanding of what these results mean for the profiles of GEF
projects for di↵erent types of countries, Figure 4 shows the predicted values of the funding shares from
di↵erent sources for countries at the 25th and 75th percentile of GDP and GDP per capita, for World Bank
and non-World Bank projects.30 What emerges is that wealthy countries, at the 75th percentile of GDP and
GDPpc, are predicted to provide a greater share of total project costs than countries at the 25th percentile.
Conversely, both wealthy and poor countries provide a greater funding share when projects are implemented
by a non-World Bank agency than they do when projects are implemented by the resource-rich World Bank.
Figure 4: Predicted Funding for Recipients at the 25th and 75th Percentile of GDP and GDP Per Capita
In the Online Appendix, we conduct additional analyses to explore the consistency of the results. Since
the outcome variables in Tables 3 and 4 are proportions bounded by 0 and 1, OLS may not be appropriate.
In Tables A3 and A4, we replicate the analyses using fractional logistic regression models: all of the results
hold under this alternative modeling strategy. In Table A6, we use compositional data models with log-ratio
outcome variables, which better capture the trade-o↵s across di↵erent components of a whole (Aitchison
1986; Winters and Martinez 2015). These models consistently show that GDP and GDP per capita both
30The model specifications used to compute the predicted values are Models 5-6 in Table 3 for the GEF’s share and Models
negatively predict the amount of external funding (operationalized in all five di↵erent ways) relative to the
amount of recipient funding for both World Bank and non-World Bank implementing agencies. Because the
compositional data models force us to drop observations where one component has a zero value, we also run
a set of models where we add a small number to the zero values, largely confirming the results of the original
compositional data models.
In Table A10, we present models regressing log-transformed recipient funding on recipient GDP and GDP
per capita, controlling for external funding and total project cost. We find that recipient funding increases
as recipients get wealthier or more economically developed, regardless of implementing agency. Finally, in
Table A11, we compare development banks to U.N. agencies; as described above, this division of the data
continues to suggest that egalitarian and non-egalitarian organizations operate in the same fashion, arranging
less international funding for wealthier countries.
Taken together, the results of the analyses presented in this section and the robustness checks outlined
in the Online Appendix challenge the idea that wealthier, more developed countries are able to extract more
from non-egalitarian international organizations when bargaining over the funding of GEF projects. On the
contrary, we find compelling evidence that countries with lower GDP and GDP per capita get a greater
share of their GEF project costs provided by the international organizations involved in the project and
other external sources––regardless of international organization type.
6
The Division of Project Financing in Standard WB Projects
In the analyses just presented, we study the division of financing within Global Environment Facility projects,
where funding comes from the GEF and often also from the implementing agency and the country in which
the project is being executed and sometimes from other international financing sources. In this section, we
make use of data from Winters and Streitfeld (2018) about the division of financing within standard World
Bank projects (i.e., projects that draw on the resources of the International Development Association (IDA)
and/or the International Bank for Reconstruction and Development (IBRD) and not primarily on trust funds
or special facilities like the GEF) to see whether the claim from Bayer, Marcoux, and Urpelainen (2015)
that non-egalitarian institutions demand more financing from economically weaker countries finds support
in this data.
Above, we have argued that we do not expect decisions at the level of development project design to
vary with the egalitarian or non-egalitarian voting structure of international development organizations.
Conversely, if it is the case that institutions with non-egalitarian voting rules discriminate in their financing
World Bank projects that are not mediated by GEF procedures, given that the World Bank is the archetypal
example of an international development organization with a non-egalitarian voting structure.
The Winters and Streitfeld (2018) dataset contains financing information for 4,307 World Bank projects
approved during the 1999-2016 period. For projects approved between 1999 and 2010, those authors manually
coded the financing information from Project Appraisal Documents or other project documentation, and for
projects approved between 2011 and 2016, the authors used a web-scraping tool to retrieve the information
from the online portal to the World Bank Projects and Operations Database. The authors code the financing
information for each project into whether the source is the World Bank, another international development
agency, or an entity within the recipient country. We study two key outcome variables: the proportion
of World Bank financing in total project costs and the proportion of external financing in total project
costs. For comparability, we use specifications similar to those found above in the analyses of GEF project
funding. We estimate an initial set of linear regression models in which we regress the outcome variables on
log-transformed GDP PPP, controlling for the log-transformed total project cost, a measure of democracy,
a measure of corruption, and region and year fixed e↵ects.31 We then estimate a second set of models in
which we substitute log-transformed GDP per capita PPP as a measure of level of development in place of
the measure of the size of the economy. Table 5 presents the results of these analyses.
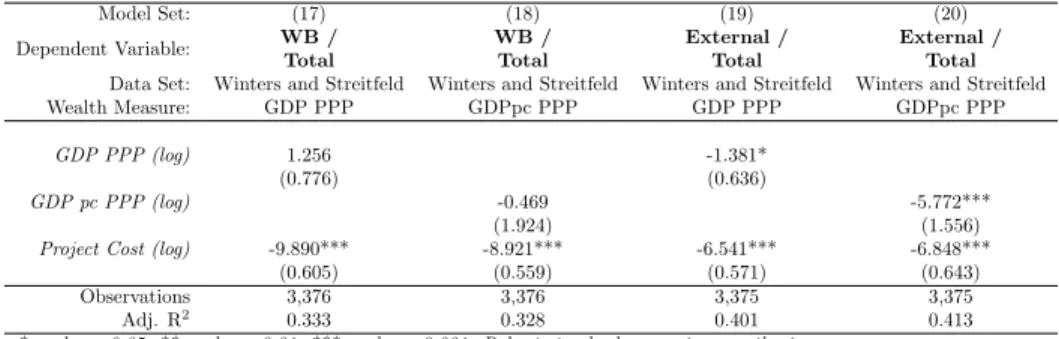
In Model 17, there is a positive but not statistically significant relationship between the size of a country’s
economy and the overall proportion of project funding that comes from the World Bank. In Model 19,
however, when we look at all external funding, the relationship becomes negative and statistically significant:
external funding makes up a smaller proportion of project financing in countries with larger economies. When
we study a country’s level of development (GDP per capita), instead of the size of its economy (GDP), in
Models 18 and 20, we see the same relationship as observed in the set of analyses of GEF projects: as countries
become wealthier, the proportion of total project costs financed by external actors becomes smaller (although
the relationship is not significant when looking only at the proportion of project financing coming from
the World Bank), and the ratio of external financing to recipient-country financing is decreasing (whether
looking only at World Bank financing or at overall external financing).32 Once again, this is evidence that
international development organizations, including even the World Bank with its non-egalitarian voting
structure, favor less economically developed countries at the level of project design.
31We measure democracy here using the Polity index, and we measure corruption using the control of corruption measure
from the Worldwide Governance Indicators. We choose these measures, as compared to those used above, because of the greater temporal coverage.
32Breaking down projects by whether they are administered by the World Bank’s concessional lending wing, the
Table 5: E↵ect of Recipient Wealth on Bargaining Outcome for World Bank Projects
Model Set: (17) (18) (19) (20) Dependent Variable: WB / WB / External / External /
Total Total Total Total Data Set: Winters and Streitfeld Winters and Streitfeld Winters and Streitfeld Winters and Streitfeld Wealth Measure: GDP PPP GDPpc PPP GDP PPP GDPpc PPP
GDP PPP (log) 1.256 -1.381*
(0.776) (0.636)
GDP pc PPP (log) -0.469 -5.772***
(1.924) (1.556)
Project Cost (log) -9.890*** -8.921*** -6.541*** -6.848*** (0.605) (0.559) (0.571) (0.643) Observations 3,376 3,376 3,375 3,375
Adj. R2 0.333 0.328 0.401 0.413 *p-value<0.05, **p-value<0.01, ***p-value<0.001. Robust standard errors in parenthesis.
All models include region and year fixed e↵ects, and control for democracy and corruption.
Parallel to the set of robustness checks we conduct for the analyses of GEF projects, we present additional
analyses of these World Bank data in the Online Appendix. In Table A5, we replicate the specifications
in Table 5 using fractional logistic regression models (Table A5) and find that the results hold under this
alternative modeling strategy. In Table A8, we use the log-ratio of World Bank financing relative to
recipient-country financing, and the log-ratio of external financing relative to recipient-recipient-country financing as outcome
variables; we find that the size of a country’s economy is an insignificant (but still negative) predictor of the
log-ratio of World Bank funding to recipient-country funding and is a negative and significant predictor of
the log-ratio of external funding to recipient-country funding. When we re-estimate these models adding a
small number to the zero values, so as not to drop the observations where one component of the ratio has a
zero value, we largely confirm the results of the original compositional data models.
Focusing on a sample of World Bank projects does not allow us to speak to how the non-egalitarian
World Bank compares to an egalitarian international development organization, such as the United Nations
Development Programme. In other words, it might be the case that an egalitarian organization will favor
poorer, less economically developed countries in project design to an even greater extent than the World
Bank does. What this analysis does highlight is the lack of evidence for the claim that wealthier, more
developed recipients are able to strike better deals than their poorer counterparts when bargaining with the
quintessential non-egalitarian international development organization, the World Bank.
7
Discussion
Having found that both GEF and World Bank projects involving smaller or poorer countries involve more
external financing relative to financing provided by the country where the project takes place, we now consider
three issues that will help to situate these results: (i) the role of concessional and non-concessional loans in