Initial Clinical Experience with
Stationary Digital Breast
Tomosynthesis
Yueh Z. Lee, MD, PhD, Connor Puett, BS, Christina R. Inscoe, PhD, Beilin Jia, MS, Connie Kim, MD,
Ruth Walsh, MD, Sora Yoon, MD, Suk Jung Kim, MD, Cherie M. Kuzmiak, MD, Donglin Zeng, PhD,
Jianping Lu, PhD, Otto Zhou, PhD
Abbreviations
BIRADS Breast Imaging Reporting and Data System
DBT digital breast tomosynthesis
sDBT stationary digital breast tomosynthesis
ROC receiver operating characteristic
AUC area under the receiver opera-tor characteristic curve
RationaleandObjectives:Alineararrayofcarbonnanotube-enabledx-raysourcesallowsfor station-ary digitalbreasttomosynthesis(sDBT),duringwhichprojectionviewsarecollectedwithouttheneedto move thex-raytube.Thisworkpresentsourinitial clinicalexperiencewithafirst-generation sDBT device.
MaterialsandMethods:Followinginformedconsent,womenwitha “suspiciousabnormality” (Breast ImagingReportingandDataSystem4),discoveredbydigitalmammographyandawaitingbiopsy,were alsoimagedbythefirstgenerationsDBT. Fourradiologistsparticipatedinthispaired-imagestudy, completingquestionnaireswhileinterpretingthemammogramsandsDBTimagestacks.Areasunder thereceiveroperatingcharacteristiccurvewereusedtomeasurereaderperformance(likelihoodof cor-rectly identifying malignancy based on pathology as ground truth), while a multivariate analysis assessedpreference,asreaderscomparedonemodalitytothenextwheninterpretingdiagnostically importantimagefeatures.
Results:Findingsfrom43womenwereavailableforanalysis,inwhom12casesofmalignancywere identifiedbypathology.Themeanareasunderthereceiveroperatingcharacteristiccurvewassignifi -cantlyhigher(p <0.05)forsDBTthanmammographyforallbreastdensitycategoriesandbreast thick-nesses.Additionally,readerspreferredsDBTovermammographywhenevaluatingmassmarginsand shape, architectural distortion, and asymmetry, but preferred mammography when characterizing microcalcifications.
Conclusion:ReaderspreferredsDBTovermammographywheninterpretingsoft-tissuebreastfeatures andwerediagnosticallymoreaccurateusingimagesgeneratedbysDBTinaBreastImagingReporting andDataSystem4population.However,thefindingsalsodemonstratedtheneedtoimprove microcal-cification conspicuity,whichisguidingbothtechnologicalandimage-processingdesignchangesin futuresDBTdevices.
KeyWords:Stationarydigitalbreasttomosynthesis;Digitalmammography;3Dmammography;Breast cancerimaging.
INTRODUCTION
O
n average, a woman in the United States has a greater than 10% lifetime risk of being diagnosed with breast cancer (1). Early detection of breast cancer through mammography screening reduces breast cancer mortality by 40% (2), since women with screen-detected can-cers benefit more from therapy than do women with cancers detected clinically (3). However, since standard mammogra-phy collapses the 3D anatomy into a 2D image, overlapping features can hide diagnostic clues or mimic concerning pat-terns. This is especially true in“dense”breast tissue, which is associated with a higher risk of cancer presence (4). As such,AcadRadiol2019;26:1363 1372
From the Department of Radiology, University of North Carolina at Chapel Hill, 101 Manning Drive, Chapel Hill, NC 27514 (Y.Z.L., C.M.K.); Department of
Bio-medicalEngineering,UniversityofNorthCarolinaatChapelHill,152MacNider
Hall CB7575, Chapel Hill, NC 27599 (Y.Z.L., C.P.); Department of Applied
Physical Sciences, University of North Carolina at Chapel Hill, Chapel Hill,
North Carolina (C.R.I.); Department of Biostatistics, University of North
Caro-lina at Chapel Hill, Chapel Hill, North CaroCaro-lina (B.J., D.Z.); Department of Radi-ology, Duke University, Durham, North Carolina (C.K., R.W., S.Y.); Department
of Radiology, Haeundae Paik Hospital, Inje University College of Medicine,
Busan,South Korea (S.J.K.); Department of Physics and Astronomy, University
of North Carolina at Chapel Hill,Chapel Hill, North Carolina (J.L., O.Z.).
Received September 8, 2018; revised December 26, 2018; accepted
Decem-ber27,2018.Addresscorrespondenceto:Y.Z.L.
e-mail: [email protected]
the false negative rate of the mammogram averages 20% (5), resulting in missed and delayed diagnosis, while the cumulative probability for a false positivefinding ranges from 30% to 70% (6), largely dependent on breast density, resulting in call-backs for additional testing.
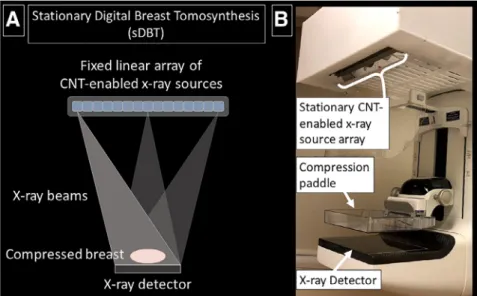
Digital breast tomosynthesis (DBT) was approved as a screening tool in 2011 for combined use with standard 2D mammography (7,8). All commercially available DBT devi-ces work by moving a single x-ray tube to collect a series of projection views at multiple angles relative to the compressed breast. Computer algorithms then mathematically reconstruct a quasi-3D image, which allows readers to visualize structures through depth, thereby reducing the problem of superposi-tion with 2D mammography. By 2014, approximately 30% of breast imaging clinics in the United States offered DBT, growing to 65% by 2016 (9). In 2016, about one-third of all screening evaluations included DBT, at which time a stan-dard mammogram was also obtained in most cases (9). How-ever, since combined imaging doubles the radiation dose and increases cost, work continues to improve DBT, with a goal of eliminating the need to collect a standard mammogram at the same time. Both technological and image processing advances are being made. For example, synthetic mammog-raphy uses forward-projection algorithms to integrate the information in the 3D image stack into a single 2D image, potentially replacing the standard mammogram. Additionally, technological innovations seek to minimize the limitations imposed by the need to move the standard x-ray source through space to collect the projection views. For example, continuous source motion introduces focal spot blurring, lim-iting the translational speed of the x-ray source and thus the achievable angle-span, while step-and-shoot takes longer, increasing the chance of patient motion. Motion during acquisition degrades image resolution (10 12). Stationary DBT (sDBT) is a novel imaging approach in which the single moving x-ray source has been replaced by a fixed array of multiple sources made possible by carbon nanotube (CNT) technology (13).
Standard x-ray tubes generate the electrons needed for x-ray production by heating a metal filament. In contrast, CNT cathodes release electrons at room temperature in response to an applied voltage, allowing for a fast and easily coordinated x-ray production by multiple individual sources. As such, arrays of CNT-enabled sources can be used to col-lect projection views over a wide-angle span quickly and without motion. Although sDBT is still considered experi-mental, CNT-enabled medical imaging devices have now been operational for years in human studies across a broad range of applications (14,15).
This study provides the first quantitative assessment of sDBT in humans, comparing its performance to digital mam-mography in women with known breast lesions of concern. Thefindings with thisfirst-generation device will guide con-tinued software and hardware development, as future studies seek to contextualize the potential screening and diagnostic value of sDBT compared to conventional DBT.
MATERIALS AND METHODS
Subject Selection and Demographics
This IRB-approved and HIPAA-compliant prospective study (ClinicalTrials.gov NCT01773850) recruited adult women discovered to have a“suspicious abnormality”(Breast Imag-ing ReportImag-ing and Data System [BIRADS] 4) (16) by stan-dard screening digital mammography at our Breast Imaging Clinic between May 2014 and February 2016.
Image Acquisition
The sDBT device was a modified Selenia Dimensions DBT system (Hologic Inc., Marlborough, Massachusetts) in which the standard single x-ray source was replaced by afixed array of CNT-enabled x-ray sources (Fig 1) (13). The sDBT device has nominal focal spot sizes of 0.6 IEC. The total exposure was divided equally between 15 sources, providing an angular
span of 28° with a magnification factor of 1.08£. No changes were made to the compression plates or digital detector, which is operated without binning (pixel size: 70 mm). An electronic control system directed exposures up to 90 mAs over a range of 29 39 kVp, based on breast thickness, with 1 mm aluminum filtration. These exposures were set to match the exposures used by the “parent” Selenia Dimen-sions DBT system, from which the sDBT device was con-structed. A radiation safety inspection assured dose compliance with the Mammography Quality Standards Act during the collection of craniocaudal and mediolateral obli-que views by sDBT. The scan time for each view was less than 5 seconds, and only the breast containing the“suspicious abnormality”was imaged by sDBT. The sDBT images were compared to the mammogram images that had identified the lesions of concern.
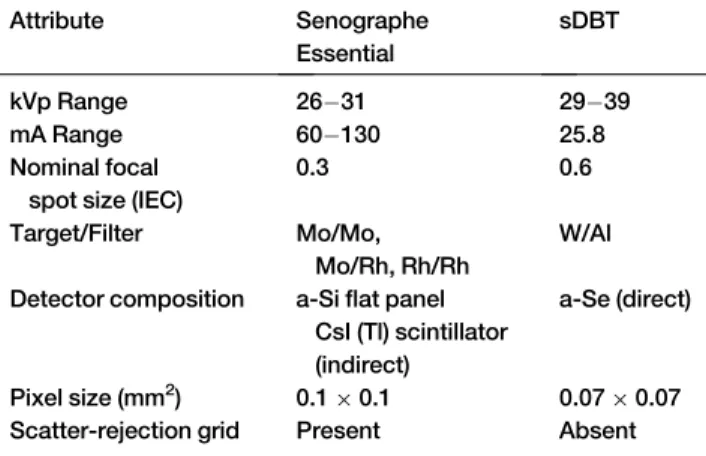
The mammograms that identified women appropriate for the study were acquired using Senographe Essential (GE Healthcare, Milwaukee, Wisconsin ) devices operated in standard automatic optimization of parameters mode with Premium View processing. The Senographe Essential has a nominal focal spot size of 0.3 IEC.Table 1summarizes key differences between the mammography and sDBT systems used in this study.
Given the differences in these two imaging devices, the radiation doses delivered by each during the study were com-pared. Since the entrance dose provides a comparison that can be directly measured at each breast thickness on the novel sDBT system, doses are reported as the incident air kerma (mGy). These measurements were obtained using a Radcal Accu-Pro (9096) dosimeter and 10£6 6M mammography ion chamber (Radcal, Monrovia, California). The entrance dose was obtained from the DICOM header of each mam-mogram, and although the accuracy of the DICOM informa-tion was not directly verified for this study, the Senographe Essential mammography devices are subject to the standard Quality Assurance testing by our Department of Radiology.
Image Processing, Reconstruction, and Display
The 15 projection images collected by sDBT were corrected for offset and gain nonuniformities, providing the informa-tion for reconstrucinforma-tion using a customizedfiltered backpro-jection approach (Piccolo 4.0.5, Real Time Tomography LCC, Villanova, Pennsylvania). The image slices were recon-structed at a thin depth increment of 0.5 mm to ensure that small features, such as microcalcifications, were displayed sharply. All images were presented to the readers on Mam-mography Quality Standards Act-qualified 5-megapixel gray-scale display monitors equipped with conventional DICOM viewing software tools.
Readers and image evaluation
Four fellowship-trained breast imaging radiologists partici-pated in this multireader, multicase, and paired-image study. The readers averaged 15.3§6.8 years (10 25) of experience with mammography and 3.8§2.5 years (0 5) of experience with DBT. Only one reader had zero years of experience with DBT. Each reader was first presented with either the mammogram or sDBT image stack for a particular patient. Readers answered a questionnaire, rating the likelihood of malignancy (0 100% in increments of 10%), the density of breast tissue (BIRADS A D classification) (15), and confi -dence in their overall impression (1 10 scale). Images of the same patient by the other modality were then immediately presented, and readers used a 7-point scale (¡3 to +3) to rate a preference compared to the initially-presented modality when assessing diagnostically important image features using accepted descriptors of mass margin and shape, architectural distortion, asymmetry, and microcalcifi -cation morphology/distribution (15). The order of cases and the modality presentedfirst were random. After a wash-out period of at least 4 weeks, the image pairs were presented to the same readers. The patient order was again randomized, but the modality viewedfirst was reversed. The questionnaire was again completed. This study design reduced the bias asso-ciated with viewing a particular imaging modalityfirst, since the reader determined the likelihood of malignancy for each modality before interpreting images from the other modality. Readers were not provided with any clinical information and were unaware of the pathology results.
Statistical Analysis
Reader performance was quantified as the area under the receiver operating characteristic (ROC) curve (AUC). In this study, ROC curves for sDBT and mammography were gen-erated for each reader using the reader's reported likelihood of malignancy during image interpretation. The likelihood of malignancy cutoffs (0 100%, in 10% increments) provided thresholds around which sensitivity and specificity were cal-culated based on the actual presence of malignancy, as deter-mined by pathology. Given the relatively small number of
TABLE 1. Comparison of the Senographe Essential Mam-mography and Stationary Digital Breast Tomosynthesis (sDBT) Systems and Operational Settings Used in this Study
Attribute Senographe
Essential
sDBT
kVp Range 26 31 29 39
mA Range 60 130 25.8
Nominal focal spot size (IEC)
0.3 0.6
Target/Filter Mo/Mo, Mo/Rh, Rh/Rh
W/Al
Detector composition a-Siflat panel CsI (Tl) scintillator (indirect)
a-Se (direct)
Pixel size (mm2) 0.1£0.1 0.07£0.07 Scatter-rejection grid Present Absent
cases, Tukey's pseudovalue estimation with jackknife resam-pling was used to correct for bias at each threshold (R 3.4.0, R Foundation for Statistical Computing, Vienna, Austria and RStudio 1.1.456, RStudio, Inc., Boston, Massachusetts). Plotting the true positive rate (sensitivity) as a function of the false positive rate (1-specificity) for each threshold defined a relationship through which the ROC curve was fit using logistic regression analysis (MATLAB R2018a, The Math-Works, Inc., Natick, Massachusetts).
Inter-reader agreement was quantified using the Fleiss kappa (k) statistic for mammography and sDBT. This calcula-tion involves selecting a threshold for the readers’reported likelihood of malignancy in order to categorize each interpre-tation as malignant or benign. Agreement was calculated at thresholds of 0.5 and 0.8. Likelihood of malignancy values greater than the threshold were considered to be a malignant
finding, while values less than or equal to the threshold were considered benign.kvalues were interpreted using the guide-lines described by Landis and Koch (17). Intra-reader agree-ment could not be assessed, as readers rated a likelihood of malignancy for each case using each modality only once.
In order to compare the aggregate reader performance with respect to each modality and assess the influence of breast tissue density and compressed breast thickness on per-formance, a multivariate analysis was performed byfitting a linear mixed-effect model (SAS 9.4, SAS Institute, Inc., Cary, North Carolina). Thefixed effects were the difference between the two modalities and density of the breast tissue, and random-effects were used to account for within-patient and within-reader correlations. AnFtest compared the mean AUCs between mammography and sDBT.
A similar multivariate analysis was used to assess reader preference when interpreting diagnostically important image features: mass margin and shape, architectural distortion, asymmetry, and microcalcification morphology/distribution. Scores significantly greater than zero indicate a preference for sDBT while scores significantly less than zero indicate a pref-erence for mammography. Means are reported with their confidence interval, withpvalues less than 0.05 defining sta-tistical significance.
Average reader confidence in overall interpretation using mammography and sDBT was compared by Student's ttest withpvalues less than 0.05 defining statistical significance.
RESULTS
Patient Demographics
Following informed consent, a total of 55 women were recruited for the study. Of this group, four underwent biopsy before the sDBT was obtained and were excluded. The sDBT images were unavailable in another eight due to an issue coordinating the detector and source array. Therefore, images from 43 women were available for analysis. The aver-age aver-age of the participants completing the study was 56.7§ 12.7 years (35 83), of whom 64% were considered to have
dense breast tissue (BIRADS density categories C or D) (16). Average compressed breast thickness for mammography was 4.6 § 1.1 cm (1.9 6.7) and 4.7 § 1.3 cm (2.2 7.5) for sDBT. Of the 43 subjects included in the final analysis, 12 cases of malignancy (28% of the study population) were iden-tified by pathology on specimens obtained by ultrasound-guided core needle biopsy, stereotactic biopsy, or a surgical excision following needle localization. The final pathologic diagnoses included six infiltrating ductal carcinomas, five intraductal carcinomas, and one invasive lobular carcinoma.
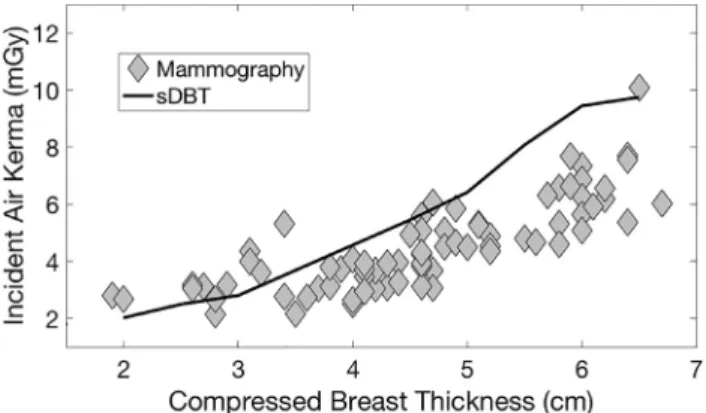
Radiation Dose
Figure 2compares the entrance doses (incident air kerma) as a function of breast thickness for the Senographe Essential mammography system and sDBT. Differences in the dose for a given thickness reflect differences in the approaches used by each system to select its operational settings. sDBT uses only the breast thickness to select the technique (kVp and mAs). In addition to breast thickness, the Senographe Essential incorporates a scout view and automatic exposure control to account for the breast composition and select the operational settings, including the target andfilter. As a result, the Senog-raphe Essential can produce variable doses for a given breast thickness, as seen inFigure 2.
Reader Performance
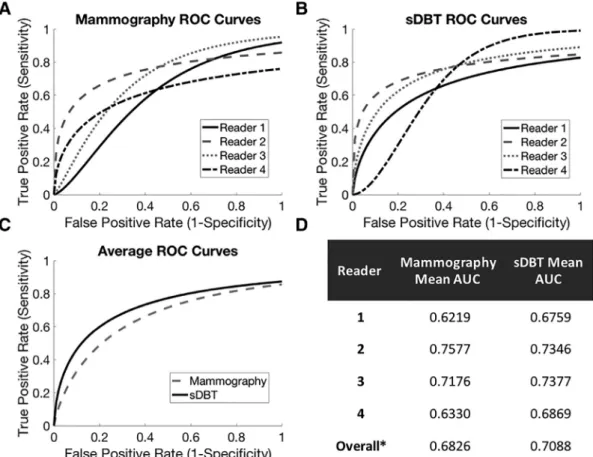
Reader performance can be appreciated by analyzing ROC curves (Fig 3A C). The area under the ROC curve (AUC) provides a measure of diagnostic accuracy and was calculated for each reader and each modality using a mixed-effect model (Fig 3D). In this study, three of the four readers performed better using sDBT. Only Reader 2 performed better using mammography and interestingly had the most experience with mammography at 25 years. Reader 4 had the least expe-rience with sDBT and demonstrated a performance that
Figure 2. Entrance dose as a function of breast thickness for the Senographe Essential mammography system (gray diamonds) and the stationary digital breast tomosynthesis (sDBT) system (black line). Doses are reported as the incident air kerma (mGy) and were measured using a mammography ion chamber dosimeter for sDBT. For each mammogram, doses were obtained from the DICOM header.
differed the most from the other readers when interpreting sDBT images (Fig 3B), as reflected by the ROC curve shape. Overall, the mean AUC for sDBT was significantly (p < 0.0001) higher than the mean AUC for mammography (Fig 3C), demonstrating that on average, readers were more likely to identify malignancy correctly when interpreting the sDBT images.
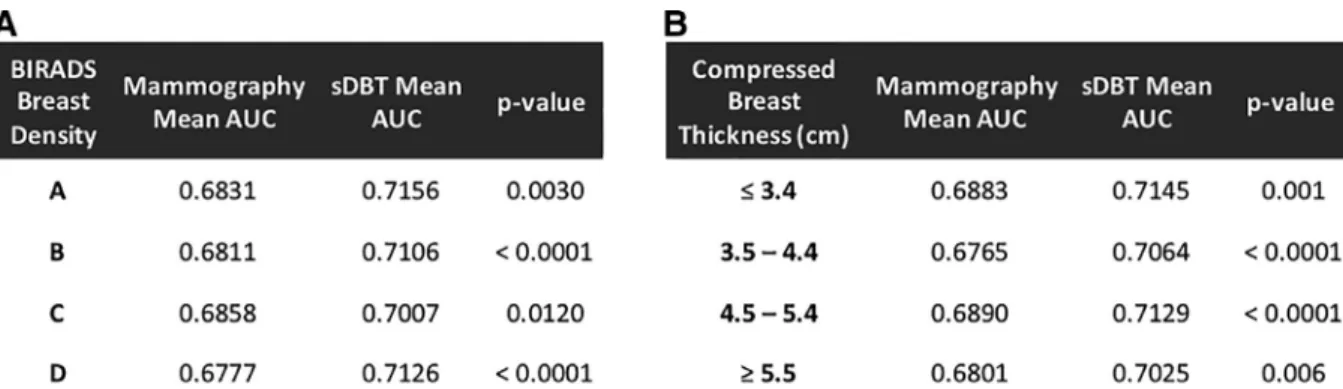
The higher diagnostic accuracy using sDBT held true for each breast density category (BIRADS A D) (16) and breast thickness range, as reflected by statistically higher (p<0.05) mean AUCs for sDBT compared to mammography (Fig 4). The breast thickness ranges were selected to ensure an ade-quate number of samples within each interval for statistical analysis. There was no statistically significant relationship between the mean AUCs and breast density or breast thick-ness for either modality (p>0.05).
Reader Agreement
Using a likelihood of malignancy threshold of 0.5, the overall agreement between readers for the presence of malignancy was fair (k= 0.35) with mammography and slight (k= 0.18) with sDBT. Increasing the likelihood of malignancy thresh-old to 0.8 resulted in moderate agreement (k= 0.59) between
readers when using mammography and substantial agreement (k= 0.67) between readers when using sDBT.
Reader Confidence
On average, readers had similar confidence in their interpre-tation of the mammograms and sDBT images (Fig 5A). Although the readers were not given any clinical information and were unaware of the biopsy results, they were signifi -cantly more confident (p < 0.05) in their final impression when interpreting images that actually contained malignant lesions compared to theirfinal impression when interpreting images that were determined to be benign by biopsy (Fig 5B). This higher confidence when viewing images of malignant as opposed to benign lesions was similar for both mammography and sDBT.
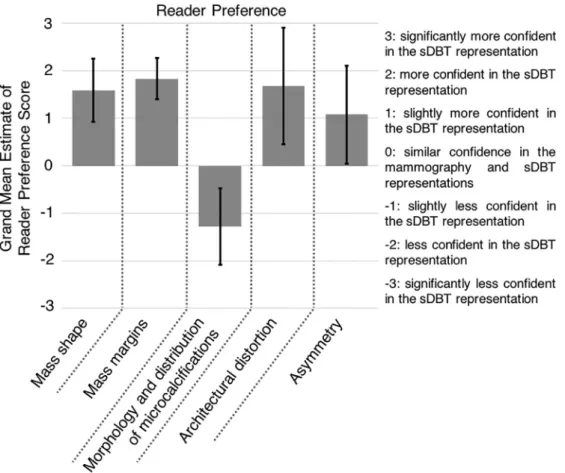
Reader Preference When Interpreting Image Features
Figure 6summarizes reader preference when using sDBT and mammography to interpret diagnostically important image features. As reflected by average preference scores greater than zero, readers preferred sDBT over mammography when interpreting soft-tissue features, including mass shape and
margins (Fig 7), architectural distortion, and asymmetry (p<
0.05 in all cases). However, mammography was preferred over sDBT when characterizing microcalcifications (p < 0.05).
DISCUSSION
Although DBT use continues to increase (9), as experience has demonstrated an overall improvement in diagnostic accu-racy when combined with mammography (18), DBT has yet to replace standard mammography. Software and hardware advances are being made, with technological innovations directed at minimizing the limitations in spatial and temporal resolution imposed by the need to move the x-ray source to collect projection views (11). For example, one DBT system uses continuous source motion to cover a larger angular span but rotates the detector during each projection to compensate for source blur (19). Enabled by CNT technology, sDBT uses afixed and distributed source architecture, allowing for a fast and motion-free collection of projection views across a wide-angle span.
This report summarizes our initial clinical experience with thisfirst-generation sDBT system. The study was designed to gain insight into the performance of this novel technology, with a goal of directing continued development. As such, comparison was made to digital mammography, which is still
considered the reference standard for breast imaging. Addi-tionally, the study focused on a BIRADS 4 population, thereby ensuring pathology using a relatively small number of participants while also presenting readers with a diagnosti-cally challenging image set. Across its full spectrum (A C), the BIRADS 4 designation implies a predictor of malignancy ranging from 2% to 95% (16). Finally, readers with a wide range of DBT experience (0 5 years) were selected.
Although this study design did provide an assessment of sDBT performance across a broad range of pathology and reader experience, it was also associated with limitations that affect thefindings. First, the compared images were collected by devices that differed in terms of focal spot size, anode tar-get composition and beamfiltration, and selected technique (exposure and kVp) for a given breast thickness. As a result, there are differences in the dose and beam quality between these two systems. Additionally, the mammography system utilized a scatter-rejection grid and a detector with a different pixel size and detection method compared to the sDBT sys-tem. All of these have an effect on contrast and resolution and thus the visibility of image features. As such, it is not pos-sible to draw specific conclusions about the benefits offered by an isolated component of the sDBT device, such as the stationary source array. Rather, this study offers an assessment of the sDBT system as a whole, referenced against a standard breast imaging tool. Second, the sDBT images displayed to
Figure 4. Average reader performance as a function of breast density (A) and compressed breast thickness (B). The area under the receiver operator characteristic curve (AUC) provided a measure of diagnostic accuracy. Readers were more likely to make a correct diagnosis using stationary digital breast tomosynthesis (sDBT) compared to mammography for each breast density category (BIRADS A D) (16) and breast thickness range, as reflected by statistically higher (p<0.05) mean AUCs.
Figure 5. Reader confidence. (A) Average reader confidence in the overall impression when interpreting mammograms (gray) and stationary digital breast tomosynthesis (sDBT) images (black). (B) Readers were sig-nificantly more confident in their interpreta-tion of images containing malignant lesions (darker shade) compared to their interpreta-tion of images with benign lesions (lighter shade), with malignant and benign deter-mined by pathology (* representsp<0.05, with bars representing the standard error of each group). This finding was similar for both mammography and sDBT.
the readers were a stack of reconstructed image slices. Choices made in the reconstruction algorithms that produce these images also affect the visibility of image features. For example, in this study, the image slices were reconstructed at a thin increment of 0.5 mm to ensure that small features, such as microcalcifications, were displayed sharply. However, presenting a larger stack of thinner slices may contribute to reader fatigue, as there are more images to review. Also, the tomographic nature of the displayed sDBT image stack can make the assessment of microcalcification clustering more difficult, since the calcifications can be distributed through multiple slices. Appreciating the spatial association of micro-calcifications may therefore be more problematic as the slice thickness decreases. This study was unable to tease out this issue, as readers were asked to rate a preference on microcal-cification morphology and clustering collectively. Future studies are planned to investigate the effects of slice thickness on the visibility of microcalcification clusters with sDBT, as work continues to develop the algorithms incorporating a slab and synthetic mammography capability into sDBT. Given these limitations, thefindings of this study cannot be extrapolated to define a specific screening or diagnostic role for sDBT.
Nevertheless, thefindings do suggest that although experi-mental, sDBT should prove to be a viable clinical tool. Over-all, readers were equally confident interpreting the sDBT images and mammograms. Also, the inter-reader agreement increased with both modalities when a higher threshold was used to categorize the readers’reported likelihood of malig-nancy, suggesting that the readers tended to agree on which lesions they considered most concerning. This agreement is supported by the finding that readers reported significantly higher confidence scores when viewing images from both mammography and sDBT that contained malignant lesions. Also, similar to DBT experience in general (20 22), readers preferred sDBT over mammography when interpreting soft-tissue features, including mass shape and margins, architec-tural distortion, and asymmetry. Finally, as reflected by a statistically higher mean AUC, the readers were diagnostically more accurate with sDBT compared to mammography for all breast densities and compressed breast thicknesses.
Previous studies have compared the diagnostic accuracy of readers interpreting mammograms and conventional DBT image stacks. Several studies have demonstrated single-view DBT to be noninferior to standard mammography (23,24), while Svahn et al. reported a significantly higher diagnostic
accuracy using single-view DBT compared to mammogra-phy (25). However, as the authors of that study noted, the majority of the breast lesions were discovered by ultrasonog-raphy and were difficult to see in the mammograms. As such, the study was quite different from ours, in which the con-cerning lesions that identified patients as study candidates were found by mammography alone. When comparing two-view DBT with standard mammography, Wallis et al. dem-onstrated a significantly higher diagnostic accuracy with DBT, reporting a difference of 0.110 between the mean AUCs for each modality (26). In our study, although signifi -cant, the mean AUC difference between sDBT and standard mammography was lower at 0.028. Interestingly, this differ-ence may in part be related to reader experidiffer-ence. Wallis et al. noted a loss in the statistical difference in performance when readers had more than 10 years of breast imaging experience (26). All of the readers in our study had at least 10 years of experience with mammography and differing levels of expe-rience with DBT, ranging from no expeexpe-rience to 5 years. Indeed, it would be interesting to measure changes in reader performance with sDBT as a function of experience and training, which could include the opportunity to study image features in light of known pathology. Measuring the relation-ship between experience and performance will be considered in future studies, as we continue to explore sDBT at the clini-cal level, imaging more patients and involving more readers.
Although readers were on average more accurate inter-preting sDBT images compared to mammograms, it is impor-tant to note that readers preferred mammography over sDBT when characterizing microcalcifications. Indeed, concern
over the ability to adequately assess microcalcification mor-phology and distribution using DBT has been a significant obstacle to DBT replacing standard 2D mammography (27,28). Visualizing individual microcalcifications requires a high in-plane resolution, which must be balanced against the depth resolution of the system. Wider projection-view angle spans improve depth resolution and favor the display of soft-tissue masses, while narrower angle spans improve the visibil-ity of microcalcifications. In this study, the sDBT device collected projection views over an angle span of 28°, which falls within the range (15° 50°) of currently available DBT devices (29). Thefirst-generation sDBT device used in this study contains focal spots that are larger than those used in standard mammography. Therefore, the image resolution is expected to be lower. Design changes in future CNT-enabled sources will aim to reduce the anode focal spot size using electronic focusing of the CNT cathode-generated electron beam (30). This improvement should allow us to take advantage of the opportunities offered by the stationary source array, including the ability to alter the transmission geometry for task-specific imaging (31) as well as achieve a wider angle-span without compromising in-plane resolution (32), both of which are problematic with conventional, mov-ing-source DBT (11). Finally, as noted previously, the tomo-graphic display of DBT images as a stack of thin-slice reconstructions can make it difficult to assess the spatial rela-tionship between microcalcifications. Generating a synthetic slab or full mammogram from the reconstructed image stack provides the opportunity to (1) enhance selected image features, such as microcalcifications and (2) display their
distribution in a single 2D image (33). Given its high resolu-tion, the sDBT system may prove to be a valuable tool for generating synthetic mammograms optimized for the detec-tion of microcalcifications, and work is underway to develop the forward projection and feature-enhancement algorithms to incorporate slab and synthetic mammography capability into sDBT. It is anticipated that these advances will improve microcalcification presentation, and future human studies comparing sDBT not only to standard 2D mammography but also conventional DBT are planned.
CONCLUSION
This initial clinical experience with this prototype sDBT sys-tem is encouraging, as readers preferred sDBT over mam-mography when interpreting soft-tissue breast features and were more likely to identify malignancy correctly using images generated by sDBT. Thesefindings align with DBT performance in general and demonstrate the potential of sDBT as a viable clinical tool. However, reader preference for mammography when characterizing microcalcifications highlights the need for additional work to take full advantage of the unique benefits offered by the sDBT technology. As hardware and software optimization of the sDBT system con-tinues, future studies will compare its performance to stan-dard 2D mammography and available DBT systems to contextualize its clinical utility in the breast imaging arena.
ACKNOWLEDGMENTS
The authors would like to thank Doreen Steed for assistance with patient imaging, Hologic, Inc. for technical support, and the Radiology Research Core at UNC.
AUTHOR DECLARATION
The authors certify that this original work has not received prior publication and is not under consideration for publica-tion elsewhere.
FUNDING
This work was supported by a University Cancer Research Fund from the UNC Lineberger Comprehensive Cancer Center and the National Cancer InstituteU54 CA151652.
REFERENCES
1. Noone AM, Howlader N, Krapcho M, et al. SEER cancer statistics review,
1975-2015. Bethesda, MD: National Cancer Institute, 2018https://seer.
cancer.gov/csr/1975_2015/based on November 2017 SEER data sub-mission, posted to the SEER web site, April.
2. IARC Working Group on the Evaluation of Cancer-Preventive Strategies.
Breast cancer screening. Vol. 15. Lyon: IARC Press, 2016
http://publica- tions.iarc.fr/Book-And-Report-Series/Iarc-Handbooks-Of-Cancer-Pre-vention/Breast-Cancer-Screening-2016Accessed October 28, 2018.
3. Tabar L, Dean PB, Chen TH, et al. The incidence of fatal breast cancer
measures the increased effectiveness of therapy in women participating in mammography screening. Cancer 2018. doi:10.1002/cncr.31840.
4. Boyd NF, Guo H, Martin LJ, et al. Mammographic density and the risk
and detection of breast cancer. N Engl J Med 2007; 356(3):227–236.
doi:10.1056/NEJMoa062790.
5. Mammograms. National Cancer Institute. Reviewed December 7,
2016https://www.cancer.gov/types/breast/mammograms-fact-sheet. Accessed October 28, 2018.
6. Kerlikowske K, Zhu W, Hubbard RA, et al. Outcomes of screening
mam-mography by frequency, breast density, and postmenopausal hormone
therapy. JAMA Intern Med 2013; 173(9):807–816.
doi:10.1001/jamai-nternmed.2013.307.
7. Haas BM, Kalra V, Geisel J, et al. Comparison of tomosynthesis plus
digital mammography and digital mammography alone for breast
cancer screening. Radiology 2013; 269(3):694–700. doi:10.1148/
radiol.13130307.
8. Rafferty EA, Park JM, Philpotts LE, et al. Diagnostic accuracy and recall
rates for digital mammography and digital mammography combined with one-view and two-view tomosynthesis: results of an enriched reader
study. AJR Am J Roentgenol 2014; 202(2):273–281. doi:10.2214/
AJR.13.11240.
9. Gao Y, Babb JS, Toth HK, et al. Digital breast tomosynthesis
prac-tice patterns following 2011 FDA approval: a survey of Breast
Imag-ing Radiologists. Acad Radiol 2017; 24(8):947–953. doi:10.1016/j.
acra.2016.12.011.
10. Zhao B, Zhao W. Three-dimensional linear system analysis for breast
tomo-synthesis. Med Phys 2008; 35(12):5219–5232. doi:10.1118/1.2996014.
11. Shaheen E, Marshall N, Bosmans H. Investigation of the effect of tube
motion in breast tomosynthesis: continuous or step and shoot? In: Pro-ceedings volume 7961, medical imaging 2011: physics of medical imag-ing; 2011. p. 79611E. doi:10.1117/12.877348.
12. Ghani MU, Wu D, Wong MD, et al. Quantitative comparison of spatial
resolution in step-and-shoot and continuous motion digital breast tomo-synthesis. In: Proceedings volume 9783, medical imaging 2016: physics of medical imaging; 2016. p. 97836D. doi:10.1117/12.2216102.
13. Qian X, Tucker A, Gidcumb E, et al. High resolution stationary digital
breast tomosynthesis using distributed carbon nanotube x-ray source
array. Med Phys 2012; 39(4):2090–2099. doi:10.1118/1.3694667.
14. Puett C, Inscoe C, Hartman A, et al. An update on carbon
nanotube-enabled X-ray sources for biomedical imaging. Wiley Interdiscip Rev Nanomed Nanobiotechnol 2018; 10(1). doi:10.1002/wnan.1475.
15. Carestream Shows New Mobile X-ray System with Carbon Nanotube
Technology at RSNA. 2017. https://www.carestream.com/en/us/
newsandevents/news-releases/2017/carestream-shows-new-mobile-x-ray-system-with carbon-nanotube-technology-at-rsna. Accessed October 28, 2018.
16. Sickles EA, D'Orsi CJ, Bassett LW. ACR BI-RADSÒMammography. In: ACR BI-RADSÒ Atlas, Breast Imaging Reporting and Data System. Reston, VA: American College of Radiology. 2013.
17. Landis JR, Koch GG. The measurement of observer agreement for cate-gorical data. Biometrics 1977; 33(1):159–174.
18. Hooley RJ, Durand MA, Philpotts LE. Advances in digital breast
tomo-synthesis. Am J Roentgenol 2016; 208(2):256–266. doi:10.2214/
AJR.16.17127.
19. Sechopoulos I. A review of breast tomosynthesis. Part I. The image
acquisition process. Med Phys 2013; 40(1). doi:10.1118/1.4770279.
20. Yang T-L, Liang H-L, Chou C-P, et al. The adjunctive digital breast
tomo-synthesis in diagnosis of breast cancer. Biomed Res Int 2013; 2013. doi:10.1155/2013/597253.
21. Dibble EH, Lourenco AP, Baird GL, et al. Comparison of digital
mam-mography and digital breast tomosynthesis in the detection of
architec-tural distortion. Eur Radiol 2018; 28(1):3–10.
doi:10.1007/s00330-017-4968-8.
22. Helvie MA. Digital mammography imaging: breast tomosynthesis and
advanced applications. Radiol Clin N Am 2010; 48(5):917–929.
doi:10.1016/j.rcl.2010.06.009.
23. Gennaro G, Toledano A, Maggio Cdi, et al. Digital breast tomosynthesis
versus digital mammography: a clinical performance study. Eur Radiol
2010; 20(7):1545–1553. doi:10.1007/s00330-009-1699-5.
24. Thibault F, Dromain C, Breucq C, et al. Digital breast tomosynthesis
versus mammography and breast ultrasound: a multireader
perfor-mance study. Eur Radiol 2013; 23(9):2441–2449. doi:10.1007/
s00330-013-2863-5.
25. Svahn TM, Chakraborty DP, Ikeda D, et al. Breast tomosynthesis and
digital mammography: a comparison of diagnostic accuracy. Br J Radiol
26. Wallis MG, Moa E, Zanca F, et al. Two-view and single-view tomosynthesis
versus full-field digital mammography: high-resolution X-ray imaging observer
study. Radiology 2012; 262(3):788–796. doi:10.1148/radiol.11103514.
27. Spangler ML, Zuley ML, Sumkin JH, et al. Detection and classification of
calcifications on digital breast tomosynthesis and 2D digital
mammogra-phy: a comparison. AJR Am J Roentgenol 2011; 196(2):320–324.
doi:10.2214/AJR.10.4656.
28. Tagliafico A, Mariscotti G, Durando M, et al. Characterisation of
micro-calcification clusters on 2D digital mammography (FFDM) and digital
breast tomosynthesis (DBT): does DBT underestimate microcalcification
clusters? Results of a multicentre study. Eur Radiol 2014; 25(1):9–14.
doi:10.1007/s00330-014-3402-8.
29. Michell MJ, Batohi B. Role of tomosynthesis in breast imaging going
for-ward. Clin Radiol 2018; 73(4):358–371. doi:10.1016/j.crad.2018.01.001.
30. Sprenger F, Calderon X, Gidcumb E, et al. Stationary digital breast
tomo-synthesis with distributedfield emission X-ray tube. In: Proceedings
Vol-ume 7961, Medical Imaging 2011: Physics of Medical Imaging; 2011. p. 79615I. doi:10.1117/12.878280.
31. Hadjipanteli A, Elangovan P, Mackenzie A, et al. The effect of system
geometry and dose on the threshold detectable calcification diameter in
2D-mammography and digital breast tomosynthesis. Phys Med Biol 2017; 62(3):858. doi:10.1088/1361-6560/aa4f6e.
32. Tucker AW, Lu J, Zhou O. Dependency of image quality on system
con-figuration parameters in a stationary digital breast tomosynthesis
sys-tem. Med Phys 2013; 40(3):031917doi:10.1118/1.4792296.
33. Ratanaprasatporn L, Chikarmane SA, Giess CS. Strengths and
weak-nesses of synthetic mammography in screening. Radiographics 2017;