https://doi.org/10.1177/0898264318759379 Journal of Aging and Health 2019, Vol. 31(7) 1155 –1171 © The Author(s) 2018
DOI: 10.1177/0898264318759379
Relation of Diabetes
to Cognitive Function
in Hispanics/Latinos of
Diverse Backgrounds in
the United States
Tali Elfassy, PhD
1, Allison E. Aiello, PhD
2,
Neil Schneiderman, PhD
1, Mary N. Haan, PhD
3,
Wassim Tarraf, PhD
4, Hector M. González, PhD
5,
Marc Gellman, PhD
1, Hermes J. Florez, MD, PhD
1,
Jose A. Luchsinger, MD
6, Clinton B. Wright, MD
7,
Ellen Grober, PhD
8, and Adina Zeki Al Hazzouri, PhD
1Abstract
Objectives:To examine the association between diabetes and cognitive
function within U.S. Hispanics/Latinos of Central American, Cuban, Dominican, Mexican, Puerto Rican, and South American background. Method: This cross-sectional study included 9,609 men and women (mean age = 56.5 years), who are members of the Hispanic Community Health Study/Study of Latinos. We classified participants as having diabetes, prediabetes, or normal
1University of Miami, FL, USA
2The University of North Carolina at Chapel Hill, USA
3University of California San Francisco, USA
4Wayne State University, Detroit, MI, USA
5Michigan State University, East Lansing, USA
6Columbia University Medical Center, New York, NY, USA
7National Institute of Neurological Disorders and Stroke, Bethesda, MD, USA
8Albert Einstein College of Medicine, The Bronx, NY, USA
Corresponding Author:
glucose regulation. Participants underwent a neurocognitive battery consisting of tests of verbal fluency, delayed recall, and processing speed. Analyses were stratified by Hispanic/Latino subgroup. Results: From fully adjusted linear regression models, compared with having normal glucose regulation, having diabetes was associated with worse processing speed among Cubans (β = −1.99; 95% CI [confidence interval] = [−3.80, −0.19]) and Mexicans (β = −2.26; 95% CI = [−4.02, −0.51]). Compared with having normal glucose regulation, having prediabetes or diabetes was associated with worse delayed recall only among Mexicans (prediabetes: β = −0.34; 95% CI = [−0.63, −0.05] and diabetes: β = −0.41; 95% CI = [−0.79, −0.04]). No associations with verbal fluency. Discussion: The relationship between diabetes and cognitive function varied across Hispanic/Latino subgroup.
Keywords
cognitive aging, diabetes, epidemiology, minority aging, Hispanics/Latinos
Introduction
Mounting evidence suggests that type 2 diabetes is associated with increased risk, in some instances double the risk, of cognitive decline and dementia (Biessels, Strachan, Visseren, Kappelle, & Whitmer, 2014; Chen, Magliano, & Zimmet, 2012; Cukierman, Gerstein, & Williamson, 2005). Although the exact underlying mechanisms remain relatively unclear, possible mecha-nisms linking type 2 diabetes to cognitive function include chronic hypergly-cemia or hypoglyhypergly-cemia, insulin resistance, stroke, and other cerebrovascular disease (Boden-Albala et al., 2008; Manschot et al., 2006). U.S. Hispanics/ Latinos are disproportionately affected by diabetes compared with non-Latino Whites (Flegal, Carroll, Kit, & Ogden, 2012; Knowlden & Sharma, 2013), and previous work has shown that the prevalence of diabetes-related cognitive deterioration is higher in Hispanic/Latinos than in non-Latino Whites (Noble, Manly, Schupf, Tang, & Luchsinger, 2012). Prior work on the relationship between diabetes and cognitive function in Hispanics/Latinos has focused primarily on Latinos of Mexican descent, including findings from the Hispanic Established Populations for the Epidemiologic Study of the Elderly (Nguyen, Black, Ray, Espino, & Markides, 2002) and the Sacramento Area Latino study on Aging (Mayeda, Haan, Kanaya, Yaffe, & Neuhaus, 2013; Mayeda, Haan, Yaffe, Kanaya, & Neuhaus, 2015).
2006; Morales, Leng, & Escarce, 2011). For example, earlier findings from the Hispanic Health and Nutrition Examination Survey have shown higher prevalence of diabetes for Mexican Americans and Puerto Ricans compared with Cubans (Flegal et al., 2012). More recent findings from the Hispanic Community Health Study/Study of Latinos (HCHS/SOL) have shown that the prevalence of major CVD risk factors (Arredondo et al., 2016; Daviglus et al., 2012; Siega-Riz et al., 2014), including hypertension, obesity, diabetes, diet, and physical activity varied markedly across subgroups of Hispanics/ Latinos. Despite such differences in common CVD risk factors by Hispanic/ Latino subgroup, and numerous potential pathways underlying the associa-tion between diabetes and cognitive, it is currently unknown whether the association between diabetes and cognitive function differs across Hispanic/ Latino subgroups.
In this study, we use data from a large population-based cohort of Hispanic/ Latino adults in the United States (ages 44-74 years) to investigate the asso-ciations between diabetes and cognitive function among Hispanics/Latinos of Central American, Cuban, Dominican, Mexican, Puerto Rican, and South American background. We hypothesized that the association between diabe-tes and cognitive function would be stronger among Hispanics/Latinos with a greater CVD burden—particularly Puerto Ricans and Cubans.
Method
Study Population
The HCHS/SOL is a population-based study of 16,415 community dwelling self-identified Hispanic/Latinos of varying heritage. In brief, participants aged 18 to 74 were recruited in areas surrounding four field sites: Bronx, New York; Chicago, Illinois, Miami-Dade, Florida; and San Diego, California. A two-stage area probability sample of households was selected; stratifica-tion and oversampling at each stage was used to attain appropriate represen-tation of Hispanic/Latinos in the target population (Lavange et al., 2010). Detailed descriptions of the HCHS/SOL study and sample design have been published elsewhere (Lavange et al., 2010; Sorlie et al., 2010).
Assessment of Diabetes
Fasting blood glucose (FPG) adjusted for fasting time was assessed using a hexokinase enzymatic method (Roche Diagnostics Corporation, Indianapolis, Indiana). A 2-hr OGTT (Oral Glucose Tolerance Test) was used to measure glucose tolerance among participants with a fasting plasma glucose <150 mg/ dL. And glycosylated hemoglobin (A1C) was measured in ethylenediamine-tetraacetic acid (EDTA) whole blood using a Tosoh G7 automated high-per-formance liquid chromatography analyzer (Tosoh Bioscience Inc., San Francisco, California).
Diabetes status/impaired glucose classification was defined based on the American Diabetes Association (2010) criteria, and thus participants were clas-sified as having “diabetes” if one of the following criterion were met: FPG ≥ 126 mg/dL, 2-hr post load OGTT level ≥ 200 mg/dL, A1C ≥ 6.5%, or use of diabetes medication (documented through scanned medications). Otherwise, individuals were classified as having “impaired glucose tolerance or prediabe-tes” if one of the following criterion were met: FPG in the range of 100 to 125 mg/dL, or 2-hr post load OGTT level in the range of 140 to 199 mg/dL, or A1C in the range of 5.7% to 6.5%. Participants were classified as having “nor-mal glucose regulation” if one of the following criterion were met: FPG < 100mg/dL, 2-hr post load OGTT level < 140 mg/dL, or A1C < 5.7%.
Assessment of Cognitive Function
Heritage and Other Covariates
Questionnaires administered as part of the baseline visit were used to obtain information on heritage/ancestry. Heritage was characterized as the following categories: Dominicans, Central Americans, Cubans, Mexicans, Puerto Ricans, and South Americans. HCHS/SOL participants reported their age, sex, educa-tional attainment, language of preference (Spanish vs. English), nativity (born in the 50 U.S. States vs. foreign-born), smoking status (never, current, or for-mer), and history of stroke or transient ischemic attack (TIA). Physical activity was assessed with the modified version of the World Health Organization Global Physical Activity Questionnaire, and participants were coded as either meeting or not the 2008 guidelines (at least the equivalent of 150 min/week of moderate intensity or 75min/week of vigorous intensity physical activity). Measured height and weight were used to calculate body mass index (BMI in kg/m2), and obesity was defined as having a BMI ≥ 30 kg/m2. Waist
circumfer-ence (WC in cm) was measured at the iliac crest using Gulick II 150 and 250 cm anthropometric tape and rounded to the nearest cm. Abdominal obesity or having a large waist was defined as a WC ≥ 102 cm in men and WC > 88 cm in women. Three seated blood pressure measurements were taken using an auto-matic sphygmomanometer (OMRON HEM-907 L) and then averaged. Hypertension was defined as having systolic blood pressure ≥ 140 mmHg or diastolic blood pressure ≥ 90 mmHg, or documented use of antihypertension medication through scanned medications.
Statistical Analysis
Of the 9,618 participants, age 44 or older, who were administered the neuro-cognitive battery, 143 (or 1.5% of the sample) had missing data for one or more covariates (Hispanic/Latino subgroup, education, language preference, nativity, BMI, WC, cigarette use, physical activity, history of stroke, or dia-betes) and were excluded from the analysis. The final analytical sample included 9,475 individuals.
within Hispanic/Latino subgroup, and adjusted for potential confounders based on a priori literature and their association with diabetes and cognition. We first adjusted for sociodemographic variables, including age, sex, education, nativity, and language of preference, and then added adjustment for behavioral and CVD risk factors, including smoking status, BMI, large WC, physical activity, hyper-tension, and stroke/TIA. All analyses were conducted in SUDAAN version 11.0.1 (Research Triangle Park, North Carolina), to account for the complex survey design of the HCHS/SOL study. Significance testing was two-sided with 5% significance level.
Results
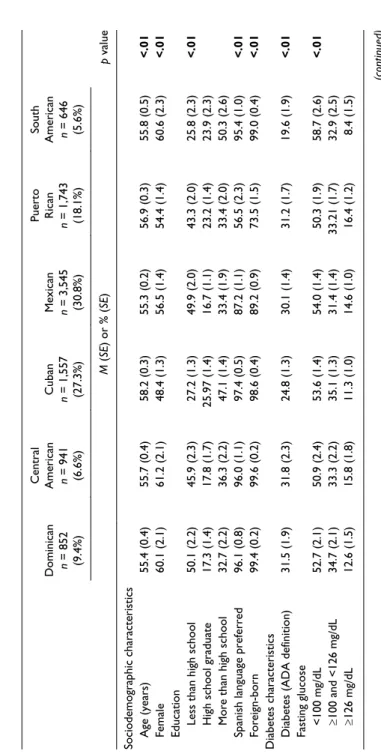
Mean age in the sample differed by Hispanic/Latino subgroup (p < .01; Table 1). South Americans were most likely to have had more than a high school educa-tion (50.3%), compared with other groups (p < .01). Spanish language was over-whelmingly preferred by most subgroups, except in Puerto Ricans (only 56.5% of whom preferred Spanish). Likewise, the majority of participants were for-eign-born, with Puerto Ricans and Mexicans being more likely to be U.S. born, compared with others (p < .01). South Americans had significantly the lowest prevalence of diabetes (19.6%), obesity (37.4%), and hypertension (35.8%), compared with other subgroups.
The distribution of key risk factors of cognitive function among partici-pants with diabetes differed across Hispanic/Latino subgroups (Figure 1). For example, participants of Cuban heritage who have diabetes were more likely to be smokers and less physically active than other Hispanic/Latino sub-groups with diabetes.
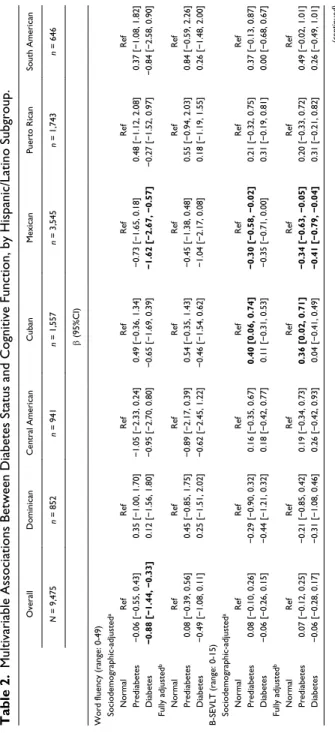
From fully adjusted linear regression models stratified by Hispanic/Latino subgroup (Table 2), compared with having normal glucose regulation, having diabetes was associated with lower DSST score (processing speed) among Cubans (β = −1.99; 95% confidence interval [CI] = [−3.80, −0.19]) and Mexicans (β = −2.26; 95% CI = [−4.02, −0.51]). Compared with having nor-mal glucose regulation, having prediabetes or diabetes was associated with lower B-SEVLT score (delayed recall) only among Mexicans (prediabetes: β = −0.34; 95% CI = [−0.63, −0·05]; diabetes: β = −0.41; 95% CI = [−0.79, −0.04]), from fully adjusted models. We found no association between diabe-tes status and word fluency, among all Hispanic/Latino subgroups.
Discussion
Table 1.
Age-Standardized Baseline Characteristics of the Study Population, by Hispanic/Latino Subgroup.
Dominican n = 852 (9.4%) Central American n = 941 (6.6%)
Cuban n = 1,557 (27.3%) Mexican n = 3,545 (30.8%) Puerto Rican n = 1,743 (18.1%)
South
American n = 646 (5.6%)
p
value
M
(
SE
) or % (
SE
)
Sociodemographic characteristics Age (years)
55.4 (0.4) 55.7 (0.4) 58.2 (0.3) 55.3 (0.2) 56.9 (0.3) 55.8 (0.5) <.01 Female 60.1 (2.1) 61.2 (2.1) 48.4 (1.3) 56.5 (1.4) 54.4 (1.4) 60.6 (2.3) <.01
Education Less than high school
50.1 (2.2) 45.9 (2.3) 27.2 (1.3) 49.9 (2.0) 43.3 (2.0) 25.8 (2.3) <.01
High school graduate
17.3 (1.4) 17.8 (1.7) 25.97 (1.4) 16.7 (1.1) 23.2 (1.4) 23.9 (2.3)
More than high school
32.7 (2.2) 36.3 (2.2) 47.1 (1.4) 33.4 (1.9) 33.4 (2.0) 50.3 (2.6)
Spanish language preferred
96.1 (0.8) 96.0 (1.1) 97.4 (0.5) 87.2 (1.1) 56.5 (2.3) 95.4 (1.0) <.01 Foreign-born 99.4 (0.2) 99.6 (0.2) 98.6 (0.4) 89.2 (0.9) 73.5 (1.5) 99.0 (0.4) <.01
Diabetes characteristics Diabetes (ADA definition)
31.5 (1.9) 31.8 (2.3) 24.8 (1.3) 30.1 (1.4) 31.2 (1.7) 19.6 (1.9) <.01 Fasting glucose <100 mg/dL 52.7 (2.1) 50.9 (2.4) 53.6 (1.4) 54.0 (1.4) 50.3 (1.9) 58.7 (2.6) <.01 ≥
100 and <126 mg/dL
Dominican n = 852 (9.4%) Central American n = 941 (6.6%)
Cuban n = 1,557 (27.3%) Mexican n = 3,545 (30.8%) Puerto Rican n = 1,743 (18.1%)
South
American n = 646 (5.6%)
p
value
M
(
SE
) or % (
SE ) A1C a <5.7% 32.9 (1.8) 38.3 (2.1) 48.4 (1.5) 36.7 (1.2) 38.3 (1.9) 48.0 (2.3) <.01 ≥
5.7% and <6.5%
45.1 (2.4) 40.7 (2.2) 36.5 (1.3) 42.6 (1.4) 39.0 (1.7) 40.8 (2.4) ≥ 6.5% 22.0 (1.9) 20.9 (2.1) 15.0 (1.1) 20.6 (1.2) 22.8 (1.4) 11.1 (1.7) A1C control
a (<7%)
84.5 (2.0) 84.0 (2.0) 90.7 (0.9) 85.8 (1.0) 83.1 (1.2) 92.0 (1.5) <.01
Other health characteristics Obese
41.7 (2.4) 42.7 (2.4) 40.8 (1.4) 40.3 (1.3) 49.5 (1.9) 37.4 (2.5) <.01
Large waist circumference
59.6 (2.5) 61.7 (2.3) 61.9 (1.4) 64.7 (1.3) 64.8 (1.7) 56.4 (2.5) .02 Current smoker 10.4 (1.6) 13.1 (1.5) 30.3 (1.7) 13.6 (1.0) 28.9 (1.7) 14.2 (1.7) <.01 Physical activity 601.5 (53.0) 574.3 (35.0) 420.7 (23.4) 550.8 (26.1) 463.2 (26.0) 487.8 (40.9) <.01 Hypertension 48.2 (2.6) 44.2 (1.8) 49.3 (1.3) 37.6 (1.7) 49.3 (1.6) 35.8 (2.3) <.01 Stroke/TIA 6.0 (1.1) 4.8 (1.1) 4.1 (0.5) 2.3 (0.4) 6.4 (0.8) 2.5 (0.9) <.01 Note.
Except for age, all variables are age-standardized to U.S. 2010 Census population, usi
ng the following age groups and proportions: 45-49: 0.220038; 50-54:
0.216061; 55-59: 0.190545; 60-64: 0.210396; 65+: 0.210396. Bold-face indicates significant results. A1C = glycosylated hemoglo
bin; ADA= American Diabetes
Association; TIA = transient ischemic attack. aA1C of 5.7% corresponds to 39 mmol/mol; 6.5% corresponds to 48 mmol/mol; 7% corresponds to 53 mmol/mol.
advantage is that each subgroup has a large enough sample size to permit subsample analysis. The diabetes-cognition relationship varied by heritage and was mostly significant among Mexicans and Cubans. Among Mexicans, having diabetes or even prediabetes was significantly associated with worse cognitive performance on domains of processing speed and attention (DSST) and verbal memory (B-SEVLT) but not on language. All significant associa-tions were independent of key risk factors of cognitive function, including education and vascular factors, thus suggesting that they do not fully account for these associations. Pathways resulting in diabetes-related cognitive defi-cit may not be necessarily the same across Hispanics/Latinos who are hetero-geneous with regard to heritage, nativity, language, and other behavioral and social determinants of diabetes and cognition.
Our findings are consistent with evidence from previous studies among older adult Latinos, particularly among Mexican Americans, showing that diabetes is associated with worse cognitive performance (Mayeda et al., 2015; Nguyen et al., 2002; Wu et al., 2003). Recent findings from the Washington Heights–Inwood Columbia Aging Project, a multiethnic cohort, found significant associations between diabetes and worse cognitive perfor-mance and mild cognitive impairment (Lavange et al., 2010; Luchsinger et al., 2007). The risk of cognitive impairment attributable to diabetes in this population from Northern Manhattan has been reported to be particularly high among Hispanics and Blacks compared with Whites, with disparities in diabetes partially explaining disparities in cognitive impairment (Noble et al.,
59
9
48
44* 59
9
35*
59 61
29*
57* 54
54
13
48
54 68*
24*
49
63* 51
22
46
57
0 10 20 30 40 50 60 70 80
Hypertension Smoker Inadequate Physical Acvity Obese
Prevalence
Dominican Central American Cuban Mexican Puerto Rican South American
Figure 1. Age adjusted prevalence of risk factors among HCHS/SOL participants with diabetes, across Hispanic/Latino subgroup.
Note. HCHS/SOL = Hispanic Community Health Study/Study of Latinos.
Table 2.
Multivariable Associations Between Diabetes Status and Cognitive Function, by Hispanic/Latino Subgroup.
Overall Dominican Central American Cuban Mexican Puerto Rican South American N = 9,475 n = 852 n = 941 n = 1,557 n = 3,545 n = 1,743 n = 646 β (95%CI)
Word fluency (range: 0-49) Sociodemographic-adjusted
a Normal Ref Ref Ref Ref Ref Ref Ref Prediabetes
−0.06 [−0.55, 0.43]
0.35 [−1.00, 1.70]
−1.05 [−2.33, 0.24]
0.49 [−0.36, 1.34]
−0.73 [−1.65, 0.18]
0.48 [−1.12, 2.08]
0.37 [−1.08, 1.82]
Diabetes
−0.88 [−1.44, −0.33]
0.12 [−1.56, 1.80]
−0.95 [−2.70, 0.80]
−0.65 [−1.69, 0.39]
−1.62 [−2.67, −0.57]
−0.27 [−1.52, 0.97]
−0.84 [−2.58, 0.90]
Fully adjusted b Normal Ref Ref Ref Ref Ref Ref Ref Prediabetes
0.08 [−0.39, 0.56]
0.45 [−0.85, 1.75]
−0.89 [−2.17, 0.39]
0.54 [−0.35, 1.43]
−0.45 [−1.38, 0.48]
0.55 [−0.94, 2.03]
0.84 [−0.59, 2.26]
Diabetes
−0.49 [−1.08, 0.11]
0.25 [−1.51, 2.02]
−0.62 [−2.45, 1.22]
−0.46 [−1.54, 0.62]
−1.04 [−2.17, 0.08]
0.18 [−1.19, 1.55]
0.26 [−1.48, 2.00]
B-SEVLT (range: 0-15) Sociodemographic-adjusted
a Normal Ref Ref Ref Ref Ref Ref Ref Prediabetes
0.08 [−0.10, 0.26]
−0.29 [−0.90, 0.32]
0.16 [−0.35, 0.67]
0.40 [0.06, 0.74]
−0.30 [−0.58, −0.02]
0.21 [−0.32, 0.75]
0.37 [−0.13, 0.87]
Diabetes
−0.06 [−0.26, 0.15]
−0.44 [−1.21, 0.32]
0.18 [−0.42, 0.77]
0.11 [−0.31, 0.53]
−0.35 [−0.71, 0.00]
0.31 [−0.19, 0.81]
0.00 [−0.68, 0.67]
Fully adjusted b Normal Ref Ref Ref Ref Ref Ref Ref Prediabetes
0.07 [−0.12, 0.25]
−0.21 [−0.85, 0.42]
0.19 [−0.34, 0.73]
0.36 [0.02, 0.71]
−0.34 [−0.63, −0.05]
0.20 [−0.33, 0.72]
0.49 [−0.02, 1.01]
Diabetes
−0.06 [−0.28, 0.17]
−0.31 [−1.08, 0.46]
0.26 [−0.42, 0.93]
0.04 [−0.41, 0.49]
−0.41 [−0.79, −0.04]
0.31 [−0.21, 0.82]
0.26 [−0.49, 1.01]
Overall Dominican Central American Cuban Mexican Puerto Rican South American N = 9,475 n = 852 n = 941 n = 1,557 n = 3,545 n = 1,743 n = 646 β (95%CI)
DSST (range: 0-83) Sociodemographic-adjusted
a Normal Ref Ref Ref Ref Ref Ref Ref Prediabetes
−0.42 [−1.14, 0.29]
−0.37 [−2.18, 1.43]
1.02 [−1.12, 3.17]
−1.05 [−2.71, 0.62]
−0.95 [−2.21, 0.31]
0.45 [−1.22, 2.13]
0.63 [−1.65, 2.91]
Diabetes
−1.77 [−2.60, −0.93]
−1.65 [−3.91, 0.60]
−0.50 [−2.75, 1.76]
−2.05 [−3.80, −0.30]
−2.56 [−4.15, −0.98]
−1.36 [−3.07, 0.36]
1.43 [−1.54, 4.40]
Fully adjusted b Normal Ref Ref Ref Ref Ref Ref Ref Prediabetes
−0.39 [−1.13, 0.36]
−0.39 [−2.14, 1.35]
0.91 [−1.21, 3.03]
−1.03 [−2.75, 0.70]
−0.80 [−2.11, 0.52]
0.34 [−1.39, 2.07]
0.81 [−1.47, 3.09]
Diabetes
−1.56 [−2.45, −0.68]
−1.54 [−3.65, 0.58]
−0.54 [−3.01, 1.93]
−1.99 [−3.80, −0.19]
−2.26 [−4.02, −0.51]
−1.27 [−3.17, −0.63]
2.16 [−0.85, 5.16]
Note.
The
p
values for interaction between diabetes and Hispanic/Latino subgroup for Mode
ls 1 and 2, respectively, were 0.25 and 0.30 for word fluency, 0.01 and 0.03
for B-SEVLT, and 0.68 and 0.39 for DSST. CI = confidence interval; B-SEVLT = Brief Spanish English Verbal Learning Test; DSST =
Digit Symbol Substitution Test;
BMI = body mass index; TIA = transient ischemic attack. aAdjusts for age, sex, education, language, nativity, overall model additionally adjusts for His
panic/Latino subgroup.
bAdditionally adjusts for BMI, large waist circumference, smoking, physical activity, hyperte
nsion, stroke/TIA.
2012). In a sample of middle-aged Hispanics, majority Dominicans, diabetes and prediabetes were associated with worse cognitive function in multiple domains, including memory and executive function (Luchsinger, Cabral, Eimicke, Manly, & Teresi, 2015). The latter finding is not consistent with our study in which we did not find a diabetes-cognition association in Dominicans. In an analysis of the Northern Manhattan Study (NOMAS), diabetes was not associated with cognitive function after adjusting for potential confounders (Vieira et al., 2011). Although NOMAS is a multiethnic study, the association of diabetes with cognitive function was not explored within racial/ethnic subgroups.
The mechanisms underlying the association of diabetes with worse cog-nitive performance and with higher risk of dementia remain relatively unclear. Studies have shown that persons with diabetes have a greater risk of stroke (Boden-Albala et al., 2008; Manschot et al., 2006) and cerebral infarcts (Arvanitakis et al., 2006; Peila, Rodriguez, Launer, & Honolulu-Asia Aging, 2002). Diabetes has also been linked to accumulation or impaired clearance of brain amyloid (Selkoe, 2000). In addition, whether diabetes is a cerebrovascular risk factor or a risk factor for Alzheimer pathology or both remains debatable. However, our findings, showing sig-nificant diabetes-related cognitive deficit on processing speed and attention among Mexican and Cuban Americans, suggest an underlying cerebrovas-cular mechanism. In other Hispanic/Latino subgroups, for example, among Hispanic/Latinos of Dominican, Central American, Puerto Rican, and South American heritage, diabetes was not associated with cognition but rather the association was fully explained by sociodemographic factors.
may compromise their performance. However, we acknowledge that while we adjusted for education in the current analyses, our measure does not reflect the quality of education. Furthermore, we did not have data regarding country of primary educational attainment which may ultimately influence cognitive performance.
All significant associations were independent of key risk factors, including education and vascular factors. However, pathways resulting in diabetes-related cognitive deficit, including experiences of diabetes, may not be neces-sarily the same across Hispanics/Latinos who are heterogeneous with regard to background, nativity, language, and other social determinants of diabetes and cognition. Although we adjusted for key risk factors, it is possible that they resulted in a cascade of risk through other unmeasured pathways, thus resulting in the different diabetes-cognition relationship across subgroups. Finally, there could be residual confounding due to unmeasured shared deter-minants of both diabetes and cognition, including early life confounders that could have influenced peak cognitive performance earlier in life. Although language preference and nativity could be potential modifiers of the diabetes-cognitive function relationship, the majority of the participants were Spanish-speaker and foreign-born which limited our power to conduct those analyses. Despite these limitations, the present study has several strengths that con-tribute to existing literature on the relationship between diabetes and cogni-tion. This is the first study to report such associations among six large Hispanic/Latino subgroups, known to be heterogeneous with regard to key risk factors of diabetes and cognition. The latter is particularly important given the evidence that the prevalence of cognitive deficit attributable to dia-betes is disproportionately distributed across ethnic groups. Our measure of diabetes followed the guideline by the American Diabetes Association and was based on fasting glucose, A1C, and OGTT as well as medication use. A major strength of this study is the large sample size which accommodates within Hispanic/Latino subgroup analyses, unlike any other previous study. Finally, our cohort included a wide age range capturing not only older age but also middle age, a period during which the prevalence of diabetes and predia-betes increases, thus facilitating the study of diapredia-betes-related cognitive deficit.
least partially independent of vascular pathways, and that less cognitive reserve along with other unmeasured pathways and residual confounding could account for the observed associations. To our knowledge, this is the first study of Hispanics/Latinos with large enough sample size to accommo-date within subgroup investigation of the relationship between diabetes and cognition. This study lays foundation for future research to investigate those associations within subgroups of Hispanics/Latinos whenever possible, and to explore potential underlying mechanisms by which diabetes may differen-tially influence cognition within Hispanics/Latinos.
Declaration of Conflicting Interests
The authors declared no potential conflicts of interest with respect to the research, authorship, and/or publication of this article.
Funding
The authors disclosed receipt of the following financial support for the research, authorship, and/or publication of this article: This study was funded by the U.S. National Institutes of Health (NIH), National Institute on Aging (Grant K01 AG047273); the NIH, National Institute of Diabetes and Digestive and Kidney Diseases (NIDDK; Grant R01 DK087864); the NIH, National Heart, Lung, and Blood Institute (NHLBI; Grant HL 007426); and American Heart Association (Grant 17POST32490000). The Hispanic Community Health Study/Study of Latinos was carried out as a collaborative study supported by contracts from the NHLBI to the University of North Carolina (Grant N01 HC65233), University of Miami (Grant N01 HC65234), Albert Einstein College of Medicine (Grant N01 HC65235), Northwestern University (Grant N01 HC65236), and San Diego State University (Grant N01 HC65237). The sponsors had no role in the design or conduct of the study; collection, management, analysis, or interpretation of the data; or the preparation, review, or approval of the manuscript.
References
American Diabetes Association. (2010). Diagnosis and classification of diabetes
mel-litus. Diabetes Care, 33(Suppl. 1), S62-S69.
Arredondo, E. M., Sotres-Alvarez, D., Stoutenberg, M., Davis, S. M., Crespo, N. C., Carnethon, M. R., . . . Evenson, K. R. (2016). Physical activity levels in U.S. Latino/Hispanic adults: Results from the Hispanic Community Health Study/
Study of Latinos. American Journal of Preventive Medicine, 50, 500-508.
Arvanitakis, Z., Schneider, J. A., Wilson, R. S., Li, Y., Arnold, S. E., Wang, Z., & Bennett, D. A. (2006). Diabetes is related to cerebral infarction but not to AD
pathology in older persons. Neurology, 67, 1960-1965.
and cognitive change in a multiethnic elderly cohort. Journal of the American
Geriatrics Society, 63, 1075-1083.
Bethel, J. W., & Schenker, M. B. (2005). Acculturation and smoking patterns among
Hispanics: A review. American Journal of Preventive Medicine, 29, 143-148.
Biessels, G. J., Strachan, M. W., Visseren, F. L., Kappelle, L. J., & Whitmer, R. A. (2014). Dementia and cognitive decline in type 2 diabetes and prediabetic stages:
Towards targeted interventions. The Lancet Diabetes & Endocrinology, 2, 246-255.
Boden-Albala, B., Cammack, S., Chong, J., Wang, C., Wright, C., Rundek, T., . . . Sacco, R. L. (2008). Diabetes, fasting glucose levels, and risk of ischemic stroke and vascular events: Findings from the Northern Manhattan Study (NOMAS).
Diabetes Care, 31, 1132-1137.
Chen, L., Magliano, D. J., & Zimmet, P. Z. (2012). The worldwide epidemiology
of type 2 diabetes mellitus—Present and future perspectives. Nature Reviews
Endocrinology, 8, 228-236.
Cukierman, T., Gerstein, H. C., & Williamson, J. D. (2005). Cognitive decline and dementia in diabetes—Systematic overview of prospective observational studies.
Diabetologia, 48, 2460-2469.
Daviglus, M. L., Talavera, G. A., Aviles-Santa, M. L., Allison, M., Cai, J., Criqui, M. H., . . . Stamler, J. (2012). Prevalence of major cardiovascular risk factors and car-diovascular diseases among Hispanic/Latino individuals of diverse backgrounds in
the United States. Journal of the American Medical Association, 308, 1775-1784.
Diez Roux, A. V., Detrano, R., Jackson, S., Jacobs, D. R., Jr., Schreiner, P. J., Shea, S., & Szklo, M. (2005). Acculturation and socioeconomic position as predictors
of coronary calcification in a multiethnic sample. Circulation, 112, 1557-1565.
Flegal, K. M., Carroll, M. D., Kit, B. K., & Ogden, C. L. (2012). Prevalence of obesity and trends in the distribution of body mass index among US adults, 1999-2010.
Journal of the American Medical Association, 307, 491-497.
González, H. M., Mungas, D., Reed, B. R., Marshall, S., & Haan, M. N. (2001). A new verbal learning and memory test for English-and Spanish-speaking older
people. Journal of the International Neuropsychological Society, 7, 544-555.
González, H. M., Tarraf, W., Gouskova, N., Gallo, L. C., Penedo, F. J., Davis, S. M., . . . Mosley, T. H. (2015). Neurocognitive function among middle-aged and older Hispanic/Latinos: Results from the Hispanic Community Health Study/Study
of Latinos. Archives of Clinical Neuropsychology: The Official Journal of the
National Academy of Neuropsychologists, 30(1), 68-77.
Kandula, N. R., Diez-Roux, A. V., Chan, C., Daviglus, M. L., Ni, H., & Schreiner, P. J. (2008). Association of acculturation levels and prevalence of diabetes in the
multi-ethnic study of atherosclerosis (MESA). Diabetes Care, 31, 1621-1628.
Knowlden, A. P., & Sharma, M. (2013). Systematic review of school-based obesity
interventions targeting African American and Hispanic children. Journal of
Health Care for the Poor and Underserved, 24, 1194-1214.
Lavange, L. M., Kalsbeek, W. D., Sorlie, P. D., Avilés-Santa, L. M., Kaplan, R. C., Barnhart, J., . . . Elder, J. P. (2010). Sample design and cohort selection in the
Hispanic Community Health Study/Study of Latinos. Annals of Epidemiology,
Luchsinger, J. A., Cabral, R., Eimicke, J. P., Manly, J. J., & Teresi, J. (2015). Glycemia, diabetes status, and cognition in Hispanic adults aged 55-64 years.
Psychosomatic Medicine, 77, 653-663.
Luchsinger, J. A., Reitz, C., Patel, B., Tang, M. X., Manly, J. J., & Mayeux, R. (2007).
Relation of diabetes to mild cognitive impairment. Archives of Neurology, 64,
570-575.
Mainous, A. G., III, Majeed, A., Koopman, R. J., Baker, R., Everett, C. J., Tilley, B. C., & Diaz, V. A. (2006). Acculturation and diabetes among Hispanics: Evidence
from the 1999-2002 National Health and Nutrition Examination Survey. Public
Health Reports, 121(1), 60-66.
Manschot, S. M., Brands, A. M., van der Grond, J., Kessels, R. P., Algra, A., Kappelle, L. J., . . . Utrecht Diabetic Encephalopathy Study Group. (2006). Brain magnetic resonance imaging correlates of impaired cognition in patients with type 2
diabe-tes. Diabetes, 55, 1106-1113.
Mayeda, E. R., Haan, M. N., Kanaya, A. M., Yaffe, K., & Neuhaus, J. (2013). Type 2 diabetes and 10-year risk of dementia and cognitive impairment among older
Mexican Americans. Diabetes Care, 36, 2600-2606.
Mayeda, E. R., Haan, M. N., Yaffe, K., Kanaya, A. M., & Neuhaus, J. (2015). Does type 2 diabetes increase rate of cognitive decline in older Mexican Americans?
Alzheimer Disease & Associated Disorders, 29, 206-212.
Morales, L. S., Leng, M., & Escarce, J. J. (2011). Risk of cardiovascular disease
in first and second generation Mexican-Americans. Journal of Immigrant and
Minority Health, 13, 61-68.
Nguyen, H. T., Black, S. A., Ray, L. A., Espino, D. V., & Markides, K. S. (2002).
Predictors of decline in MMSE scores among older Mexican Americans. The
Journals of Gerontology, Series A: Biological Sciences & Medical Sciences,
57(3), M181-M185.
Noble, J. M., Manly, J. J., Schupf, N., Tang, M. X., & Luchsinger, J. A. (2012). Type
2 diabetes and ethnic disparities in cognitive impairment. Ethnicity & Disease,
22, 38-44.
Peila, R., Rodriguez, B. L., Launer, L. J., & Honolulu-AsiaAging, S. (2002). Type 2 diabetes, APOE gene, and the risk for dementia and related pathologies: The
Honolulu-Asia Aging Study. Diabetes, 51, 1256-1262.
Selkoe, D. J. (2000). The origins of Alzheimer disease: A is for amyloid. Journal of
the American Medical Association, 283, 1615-1617.
Siega-Riz, A. M., Sotres-Alvarez, D., Ayala, G. X., Ginsberg, M., Himes, J. H., Liu, K., . . . Van Horn, L. (2014). Food-group and nutrient-density intakes by Hispanic and Latino backgrounds in the Hispanic Community Health Study/Study of
Latinos. The American Journal of Clinical Nutrition, 99, 1487-1498.
Sorlie, P. D., Aviles-Santa, L. M., Wassertheil-Smoller, S., Kaplan, R. C., Daviglus, M. L., Giachello, A. L., . . . Heiss, G. (2010). Design and implementation of the
Hispanic Community Health Study/Study of Latinos. Annals of Epidemiology,
Spreen, O., & Strauss, E. (1998). A compendium of neuropsychological tests:
Administration, norms, and commentary (2nd ed.). New York, NY: Oxford
University Press.
Stern, Y. (2002). What is cognitive reserve? Theory and research application of the
reserve concept. Journal of the International Neuropsychological Society, 8,
448-460.
Vieira, J. R., Elkind, M. S., Moon, Y. P., Rundek, T., Boden-Albala, B., Paik, M. C., . . . Wright, C. B. (2011). The metabolic syndrome and cognitive performance:
The Northern Manhattan Study. Neuroepidemiology, 37, 153-159.
Wechsler, D. (1997). Wechsler Adult Intelligence Scale–III (WAIS-III). San Antonio,
TX: Psychological Corporation.
Wu, J. H., Haan, M. N., Liang, J., Ghosh, D., Gonzalez, H. M., & Herman, W. H. (2003). Impact of diabetes on cognitive function among older Latinos: A
popula-tion-based cohort study. Journal of Clinical Epidemiology, 56, 686-693.
U.S. Department of Commerce. (2011). Age and sex composition: 2010. Economics