Referral patterns between High and Low Volume Centers and
Associations with Uterine Cancer Treatment and Survival: A
population-based study of Medicare, Medicaid, and privately
insured women
Kemi M. DOLL, MD1,2,3, Ke MENG, PhD3, Paola A. GEHRIG, MD1,3, Wendy R. BREWSTER, MD, PhD1,2,3, and Anne-Marie MEYER, PhD3
1Division of Gynecologic Oncology, University of North Carolina School of Medicine, Chapel Hill,
NC
2Division of Health Policy and Management, Gillings School of Global Public Health, University of
North Carolina, Chapel Hill, NC
3Lineberger Comprehensive Cancer Center, University of North Carolina, Chapel Hill, NC
Abstract
Background—High-volume (HV) center surgery and gynecologic oncology care are associated with improved outcomes for women with uterine cancer. Referral patterns, from biopsy through to chemotherapy, may have patients interacting with HV centers for all, a portion, or none of their care. The relative frequency, the underlying factors that contribute to referral, and the potential impact of these referral patterns on treatment outcomes are unknown.
Objective—To analyze the referral patterns and subsequent impact of care sites on treatment for women with high and low risk uterine cancer.
Methods—This is a population-based retrospective cohort study of uterine cancer cases from 2004–09 in North Carolina. Using state cancer registry files linked to Medicare, Medicaid, and private payer insurance claims, we analyzed referral and treatment patterns by annual surgical volume (High ≥ 12/year). We examined clinical and demographic factors associated with referral
Corresponding Author: Kemi M. Doll, MD, Division of Gynecologic Oncology, University of North Carolina at Chapel Hill, Physicians Office Building, 101 Manning Drive, Campus Box 7572, Chapel Hill, NC 27599, [email protected], P: 919-966-5996, F: 919-843-5387.
Reprint Requests:
Kemi M. Doll, MD [email protected]
Dr. Kemi M. Doll and Dr. Anne-Marie Meyer had full access to all the data in the study and take responsibility for the integrity of the data and the accuracy of the data analysis. Dr. Ke Meng and Dr. Kemi M. Doll (University of North Carolina School of Medicine) conducted and are responsible for the data analysis
Presentation Information: These findings will be presented at the 47th Society of Gynecologic Oncology Annual Meeting on Women’s Cancer in San Diego, CA, March 19–22nd, 2016
Disclosure statement: The authors report no conflict of interest.
Publisher's Disclaimer: This is a PDF file of an unedited manuscript that has been accepted for publication. As a service to our
HHS Public Access
Author manuscript
Am J Obstet Gynecol
. Author manuscript; available in PMC 2017 October 01.Published in final edited form as:
Am J Obstet Gynecol. 2016 October ; 215(4): 447.e1–447.e13. doi:10.1016/j.ajog.2016.04.020.
A
uthor Man
uscr
ipt
A
uthor Man
uscr
ipt
A
uthor Man
uscr
ipt
A
uthor Man
uscr
and used modified Poisson regression to evaluate risk of referral, lymphadenectomy and chemotherapy. Stratified Kaplan Meier plots and Cox proportional hazard models were used to examine survival.
Results—A total of 2,053 women were analyzed, including 34% (n=677) with Grade 3 histology. Of 1,630 (80%) of women with pre-operative biopsies, referral patterns (Biopsy to Surgery) were: LV to HV (n=652, 40%), followed by HV to HV (n=605, 37%), then LV to LV (n=318, 20%), and the rare HV to LV (n=50, 3%). Women retained in Low-Volume centers after biopsy were older, were less likely to have private insurance, and had more comorbidities. High-risk histology (aRR 1.14, 95%CI: 1.04–1.25) was positively associated with referral, while Medicaid insurance was negatively associated with referral (aRR 0.64, 95%CI: 0.42–0.96). Most women (74%, n=1,557) had surgery at HV centers. Lymphadenectomy was less likely at Low-Volume (LV) centers (aRR 0.71, 95%CI: 0.64–0.77). Similarly, for high-risk patients, the relationship between LV center surgery and subsequent chemotherapy was aRR 0.71 (95%CI: 0.48–1.02).
Of 290 women who received chemotherapy, the referral patterns (Surgery to Chemotherapy) were: HV- All (HV to HV), HV-Hybrid (HV to LV, or LV to HV), and HV-None (LV to LV). 36% (n=104/290) received chemotherapy at a LV center, the majority (68%, n=71/104) of whom were referred from out of HV centers after surgery. Crude, unadjusted mortality risk of chemotherapy recipients differed by referral pattern (Surgery to Chemotherapy): HV-All patients (HR 1.0, referent), followed by HV-Hybrid (HR 1.33, 95%CI: 0.93–1.91) then HV-None patients (RR 1.95, 95%CI:1.24–3.08).
Conclusion—Most women with uterine cancer treated at High-Volume centers arrive through referral, which is affected by age and type of insurance, in addition to histology. For high-risk women who require chemotherapy, survival may be related to the extent of treatment received at High-Volume centers.
Keywords
Uterine cancer; treatment patterns; high volume; outcomes
Introduction
The majority of uterine cancer patients undergo surgery by general gynecologists,1–3 despite documented benefits of gynecologic oncology treatment. Women most likely to benefit from a gynecologic oncologist are older women (age > 70) and women with high-risk histology (grade 3 and/or non-endometrioid).3 In addition, gynecologic oncology training is highly correlated with high annual surgical volume, which in turn, has been associated with improved perioperative outcomes in uterine cancer patients1.
Despite this data, the frequency with which women with uterine cancer are referred to high-volume centers is unclear. To our knowledge, all studies assessing surgical high-volume in uterine cancer have focused on the single surgical episode.1,2,4–6 This excludes information on the referral patterns both before and after surgery. One critical transition point in uterine cancer care is the step from diagnostic biopsy to receipt of surgery. Women may be initially diagnosed at High-Volume centers and remain there for surgery. On the other hand, perhaps more often, they may be initially diagnosed in a primary care, Low-Volume setting, and then
A
uthor Man
uscr
ipt
A
uthor Man
uscr
ipt
A
uthor Man
uscr
ipt
A
uthor Man
uscr
subsequently referred to a High-Volume center. Another critical transition point, for high-risk patients, is from surgery to chemotherapy. For patients with high-high-risk histology, it is especially important to understand these referral patterns. They experience higher mortality and often require adjuvant chemotherapy for the best chance of cure.7–1011
There is no evidence describing the proportion of uterine cancer patients who follow the different referral patterns, the influence of histology, demographics, or other factors on these patterns, nor their impact on clinical outcomes.
The goal of this study was to examine these questions at a population level, including women of all ages, enrolled in Medicare, Medicaid, and privately insured health plans. Specifically, we sought to (1) describe the relative frequency and demographic features of women in each referral pattern, and (2) analyze the association of demographic and clinical factors with likelihood of referral and subsequent treatment and outcomes.
Methods
Data Source and Study Population
This study was approved by the North Carolina Institutional Review Board (# 13-2863). The North Carolina Central Cancer Registry (NCCCR), a state-level mandatory reporting registry, was used to identify all women in North Carolina diagnosed with a primary uterine cancer, from January 1st 2004–June 30th 2009. Women who were diagnosed at death or autopsy, had a prior cancer diagnosis, or a major primary disability were excluded using NCCCR flags and International Classification of Disease (ICD)-O-3 site and morphology codes. The North Carolina Integrated Cancer Information and Surveillance System (ICISS) links identified cancer cases from the NCCCR with administrative data from Medicare, Medicaid and beneficiaries in privately insured health plans across the state.11 Over 80% of the unique cancer registry patients link to at least one of the administrative databases captured in the ICISS data. The NC Cancer Registry is a “gold certified” registry based on the North American Association of Central Cancer Registries (NAACCR) standards and includes 99% valid, complete social security numbers, as well as other key identifiers such as first, maiden, and last names, date of birth, and address. The Medicare and Medicaid beneficiaries are linked to the registry via the Center for Medicare and Medicaid Services (CMS) contractor General Dynamics using a deterministic, exact match on social security numbers. The privately insured beneficiaries are linked through both deterministic (SEER141 Medicare algorithm) and probabilistic algorithm incorporating Bayes formula which results in a linkage of 100% sensitivity, 98% specificity and a 95% Positive Predictive Value (PPV).11 Due to administrative lag in data availability, the Medicaid enrollment file extends to 2008, while all other enrollment data is through 2009. We restricted the sample to women with linked, continuous enrollment, in any payer, from 6 months prior to 6 months after diagnosis date. This allowed for accurate capture of comorbidity, diagnosis, and treatment data. Due to small numbers, women with missing or unknown race/ethnicity information were excluded.
Tumor histology and morphology codes were grouped into the following categories: endometrioid adenocarcinoma, serous carcinoma, carcinosarcoma, sarcoma, and other
A
uthor Man
uscr
ipt
A
uthor Man
uscr
ipt
A
uthor Man
uscr
ipt
A
uthor Man
uscr
(Supplemental Table A.1). High-risk histology was defined as Grade 3 – 4 and/or any non-endometrioid histology. Grade 3 (poorly differentiated) and 4 (undifferentiated) were combined into one category of Grade 3 as this reflects how they are defined and treated clinically. For the purposes of assessing frequency of chemotherapy delivery, the population denominator was restricted to non-endometrioid histology, as this group is uniformly recommended to have chemotherapy by national guidelines.10
Exposure and Outcome Variables
Histology type and treatment sites were the primary exposure variables. Treatment sites were identified using zip codes on provider billing claims for each episode of care (biopsy, surgery, chemotherapy). The zip codes were then categorized into High-Volume centers based on uterine cancer hysterectomy volume (≥ 60 cases) during the 5 year study period. In addition, the presence of a gynecologic oncology specialist practicing at that location as determined from the Society of Gynecologic Oncology membership database was determined. There was high concordance (89%) between these 2 criteria, and case volume was used first to define the HV and LV groups. The numerical cut-off for surgical volume was consistent with prior studies,1,3,5 using cut-offs ranging from 10–14.5 mean cases/year. Zip codes that identified outreach practice locations of known gynecologic oncologists were classified with the High-Volume center of the gynecologic oncologist’s primary practice location (n=6). The 4 potential referral patterns included Volume biopsy to High-Volume Surgery (HV-HV), High-High-Volume Biopsy to High-Volume Surgery (HV-LV), Low-Volume Biopsy to High-Low-Volume Surgery (LV-HV), and Low-Low-Volume Biopsy to Low-Low-Volume Surgery (LV-LV). Volume status, at each point of care (biopsy, surgery, chemotherapy) was therefore based on uterine cancer hysterectomy volume of that zip code. For example, a biopsy done by a general gynecologist at a tertiary center that had high uterine cancer hysterectomy volume, would be classified as a “HV” biopsy.
Primary study outcomes were referral pattern, performance of lymphadenectomy, and chemotherapy administration for high-risk histology. Exploratory analysis of all-cause mortality was also performed. Hysterectomy was defined using Common Procedure Terminology (CPT) codes for hysterectomy, occurring at the time of or after cancer
diagnosis (Supplemental Table A.1). Lymphadenectomy was defined using the nodal staging information from the cancer registry, which specifies whether or not lymph nodes were removed. Chemotherapy administration was defined by the presence of ICD9 administration or Healthcare Common Procedure Coding System (HCPCS) medication codes in the claims, using an algorithm validated in many cancer types, including ovarian.12 Mortality
information came from the state cancer registry, updated through 2014.
Covariates
Covariates included age, race/ethnicity, population density of residence county, stage at diagnosis, comorbidity, and insurance payer. Age at diagnosis and race/ethnicity were reported from the NCCCR. Due to small sample size with granular race and ethnicity categories, all non-White, Non-Hispanic categories were grouped into “Racial and Ethnic minorities”. Stage at diagnosis was reported with the summary staging variable (local, regional, distant, unknown) common to state and national cancer registries, and broadly
A
uthor Man
uscr
ipt
A
uthor Man
uscr
ipt
A
uthor Man
uscr
ipt
A
uthor Man
uscr
corresponds to FIGO Stage 1 (local), Stage 2–3 (regional), and Stage 4 (distant)
categorization.13,14 There were no changes in staging classification during the study period. Rural/urban classification from the United States Department of Agriculture was
dichotomized at the county level into Metro vs. Non-metro based on Rural/Urban
Continuum codes from 2013.15 Comorbidity was assessed using methods reported by Gagne et al,16 which incorporates both the Charlson comorbidity index and the Elixhauser
comorbidity score, to provide the most comprehensive assessment of health status. Data from outpatient and inpatient clinical settings is incorporated into the scoring system. Those with scores ≥ 1 represent patients with a comorbidity profile that is associated with greater hospitalization and health care utilization and/or greater mortality risk. In this scale comorbidity values can be < 0 for conditions actually associated with decreased health care use. This group was nearly identical to those with scores of 0, and therefore comorbidity was dichotomized into ≤0 vs ≥1. For multivariate analysis, insurance payers were grouped into 3 mutually exclusive categories of any private payer, Medicare only, or any Medicaid.
Statistical Analysis
We performed univariate and bivariate analysis of histology type, the covariates and the primary outcomes of referral pattern, lymphadenectomy, and chemotherapy receipt. Chi square statistic, student’s t-test, and analysis of variance (ANOVA) tests were used to assess the relationships between independent variables and outcome variables. We constructed multivariable models using modified Poisson regression to generate risk ratios of referral pattern, lymphadenectomy, and chemotherapy receipt. Survival was explored by generating Kaplan Meier curves stratified by care model type and Cox proportional hazard models to generate crude hazard ratios (HR) for time to death (mortality). Statistical significance was set at p<0.05. Analysis was performed using SAS v9.3 (Cary, NC).
Results
Study Population and Sites of Care
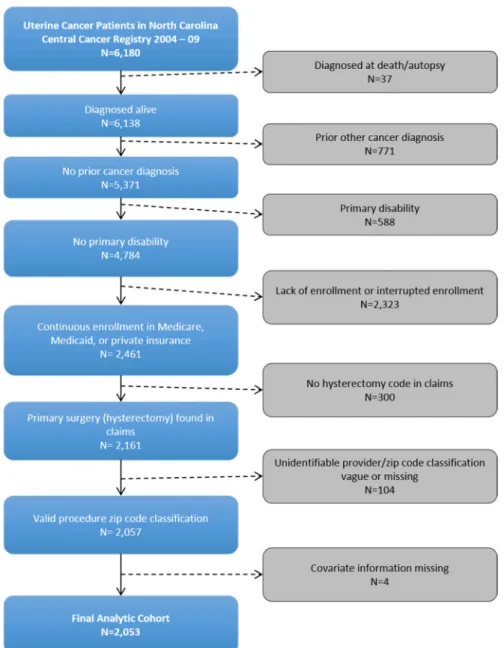
A total of 6,180 women were diagnosed with uterine cancer in North Carolina from January 1st 2004 – June 30th 2009. Of these, 1,393 (23%) were excluded for: diagnosis at autopsy (n=37), prior cancer diagnosis (n=771), and primary disability (n=588). Of the remaining 4,784 women, 2,461 had linked, continuous enrollment in one of the three payers for at least 6 months prior to 6 months after diagnosis. After further exclusions at the claims level, 2,053 women comprised the cohort (Figure 1).
Twenty-four sites of care were identified and grouped into 18 distinct practices. Half (9/18) were identified as High-Volume centers and half as Low-Volume centers. Most patients had surgery at High-Volume centers (n=1,557 [74%]). Low-Volume centers had more patients who were in the tails of the age distribution (20–49 and 75+), who resided in non-metro counties, who had public insurance, and who had higher comorbidity scores (Table 1).
Referral Patterns: Biopsy to Surgery
Eighty percent (n=1,630) of women had documented pre-operative endometrial biopsy. Overall, 60% (970/1,630) of patients were initially biopsied at a Low-Volume center and
A
uthor Man
uscr
ipt
A
uthor Man
uscr
ipt
A
uthor Man
uscr
ipt
A
uthor Man
uscr
40% (660/1630) at a High-Volume center. The most common pattern of referral, from biopsy to surgery, was the Hybrid model (LV-HV [n=652, 40%]), followed by all High-Volume care (HV-HV [n=605,37%]), and then by all Low-Volume care (LV-LV [n=318,21%]). The remaining 55 women were in the rare HV-LV pattern (3%). We suspect this unusual pattern may be the result of women diagnosed outside of their usual care pattern, such as a biopsy in the emergency department or during travel. These women are likely to subsequently follow up with their usual care primary providers. The 3 main referral groups differed
demographically by age, county of residence, insurance type, and comorbidity. As a group, women in the LV-LV pattern were older, resided in more non-metro counties, had less private insurance, and higher comorbidity scores (Table 2).
In the multivariate analysis, for all women initially biopsied in a Low-Volume center, we assessed the likelihood of referral to a High-Volume center. Women with high-risk histology (RR 1.14 [95% CI:1.04–1.25]) were more likely to be referred to a High-Volume center to a small degree, while women with Medicaid insurance were less likely to be referred (RR 0.64 [95% CI:0.42–0.96]) (Table 3).
Treatment Patterns at the time of Surgery
The overall rate of lymphadenectomy totaled 67%. On bivariate analysis, lymphadenectomy was significantly more common when surgery was performed at High-Volume centers (74% vs 46%, p<0.001). Lymphadenectomy was also more common among those with high-risk histology (74% vs 69%, p=0.041). In multivariate models, which included adjustment for histologic grade, women treated at Low-Volume centers remained less likely to undergo lymphadenectomy (RR 0.71, 95% CI 0.65–0.78) (Supplemental Table A.2).
For women with non-endometrioid histology, the overall rate of chemotherapy receipt was 38.9% (n=151/385). After surgery at a High-Volume center, 41% (n=123/297) of women with non-endometrioid histology received chemotherapy. In contrast, after surgery at a Low-Volume center, only 31% (n=28/88) of women with non-endometrioid histology received chemotherapy (p=0.105). After adjusting for covariates, the association between Low-Volume center surgery and receipt of chemotherapy was aRR 0.71 (95% CI: 0.49–1.03) (Supplemental Table A.3).
Referral patterns: Surgery to Chemotherapy
For all patients who received chemotherapy, the site of surgery and site of chemotherapy were used to create 3 referral care model groups: All (HV-All), High-Volume-Hybrid (HV-High-Volume-Hybrid), and High-Volume-None (HV-None) (Table 4). Most, 65%, were in HV-All, 25% were in HV-Hybrid, and 11.5% of patients where in HV-None referral care models. There were significant demographic and treatment differences between the referral groups. Both HV-None and HV-Hybrid referral groups had more patients with public insurance and with ≥ 1 comorbidity compared to the All group. Both None and HV-Hybrid also had fewer patients with local stage disease. HV-None had more with unknown/ missing stage, and HV-Hybrid had more with regional stages.
Both HV-Hybrid and HV-None patients had lower survival probabilities than HV-All patients (Figure 2). In a crude, unadjusted model of mortality risk, HV-None was associated
A
uthor Man
uscr
ipt
A
uthor Man
uscr
ipt
A
uthor Man
uscr
ipt
A
uthor Man
uscr
with the greatest mortality risk (HR 1.95, 95%CI: 1.24 – 3.08), followed by HV-Hybrid (HR 1.33, 95%CI: 0.93 – 1.91), although the latter was not statistically significant.
Comment
To our knowledge, this is first study to evaluate population-level referral patterns for uterine cancer, from biopsy through to chemotherapy, based on histologic risk. Our ability to follow both publically and privately insured patients, of all ages, through multiple sites of care delivery is unique and lends generalizability to our data. When all steps of care are considered, nearly half of uterine cancer patients are in hybrid referral patterns that incorporate both High-Volume and Low-Volume centers. For each critical transition point, there were differences in treatment based on referral pattern. Although high-risk histology did modestly increase the likelihood of referral to a High-Volume center for surgery, these high-risk types still comprised a third of women treated at Low-Volume centers, where likelihood of lymphadenectomy was significantly lower. A third of patients requiring chemotherapy received it at Low-Volume centers, the majority of whom were actually referred from out of High Volume centers after their surgery. These patients, in Hybrid care models, had survival outcomes better than those with no care at High Volume centers, but worse than those with all care at High Volume centers.
Women with high-risk uterine cancer should not receive surgical care at Low-Volume centers.7,8,15 In comparison to the more common, low-risk histology, Grade 3 endometrioid tumors and all non-endometrioid tumors are aggressive uterine cancers that have higher recurrence and substantially decreased survival.9 The vast majority of women in our sample had endometrial biopsies before definitive surgery, allowing opportunity for appropriate referral. In our analysis however, although tumor biology was a factor, insurance type was also strongly associated with referral patterns to High-Volume centers. In addition, older age and increased comorbidity characterized the population of women who were never seen at High-Volume centers. These vulnerable patients may be the ones who could most benefit from the extended multi-disciplinary services usually available at High-Volume centers. Because endometrial biopsies are often performed in primary care settings, general gynecologists and other women’s health care providers serve as crucial gatekeepers to the initiation of quality uterine cancer care.
Referral to a High-Volume center makes a difference in the type of care received. In our study, patients who had surgery at High-Volume centers were more likely to undergo lymphadenectomy. A greater proportion of these women also received subsequent chemotherapy if they had high-risk histology. This is consistent with previous studies associating gynecologic oncology care with increased number of lymph nodes removed and chemotherapy administration.2 Case volume studies in uterine cancer have focused on perioperative morbidity and mortality outcomes. Wright et al reported on bivariate analysis that lymphadenectomy was associated with increasing laparoscopic, but not abdominal hysterectomy volume for endometrial cancer.4,5 To our knowledge this is the first study to relate hysterectomy surgical volume to lymphadenectomy and chemotherapy administration in a multivariate analysis. Our results suggest that the quality of care received goes beyond the surgical episode.
A
uthor Man
uscr
ipt
A
uthor Man
uscr
ipt
A
uthor Man
uscr
ipt
A
uthor Man
uscr
We did note the seemingly low (41%) chemotherapy administration rate among non-endometrioid histology cases in our study. We hypothesize that this is mainly due to 2 factors: 1) the dates of study (2004 – 2009) correspond to the emerging literature on the benefits of chemotherapy in early-stage non-endometrioid uterine cancers17–22 and 2) guideline adherent care is usually less common than is perceived. For example, the 2013 statewide study by Bristow et al on ovarian cancer treatment patterns demonstrated that only 37% of patients received guideline adherent care, including only 50.8% at high-volume hospitals.23 Low rates of chemotherapy have also been observed and validated in other population-based studies of cancer including >30% of stage 3 colon patients who do not receive adjuvant chemotherapy despite clear recommendations.24
For uterine cancer patients requiring chemotherapy, Hybrid referral care models were common. Specifically, the phenomenon of a patient being referred from a Low-Volume area to a High-Volume center for surgery, then moving back to a Low-Volume area for adjuvant chemotherapy occurred in nearly 25% of patients. These patients tended to be those without private insurance, with higher comorbidity, and with later stage disease. These are all risk factors for poor outcomes and may represent the very patients with the most to gain from staying in a High-volume center for adjuvant treatment. Our results are preliminary. This was this was a crude regression model, unadjusted for covariates, as we did not have the sample size for a robust multivariate survival analysis. It is important, however, for gynecologic oncology providers to realize that after completing a patient’s initial surgery, post-operative referral for adjuvant chemotherapy may not result in the same quality of care as patients who are retained at High-Volume centers.
Our study addresses some of the factors associated with referral patterns to HV centers, but not all. Geography, in particular, may be a strong factor in referral. In studies of ovarian and endometrial cancer patients, those who live greater than 20 – 50 miles from HV centers are less likely to be treated at HV centers.5,25 In addition, we imagine that those patients who can overcome the travel distance may be willing to do so for an isolated treatment, like surgery, but not for ongoing care, as in the case of chemotherapy. However, rural patients are more willing to travel further distances for care26,27 and racial/ethnic minorities are more likely to live in close proximity to gynecologic oncologists.28 As such, it is critical to understand who stands to benefit the most from continued HV center care, to both invest resources to support continued travel for high-risk patients, while avoiding unnecessary travel burden for low-risk patients.
Our study has several limitations, many of which are consistent with registry-linked claims data29. First, we are limited to a single state, so our results may not be generalizable nationwide, although rates of uterine cancer in North Carolina are similar to SEER reports. Second, due to the inherent instability of Medicaid coverage,30 the majority of the Medicaid population had to be excluded due to a lack of 12 months of continuous claims. This limited our racial/ethnic minority population and significantly affected our ability to identify disparities in this group. Third, the comorbidity assessment incorporates both inpatient and outpatient information from Charleson and Elixhauser scoring systems, but still may underestimate comorbidities. Fourth, as we do not have specific medical record information, we do not know how many patients were actually referred by providers, but for other reasons
A
uthor Man
uscr
ipt
A
uthor Man
uscr
ipt
A
uthor Man
uscr
ipt
A
uthor Man
uscr
did not go to High-Volume centers. In addition, our definition of ‘referral’ is based on movement between zip codes, and not specific provider changes, which allows for a patient who undergoes biopsy and surgery by the same provider to be classified as a HV to HV or LV to LV ‘referral,’ rather than a non-referral. Fifth, we could not account for the possibility of discrepant histology results from biopsy compared to surgery. The literature suggests that among grade 1–2 biopsy results, upstaging to a grade 3 pathology occurs approximately 8% of the time31 which represents a small potential fraction of all patients. Finally, since our data were derived based on specific insurance enrollment, we were unable to include data from cancer patients who had interrupted coverage, who were covered on smaller private plans not included in our dataset, or who never had any insurance coverage during the study period. In North Carolina, the uninsured rates for ages 18 – 64 is at 22.5%32.
Overall, our study supports that with regard to the care of women with uterine cancer, referral patterns matter in treatment delivery and, possibly, survival. This is a cancer where the majority of diagnostic biopsies occur in the primary care or general gynecologists’ office. These providers are the gatekeepers for appropriate referral of high-risk patients for High-Volume specialty treatment. The centralization of cancer treatment should be patient-centered and risk-based. It is not all or none. Further work to elucidate the provider-level factors that lead to these referral patterns will be important in designing systematic interventions to align high-risk patients with appropriate, specialty care to improve patient outcomes.
Supplementary Material
Refer to Web version on PubMed Central for supplementary material.
Acknowledgments
Funding: The research reported in this publication was supported by the National Cancer Institute of the National Institutes of Health under Award Number R25CA116339, the North Carolina University Cancer Research Fund, and the Foundation for Women’s Cancer
The research reported in this publication was supported by the Foundation for Women’s Cancer, the National Cancer Institute of the National Institutes of Health under Award Number R25CA116339, and the North Carolina University Cancer Research Fund. The funding sources had no role in the design and conduct of the study; collection, management, analysis, and interpretation of the data; preparation, review, or approval of the manuscript; and decision to submit the manuscript for publication. The content is solely the responsibility of the authors and does not necessarily represent the official views of the National Institutes of Health.
References
1. Wright JD, Lewin SN, Deutsch I, et al. Effect of surgical volume on morbidity and mortality of abdominal hysterectomy for endometrial cancer. Obstet Gynecol. 2011; 117:1051–9. [PubMed: 21508742]
2. Wright JD, Hershman DL, Burke WM, et al. Influence of surgical volume on outcome for
laparoscopic hysterectomy for endometrial cancer. Annals of Surgical Oncology. 2012; 19:948–58. [PubMed: 21989660]
3. Chan JK, Sherman AE, Kapp DS, et al. Influence of gynecologic oncologists on the survival of patients with endometrial cancer. J Clin Oncol. 2011; 29:832–8. [PubMed: 21263082] 4. Wright JD, Neugut AI, Lewin SN, et al. Trends in hospital volume and patterns of referral for
women with gynecologic cancers. Obstet Gynecol. 2013; 121:1217–25. [PubMed: 23812455]
A
uthor Man
uscr
ipt
A
uthor Man
uscr
ipt
A
uthor Man
uscr
ipt
A
uthor Man
uscr
5. Gunderson CC, Tergas AI, Fleury AC, et al. Primary uterine cancer in Maryland: impact of distance on access to surgical care at high-volume hospitals. Int J Gynecol Cancer. 2013; 23:1244–51. [PubMed: 23899587]
6. Benjamin I, Dalton H, Qiu Y, et al. Endometrial cancer surgery in Arizona: a statewide analysis of access to care. Gynecol Oncol. 2011; 121:83–6. [PubMed: 21208650]
7. Burke WM, Orr J, Leitao M, et al. Endometrial cancer: a review and current management strategies: part II. Gynecol Oncol. 2014; 134:393–402. [PubMed: 24929052]
8. Burke WM, Orr J, Leitao M, et al. Endometrial cancer: a review and current management strategies: part I. Gynecol Oncol. 2014; 134:385–92. [PubMed: 24905773]
9. Practice Bulletin No. 149. Endometrial cancer. Obstet Gynecol. 2015; 125:1006–26. [PubMed: 25798986]
10. Uterine Neoplams. NCCN Clinical Practice Guidelines in Oncology. National Comprehensive Cancer Network. 2016
11. Meyer AM, Olshan A, Green L, et al. Big Data for Population-Based Cancer Research: The Integrated Cancer Information and Surveillance System. North Carolina Medical Journal. 2014; 75:265–268. [PubMed: 25046092]
12. Lund JL, Sturmer T, Harlan LC, et al. Identifying specific chemotherapeutic agents in Medicare data: a validation study. Med Care. 2013; 51:e27–34. [PubMed: 22080337]
13. Uterine Cancer North Carolina Central Cancer Registry Fact Sheets. North Carolina: State Center for Health Statistics; 2011.
14. YJ; SDR; LAGR, et al., editors. Codes and Coding Instructions. Bethesda, MD: National Cancer Institute; 2001. SEER Summary Staging Manual - 2000.
15. Parker, T. Rural-Urban Contiuum Codes. United States Department of Agriculture Economic Research Service; 2013.
16. Gagne JJ, Glynn RJ, Avorn J, et al. A combined comorbidity score predicted mortality in elderly patients better than existing scores. J Clin Epidemiol. 2011; 64:749–59. [PubMed: 21208778] 17. Gehrig PA, Morris DE, Van Le L. Uterine serous carcinoma: a comparison of therapy for
advanced-stage disease. Int J Gynecol Cancer. 2004; 14:515–20. [PubMed: 15228426] 18. Dietrich CS 3rd, Modesitt SC, DePriest PD, et al. The efficacy of adjuvant platinum-based
chemotherapy in Stage I uterine papillary serous carcinoma (UPSC). Gynecol Oncol. 2005; 99:557–63. [PubMed: 16154185]
19. Alvarez Secord A, Havrilesky LJ, Bae-Jump V, et al. The role of multi-modality adjuvant chemotherapy and radiation in women with advanced stage endometrial cancer. Gynecol Oncol. 2007; 107:285–91. [PubMed: 17688923]
20. Havrilesky LJ, Secord AA, Bae-Jump V, et al. Outcomes in surgical stage I uterine papillary serous carcinoma. Gynecol Oncol. 2007; 105:677–82. [PubMed: 17355889]
21. Fader AN, Drake RD, O'Malley DM, et al. Platinum/taxane-based chemotherapy with or without radiation therapy favorably impacts survival outcomes in stage I uterine papillary serous carcinoma. Cancer. 2009; 115:2119–27. [PubMed: 19306417]
22. Fader AN, Nagel C, Axtell AE, et al. Stage II uterine papillary serous carcinoma: Carboplatin/ paclitaxel chemotherapy improves recurrence and survival outcomes. Gynecol Oncol. 2009; 112:558–62. [PubMed: 19118888]
23. Bristow RE, Chang J, Ziogas A, et al. Adherence to treatment guidelines for ovarian cancer as a measure of quality care. Obstet Gynecol. 2013; 121:1226–34. [PubMed: 23812456]
24. Murphy CC, Harlan LC, Lund JL, et al. Patterns of Colorectal Cancer Care in the United States: 1990–2010. J Natl Cancer Inst. 2015; 107
25. Bristow RE, Chang J, Ziogas A, et al. Spatial analysis of adherence to treatment guidelines for advanced-stage ovarian cancer and the impact of race and socioeconomic status. Gynecol Oncol. 2014; 134:60–7. [PubMed: 24680770]
26. Baldwin LM, Cai Y, Larson EH, et al. Access to cancer services for rural colorectal cancer patients. J Rural Health. 2008; 24:390–9. [PubMed: 19007394]
A
uthor Man
uscr
ipt
A
uthor Man
uscr
ipt
A
uthor Man
uscr
ipt
A
uthor Man
uscr
27. Wheeler SB, Kuo TM, Durham D, et al. Effects of distance to care and rural or urban residence on receipt of radiation therapy among North Carolina Medicare enrollees with breast cancer. N C Med J. 2014; 75:239–46. [PubMed: 25046086]
28. Shalowitz DI, Vinograd AM, Giuntoli RL 2nd. Geographic access to gynecologic cancer care in the United States. Gynecol Oncol. 2015; 138:115–20. [PubMed: 25922191]
29. Hershman DL, Wright JD. Comparative effectiveness research in oncology methodology: observational data. J Clin Oncol. 2012; 30:4215–22. [PubMed: 23071228]
30. Dickson V. The challenge of churning. Insurers and states seek to ensure coverage continuity between Medicaid and private plans. Mod Healthc. 2014; 44:21–3.
31. Matsuo K, Opper NR, Ciccone MA, et al. Time interval between endometrial biopsy and surgical staging for type I endometrial cancer: association between tumor characteristics and survival outcome. Obstet Gynecol. 2015; 125:424–33. [PubMed: 25569000]
32. Cohen, R.; Martinez, M. Early release of estimates from the National Health Interview Survey, 2014. National Center for Health Statistics; 2015. Health insurance coverage.
A
uthor Man
uscr
ipt
A
uthor Man
uscr
ipt
A
uthor Man
uscr
ipt
A
uthor Man
uscr
Figure 1. Study Population
Detail of exclusions at the state registry and claims level.
A
uthor Man
uscr
ipt
A
uthor Man
uscr
ipt
A
uthor Man
uscr
ipt
A
uthor Man
uscr
Figure 2. Kaplan-Meier Survival Curves by Referral Care Model in All Chemotherapy Patients
Crude survival probabilities, starting from 6 months after diagnosis, for all patients who received chemotherapy after surgery, stratified by HV referral care model type. HV-All: Surgery and chemotherapy received at HV centers. HV-Hybrid: Surgery at HV center, Chemotherapy at LV center. HV469 None: Surgery and chemotherapy at LV center.
A
uthor Man
uscr
ipt
A
uthor Man
uscr
ipt
A
uthor Man
uscr
ipt
A
uthor Man
uscr
A
uthor Man
uscr
ipt
A
uthor Man
uscr
ipt
A
uthor Man
uscr
ipt
A
uthor Man
uscr
ipt
Table 1
Cohort Characteristics of Patients with Uterine Cancer Who Underwent Surgery at High and Low Volume Centers in North Carolina, 2004–09a
Characteristic All N = 2053 High Volume n = 1557 Low Volume n = 496 P
Age (y)b 66.5±12 66.2± 12 67.2± 13 0.106
20 – 49 172(8) 123(8) 49(10)
50 – 64 609(30) 492(32) 117(24)
65 – 75 732(36) 546(35) 186(38)
> 75 540(26) 396(25) 144(29) 0.006
Race and Ethnicity
White, Non-Hispanic 1,714(83) 1,308(84) 412(83)
Racial/Ethnic Minority 339(17) 255(16) 84(17) 0.771
Population Density of Residence County
Metroc >1,368(67) >1,082(69) >286(58)
Non-Metro 664(32) 464(30) 200(40)
Missingc ≤ 20 ≤10 ≤10 <.001
Insurance Payer
Medicare Only 1,096(53) 798(52) 298(60)
Private 896(43) 718(46) 174(35)
Medicaid 65(3) 41(3) 24(5) <.001
Year of Diagnosis
2004 337(16) 234(15) 103(21)
2005 371(18) 247(16) 124(25)
2006 339(17) 255(16) 84(17)
2007 363(18) 289(19) 74(15)
2008 417(20) 339(22) 78(16)
2009 226(11) 193(12) 33(7) <.001
Summary Stage
A
uthor Man
uscr
ipt
A
uthor Man
uscr
ipt
A
uthor Man
uscr
ipt
A
uthor Man
uscr
ipt
Characteristic All N = 2053 High Volume n = 1557 Low Volume n = 496 P
Regional 399(19) 306(20) 93(19)
Distant 111(5) 92(6) 19(4)
Missing/Unknownc ≤ 20 ≤10 ≥10 .009
Grade
1 793(39) 596(38) 197(40)
2 551(27) 421(27) 130(26)
3 592(29) 478(31) 114(23)
Unknown 117(6) 62(4) 55(11) <.001
Histology
Low-Risk 1,342(65) 999(64) 343(69)
High-Risk 711(35) 558(36) 153(31) 0.042
Comorbidity
0 1585 (77) 1219(78) 366(74)
≥ 1 468(23) 338(22) 130(26) .037
Biopsy before Surgery
No 418 (20) 295 (19) 123 (25)
Yes 1635 (80) 1,262 (81) 373 (75) .005
a
Information presented as No. (%) except where noted.
b
Presented as mean ± standard deviation
c
Values surppresed due to small cell size, as pursuant to the data use agreement
d
A
uthor Man
uscr
ipt
A
uthor Man
uscr
ipt
A
uthor Man
uscr
ipt
A
uthor Man
uscr
ipt
T ab le 2 Referral Pattern Group Characteristics: Biopsy
→
Sur
gery
, W
omen with Uterine Cancer in North Carolina, 2004–09.
a
Characteristic
All
b N=1575
HV ->HV n=605 L V ->HV n=652 L V ->L V n=318 P Age (y) c 66.7±12 66.1± 12 66.5± 12 68.5± 12 .007
20 – 49
113(7)
48(8)
43(7)
22(7)
50 – 64
483(31)
210(35)
201(31)
72(23)
65 – 75
555(35) 192(32) 241(37) 122(38) > 75 422(27) 155(26) 167(26) 102(32) .006
Race and Ethnicity
White, Non-Hispanic 1327(84) 517(85) 547(84) 263(83) Racial/Ethnic Minority 248(16) 88(15) 105(16) 55(17) .523
Population Density of Residence County
Metro 1054(67) 509(84) 365(56) 180(57) Non-Metro 521(33) 96(16) 287(44) 138(43) <.001 Insurance P ayer Medicare Only 840(53) 283(47) 353(54) 204(64) Pri v ate 693(44) 309(51) 286(44) 98(31) Medicaid 42(3) 13(2) 13(2) 16(5) <.001 Y
ear of Diagnosis 2004
A
uthor Man
uscr
ipt
A
uthor Man
uscr
ipt
A
uthor Man
uscr
ipt
A
uthor Man
uscr
ipt
Characteristic Allb N=1575
HV ->HV n=605 L V ->HV n=652 L V ->L V n=318 P 2007 275(17) 105(17) 129(20) 41(13) 2008 325(21) 124(20) 147(23) 54(17) 2009 186(12) 81(13) 80(12) 25(8) <.001 Grade 1 634(40) 261(43) 246(38) 127(40) 2 441(28) 165(27) 188(29) 88(28) 3 432(27) 160(26) 197(30) 75(24) Unkno wn 68(4) 19(3) 21(3) 28(9) <.001 Histology Lo w-Risk 1067(68) 417(69) 426(65) 224(70) High-Risk d 508(32) 188(31) 226(35) 94(30) .205 Comorbidity 0 1238(79) 496(82) 508(78) 234(74) ≥ 1 337(21) 109(18) 144(22) 86(26) .011
a All data presented as no. (%) unless otherwise noted. b Gi
v
en the small size of the L
V
-HV (n=50) group, co
v
ariate information is not presented due to resultant small cell size, as pursuant to the data use agreement.
c Presented as mean ± standard de
viation.
d High-Risk denotes Grade 3 and an
A
uthor Man
uscr
ipt
A
uthor Man
uscr
ipt
A
uthor Man
uscr
ipt
A
uthor Man
uscr
ipt
Table 3
Likelihood of Referral to a High-Volume Center following Initial Biopsy at a Low-Volume Center, Modified Poisson Regression
Factor aRR 95%CI
Age (by 1 yr) 1.00 0.99–1.00
Diagnosis Year
2004 Referent
2005 0.82a 0.67 – 1.00
2006 1.12 0.95 – 1.32
2007 1.23b 1.05 – 1.43
2008 1.17a 1.00 – 1.36
2009 1.23a 1.04 – 1.45
Race
White, NH Referent
Racial/Ethnic Minority 0.98 0.87 – 1.10
Population Density
Metro Referent
Non-Metro 0.99 0.90 – 1.07
Insurance
Any Private Referent
Medicare Only 0.92 0.81 – 1.03
Any Medicaid 0.64a 0.42 – 0.96
Comorbidity
≤0 Referent
≥1 0.98 0.87 – 1.09
Histology
Low-Risk Referent
High-Risk 1.14b 1.04 – 1.25
a p<.05,
A
uthor Man
uscr
ipt
A
uthor Man
uscr
ipt
A
uthor Man
uscr
ipt
A
uthor Man
uscr
ipt
T ab le 4Clinical and Demographic Characteristics by Referral Care Model T
ype in All Uterine Cancer P
atients Who Recei
v
ed Chemotherap
y
Characteristics
All N = 290
HV
-All n = 186
HV
-Hybrid n = 71
HV
-None n = 33
p-v alue Age Mean (SD) 68(10) 68(10) 69(10) 68(11) 0.703 ≥65 years 224(77) 138(74) 57(80) 29(88) 0.175
Race and Ethnicity
White, Non-Hispanic 218(75) 140(75) 56(79) 22(67) Racial/Ethnic Minority 72(25) 46(25) 15(21) 11(33) 0.406
Population Density of Residence County
Metro 187 (64) 123(66) 46(65) 18(55) Non-Metro 103(36) 63(34) 25(35) 15(45) 0.439 Insurance P ayer An y Pri v ate 95 (33) 69(33) ≥16(22) ≤10(30) Public Only a 195(67) 117(63) ≥47(66) ≥23(70) 0.066 Y
ear of Diagnosis 2004 – 07
128(44)
81(44)
26(37)
21(64)
2007 – 09
A
uthor Man
uscr
ipt
A
uthor Man
uscr
ipt
A
uthor Man
uscr
ipt
A
uthor Man
uscr
ipt
Characteristics
All N = 290
HV
-All n = 186
HV
-Hybrid n = 71
HV
-None n = 33
p-v
alue
Missing/Unkno
wn
≤10
--<.001
Comorbidity
≤0
219(76)
143(77)
56(79)
20(61)
1+
71(24)
43(23)
15(21)
13(39)
0.101
a Includes Medicare only
, Medicaid only
, and Medicare + Medicaid enrollees