DEBATING DEBATE:
MEASURING DISCURSIVE OVERLAP ON THE CONGRESSIONAL FLOOR
Kelsey Shoub
A thesis submitted to the faculty of the University of North Carolina at Chapel Hill in partial fulfillment of the requirements for the degree of Master of Arts in the Department of Political Science.
Chapel Hill 2015
Approved by:
Frank R. Baumgartner Justin H. Gross
ABSTRACT
KELSEY SHOUB: Debating Debate:
Measuring Discursive Overlap on the Congressional Floor (Under the direction of Frank R. Baumgartner.)
TABLE OF CONTENTS
LIST OF TABLES . . . v
LIST OF FIGURES . . . vi
Introduction . . . 1
Why Expect Overlap? . . . 2
Developing the Measure . . . 6
The Food, Conservation, and Energy Act of 2008 . . . 16
Overlap on Policies in the Farm Bill . . . 20
Discussion . . . 31
Appendix A: A Demonstrations of the Measures . . . 33
Appendix B: Coding Categories and Provisions . . . 36
Appendix C: Measuring Distinctiveness Between Partisan Speeches . . . 41
Appendix D: The Constructed List of Stop Words . . . 42
Appendix E: Levels of Overlap . . . 45
Appendix F: Instruction for Content Coding . . . 45
LIST OF TABLES
Table
1 Examining Overlap Between Example Sentences from the Congressional
Record . . . 11
2 Number of Policies Falling in Each Category by Chamber . . . 18
3 Average Number of Speeches and Words by Topic . . . 19
4 Number of Speakers by Topic . . . 20
5 Correlations Between Scores, Aggregated . . . 24
6 Setting the Null: Overall Scores & Bounds . . . 26
7 Frequency of Level of Discursive Overlap by Measure . . . 26
8 Overview of Content Validity Coding . . . 28
9 Overview of Content Validity Scores . . . 28
10 Comparison of Measures . . . 28
11 Overlap Between Moderate Speakers Greater than Between Extreme Speak-ers, % of Cases . . . 31
12 Examining Overlap Between Example Sentences from the Congressional Record . . . 33
LIST OF FIGURES
Figure
Introduction
Time and again researchers point to how language helps to shape the political environ-ment. Riker (1986) developed the idea of heresthetic. Policy histories and framing studies trace how the introduction and rates of use of frames influences policy outcomes by either directly shaping the opinions of elites or shaping by shaping public opinion and allow-ing it to rise up (for examples see Baumgartner, De Boef, and Boydstun 2008; Rose and Baumgartner 2013; Boydstun 2013; McCall 2013; Schaffner and Sellers 2010). Others still have looked at how the tone used in advertisements and stories in the media influences the publics perceptions of candidates, policies, government, and the media (for examples see Freedman and Goldstein 1999, Ridout and Franz 2008; Nelson, Clawson, and Oxley 1997; Druckman, Jacobs, and Ostermeier 2004). In a similar vein, some have examined how the use of technocratic, policy specific, and “fluff” language varies by representational style and the policy production process (Yackee and Yackee 2006; Hill and Hurley 2002; Grim-mer 2013). While these studies have further our understanding of how language influences outcomes, they have been generally limited to case studies or small-N analysis because a large-scale method to conduct such an analysis and a measurement to facilitate it has not been identified. Computerized text analysis or computer assisted text analysis open the doorway to beginning to empirically test old theories such as Riker’s heresthetic and begin to better incorporate how the use of agenda-setting and framing shape policy and political outcomes.
speeches (Maltzman and Sigelman 1996; Harris 2005; Morris 2001; Osborn and Mendez 2010; Gerrity, Osborn, and Mendez 2007; Pearson and Dancey 2011), the reflection of Fenno’s home-style versus Washington-style in floor speeches (Hill and Hurley 2002; Pol-letta 1998), or treat the speeches as a procedural tactic to delay legislation or lambaste the other party (Taylor 2012; Oleszek 2013; Smith 2014). Few scholars have attempted to leverage these speeches to understand party dynamics or to incorporate theories of framing, strategic communication, and signaling directly into the congressional literature. One major stumbling block in doing any of these is the lack of a large-scale method to conduct such an analysis. Computerized text analysis or computer assisted text analysis open the door to conducting this style of analysis.
In this paper, I do just that. I develop a method of measurement using cosine similarity scores to estimate and evaluate different measures that summarize the relationship between parties using the content and language contained within speeches delivered by each party on the floors of the US House and Senate. To test the appropriateness and validity of the measure, I compare and evaluate this approach with two measures that can be manipulated to provide a concise measure of discursive overlap. These are the overlap coefficient and variance inWordfish scores (Slapin and Proksch 2008). I use debate surrounding the 2008 Farm Bill as a case study to demonstrate practicability and to facilitate evaluation. Before leaping into a discussion of the potential measures, I first discuss why meaningful discursive overlap should be expected across floor speeches in the US House and Senate, provide a more developed conception and definition of overlap, and suggest an intuitive evaluation of what these scores should show.
Why Expect Overlap?
reflect the message of a “team.” Distinct individual messages are characterized by a lack of coordination between speakers, while “team” communications and speeches are anchored to a coordinated message. One way to summarize the relational content of the messages is to determine the extent to which each speaks to each other or past each other; and the extent to which the messagesoverlap on key dimensions. Here I demonstrate that House and Senate floor speeches can be considered “team” messages by each party, and introduce face value expectations of how the output of each measure should behave based on these motivations. Additionally, I unpack the concept of overlap into its composite parts – frame usage, topics discussed, and use of technocratic language.
Both the House and Senate allow for floor speeches. However, different rules govern the delivery of speeches in each and different types of speeches are allowed in either cham-ber. In the House, members can give one-minute speeches, five-minute speeches, deliver speeches during “unconstrained” floor time, enter into debate, or make procedural motions. In the Senate, members debate specific pieces of legislation to greater extent than their counterparts in the House, may filibuster, deliver speeches during its “unconstrained” time, or make procedural motions (Oleszek 2013 ). The specifics of how to gain floor time dif-fers in each chamber and the process to curtail debate on a bill or amendment difdif-fers as well. One issue that comes out of this diversity of speech types is that different levels of coordination may take hold of each one.
nature of floor time (Taylor 2012; Oleszek (oleszek2013congressional)). Third, everything is recorded in the Congressional Record, which is then published on-line (Oleszek 2013). On a practical front this makes data collection relatively easy. On a theoretical front this means that they serve as a permanent signal to whoever the intended audience is. In sum, these floor speeches are coordinated efforts clearly meant to signal to some audience some message.
These goals are preserved but slightly reoriented when aggregated up to the party as a whole. The party strives to hold the majority and fulfill varying policy goals in line with the party message (Aldrich 2011; Mayhew 1974). Taken together then, the nature of floor debate and the goals of the party provide the theoretical assumption that discursive overlap between floor speeches should be understood by treating speeches as competitive team messaging. Additionally, the extent of overlap should vary depending on the bill, issue, or policy being discussed based on the broader relationship parties have with different bills and issues resulting in different levels of overlap based on movement along various dimensions.
What is Discourse Overlap?
the names of either pro/anti-lifeorpro/anti-choice.
Second, discussion of the topic and associated cluster of topics may be common throughout the debate. Using the same example of the abortion debate, think of what other issues, topics, or policies the parties bundle with or attach to the abortion debate. The Republicans may partner heart beat bills and ensuring no government money goes to-wards facilities performing abortions. Democrats may talk about complications and safety. However, both defacto discuss abortion. They discuss the topic within different framing dimensions, but engage within the same topic.
Third, shared technical language is prevalent in any professional community. Techno-cratic language comes in two varieties: substantive which distinguishes specific issue areas and procedural that distinguishes different professions. Depending on the corpus, techno-cratic language endemic to the profession may produce noise that must be filtered out. In other cases, this may provide a necessary filter such that a machine or human reader could easily sort speeches into categories. Here I will filter out this mover of overlap through the corpus construction and the construction of a unique list of stop words that includes such terms as “quorum.”
Developing the Measure
Translating text as qualitative data into quantitative data has a long history in many disciplines, where applications of such methods range from the development of search en-gines to plagiarism software to studies of social movements. Within political science, large scale quantitative text analysis has gained increasing amounts of attention with the inclu-sion of new techniques (Slapin and Proksch 2008; Laver, Benoit and Garry 2003; Quinn, Monroe, Colaresi, Crespin, and Radev 2010) and applications (Grimmer, Westwood, and Messing 2014; Kl¨uver 2009; Kl¨uver 2013; Hill and Hurley 2002; Polletta 1998; Grimmer 2013).1 Each of the methods incorporated into and developed for our discipline confront a different set of limitations. Some of these are beneficial to the identification of a method of estimating overlap; others are hurtful. However, almost all of this literature and many of its applications simply seek to categorize documents, not extract meaning from the con-tent. For the purposes of this measurement project, three questions emerge. First, what assumptions and processes underlie text analysis in a computer based process? Second, what are the desirable qualities a measure of discursive overlap should contain that can be distilled from previous work in relation to the stated goal of this project? Third, which of the preexisting methods could be directly used or amended to be used for this purpose?
To the first question, the base principles of large N quantitative text analysis and the basic approaches must first be addressed Grimmer and Stewart (2013). In conjunction with the goal of this paper – settling on a measure of the extent of overlap in speech in policy debate – four desired qualities and base principles emerge. The first principle underlying quantitative text analysis is that virtually no models of language reflect how it is actually constructed. While this may appear to be an undesirable quality, text analysis cannot get off of the ground without it. Here I make the standard “bag of words” assumption that
pays attention to the distribution of word frequencies and notword order. The second is that computers assist and augment but do not replace humans in the text analysis enterprise (Grimmer and Stewart 2013; Gross, Shoub, Tyner, and Sentementes N.d.). This principle is seen in almost every political science enterprise by the fact that almost all studies use some degree of human-computer iterated interface. Third, there is no universally “best option” for text analysis at this point in time; design and implementation should be driven by theory, the type of documents being used, and the construction of the corpus (Grimmer and Stewart 2013). This has led to the continued use of hand-coding, by computer from a dictionary, or supervised auto-coding. Here I use a dictionary of words relevant to specific policies contained within the 2008 Farm Bill and use QDA Miner to automatically tag all documents that contain those words. Finally, given the lack of a best option and only loose best practices, everything needs to be validated time and again (Grimmer and Stewart 2013; Gross, Shoub, Tyner, and Sentementes N.d.).
As with the introduction of any new measure, some standards and desired qualities should be listed to constrain the range of measures to be tested. Here these qualities maxi-mize the flexibility and usability. Flexibility and usability roughly translate to the inclusion of the greatest number of documents and the ability to relatively quickly include additional or new information or documents. To be considered as a candidate measure, it needs to have four characteristics:
1. the measure will not rely on training documents to produce scores;
2. the method of measurement will produce a single statistic to facilitate incorporation into statistical models;
3. the measure will require only limited human input code from the requisite documents to produce the measure;
4. and the method of measurement will allow for comparison against a null rate of usage.
With respect to the final question posed in this section – what preexisting measures may be adapted for this – I walk through three measures that may be adapted to capture discursive overlap. These are overlap coefficients, variance inWordfishscores, and cosine similarity scores. I conclude that cosine similarity scores best fulfill the qualities of a desired measureandbest capture the moving parts underlying discursive overlap.
views of the parties and individuals based on their use of language? To answer this question while satisfying the already laid out “desired qualities,” I take the variance of theWordfish scores (Slapin and Proksch 2008) to estimate how varied opinions on a given policy are by chamber.2 Third, the problem could be phrased as: how far away are the parties from each other on a given policy in a multidimensional space? One common measure aimed to answer this question is a simple cosine similarity. All of these simply assess the amount of similar language in two documents or two sets of documents by taking vectors of term frequencies. As a result, variation between the measures results from what compilation of speeches the term-vector is produced and the actual mathematical formula used. In the re-mainder of this section, I briefly expand on what each of these measures are and highlight what they are actually capturing.
Cosine Similarity
Cosine similarity is the basic metric that underlies such tools as plagiarism software and search engines. For the former, this is used to estimate the degree of similarity between a given paper and the universe of documents in a designated corpus. High scores translate to high levels of plagiarism whereas low scores translate to a unique paper. For the latter, this is used to rank how relevant search returns are given the search terms used. High scores indicate that a document is more relevant to the search terms, while low scores indicate low or no relevance. Here the cosine similarity function would indicate how closely the language the two parties use match up given a set of documents associated with each other. Essentially, the cosine similarity function itself assesses the amount of similar language in two sets of documents. The researcher provides vectors of word counts or frequencies,
which means the key to extracting a meaningful score is in the preparation of the documents to be compared. Here instead of assuming a specific distribution that the terms are drawn from this measure does not make a distributional assumption. Rather, it simply measures the angular distance between two speakers. Equation 1 shows how the similarity metric is calculated on the two vectors. Vectors that contain no shared language appear to be at a perfect90 degresulting in a score of 0, which is the functional minimum value. Vectors that contain identical relative term use result in a0 degangle between the vectors and a score of 1, which is the maximum value. The intuition underlying this measure is similar to that of the overlap coefficient because both measures co-occurrence at their most basic level.
cos(θ) = A·B
kAkkBk =
n P
i=1
Ai×Bi
r n P i=1
(Ai)2×
r n P i=1
(Bi)2
(1)
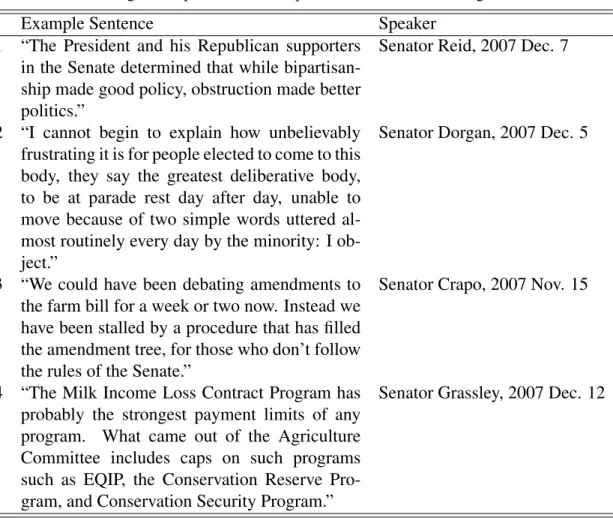
Table 1: Examining Overlap Between Example Sentences from the Congressional Record
Example Sentence Speaker
1 “The President and his Republican supporters in the Senate determined that while bipartisan-ship made good policy, obstruction made better politics.”
Senator Reid, 2007 Dec. 7
2 “I cannot begin to explain how unbelievably frustrating it is for people elected to come to this body, they say the greatest deliberative body, to be at parade rest day after day, unable to move because of two simple words uttered al-most routinely every day by the minority: I ob-ject.”
Senator Dorgan, 2007 Dec. 5
3 “We could have been debating amendments to the farm bill for a week or two now. Instead we have been stalled by a procedure that has filled the amendment tree, for those who don’t follow the rules of the Senate.”
Senator Crapo, 2007 Nov. 15
4 “The Milk Income Loss Contract Program has probably the strongest payment limits of any program. What came out of the Agriculture Committee includes caps on such programs such as EQIP, the Conservation Reserve Pro-gram, and Conservation Security Program.”
Senator Grassley, 2007 Dec. 12
Overlap Coefficient
When searching for a measure that allows for the estimation of discursive engagement, one possible avenue is to treat the problem like any other comparison of populations. For this problem, the populations are bodies of speeches, and counts of species are term fre-quencies. This measure, the overlap coefficient, originated in biology and ecology as a method to compare populations. Outside of these fields, it is gaining recognition as a way to capture co-occurrence between objects of populations and is used to judge how closely connected two entities are; especially in the fields of computer science and linguistics.3 I use the overlapEst command in the overlap package which is based around the (Schmid and
Schmidt 2006) conceptions of the measure. Here what I hope this will tell me is to what extent two parties relate to each other on a given policy given the rate of language usage.
To further motivate the use of this measure, imagine that a spokespeople from the CATO institute, the Heritage foundation, Brookings, and the AFL-CIO came out to give statements on a proposal to raise the federal minimum wage. Taking those statements, the relationship between them can be extracted in two ways. First, a priori we know that there should be a relationship between them such that the CATO Institute and Heritage Foundation messages resemble each other more so than the statements by Brookings and the AFL-CIO and vice-versa. Second, the overlap coefficient scores should reflect this. They would do this by taking vectors of term frequencies for each of the messages and in put those vectors into the overlap coefficient formula.
To compare a message delivered by Brookings to one delivered by CATO, each mes-sage would be processed, and the output would be two vectors – one for each mesmes-sage – containing counts of word occurrences as each observation. These would be vectorsXand
Y. The equation then takes the intersection of the two vectors and this is then divided by the size of the length of the smaller vector. Equation 2 shows this:
overlap(X, Y) = |X∩Y|
min(|X|,|Y|) (2)
The output of this function is a score falling between 0 to 1. The function used produces up to three output scores; each calculated using a slightly different underlying score. I focus on the first of these three scores, because it is the simplest and purest of the formulas.
Wordfish
word counts or frequencies for individual documents or by speaker.4 Then these vectors are used to fit a Poisson regression with an EM optimization algorithm. This is seen in equations 3 and 4, where overall rate of use isλ, loquaciousness of an individual i is denoted αi, frequency with which word jis used isφj, the extent of discrimination by word in the underlying space is denotedβj, and the underlying position isθi:
yij ∼P oisson(λij) (3)
λij = exp(αi + φj + βj ∗ θj) (4)
With the fitted regression, policy positions are then estimated in a uni-dimensional space. One benefit to this method is that because they use an IRT approach Slapin and Proksch (2008) were able to include measures of uncertainty for the estimated policy positions. This is done with a parametric bootstrap.
In its standard form, Wordfish produces a single estimate for each document. While this is helpful for those estimating positions out of party manifestos or single statements on a given policy, it is less useful when estimating the distance or overlap between parties on a given policy. To transform the multitude of scores that result for a given topic if each speaker is attributed a score, two relatively standard approaches could be taken. First, the mean or median of the scores for each party could be used to represent the party’s score and then the two scores can be subtracted from one another to ascertain distance. This is less than satisfactory because this really captures distance in policy positions rather than overlap. Second, the variance of the scores could be calculated. Taking all speeches together the variance will be 1 by construction. However, calculating the scores all together and then taking the variance of speeches within each chamber results in an estimate of how
varied the speech is. This is because language is used to calculate the scores. The greater the shared language, or greater discursive overlap, then the closer together the scores will be. Translated into variance this mean increased overlap will be reflected in lower levels of variance. The inverse indicates greater variance and less overlap.
To build an intuition about this measure, take the following three statements on threat-ened shutdown of the Department of Homeland security during February 2015. These statements are:
• “If they send over a bill with all the riders in it, they’ve shut down the government. Were not going to play games,” Senate Minority Leader Harry Reid (February 25, 2015 in a Press Conference)
• “It is not a fight among Republicans. All Republicans agree we want to fund the De-partment of Homeland Security and we want to stop the presidents executive actions with regard to immigration,” Speaker of the House John Boehner (February 28, 2015 in a Press Conference)
• “Since the beginning of this debate, I have said that I would never vote to fund some-thing I believed to be unconstitutional, even for one day. I kept that promise by voting against a bill that funded the president’s illegal executive actions on amnesty. ... I pledge to continue this fight,” Rep. Matt Salmon, R-Ariz. (February 27,2015 in a Press Release)
From Corpus to Score
The basic process by which scores are calculated is the same for each of these measures and the process by which the term-vectors used in those calculations is the same. Here is a brief overview of the process. For a more detailed discussion of the process, see Ap-pendices A and C. First, a corpus of individual speeches or messages is collected. These speeches are associated with specific speakers and parties. Second, the speeches are coded by policy. Then on a policy by policy basis, the speeches are extracted from the corpus and aggregated by speaker. The counts of the phrases each speaker used in his or speech on a given policy are then taken. For the cosine similarity scores and overlap coefficients, these are aggregated up to party. For theWordfish scores, these are left on a speaker by speaker basis. The overlap scores are then calculated on the resulting vectors.
resulting scores, qualitatively what may be moving those scores, and a check on the validity of these measures by looking at relational scores based on comparisons between different groups.
The Food, Conservation, and Energy Act of 2008
To test and evaluate the proposed measure, I have chosen to center the analysis on the Food, Conservation, and Energy Act of 2008, which is the 2008 edition of the Farm Bill. I chose the farm bill as the case for testing the development of the measure, because it contains policy areas, which can be identified as topics, subtopics, and examples in floor speeches.5 Additionally, it allowed for the quick capture of policies that were subject to varying levels of publicity, generated differing levels of contention, and affects almost every American in some way. On the practical front, it occurred in a time period that the data was already collected, cleaned, and contained speaker identification information (Nguyen, Boyd-Graber and Resnik 2013).6 This section provides an overview of the legislative history of this particular farm bill, further justification as to why the use of this bill is acceptable, and provide basic descriptive statistics of the speeches (or lack of speeches) on individual policies contained within the bill.
The 2008 Farm Bill was introduced in the House on May 22, 2007 and in the Senate on September 4, 2007. The House passed the bill on July 27, 2007; the Senate passed it on December 14, 2007. Given discrepancies in the bills, the bill was sent to a conference com-mittee. During this process, a number of the programs governed by the farm bill were due to run out of funding (e.g. peanut subsidies). As a result, legislators secured supplemental
5Breaking the bill into its composite policies rather than as a single entity is a departure from the typical treatment of policies, issues, and legislation. By doing this, I hope to underscore different ways we may be able to conceptualize policy change, bargaining, and outcomes in an age where the omnibus bill is a major vehicle for such actions.
funding by attaching amendments to a bill funding the armed forces. Once passed out of conference, the unified bill was heard and passed in both chambers in mid-May. President Bush promptly vetoed the bill. Both chambers in turn promptly voted to override the veto at the end of May. Many of the debates, policies, and frames that surfaced throughout this process came back in the lead up to the vote on the stimulus package (CQ Almanac 2008; Food, Conservation, and Energy Act 2008).
The content of the bill spanned 14 broad topical areas as clustered by Congressional Quarterly and included 95 individual policies. The 14 areas were: commodities, commod-ity futures, conservation, credit, crop insurance, energy, forestry, horticulture and organic agriculture, livestock, nutrition, research, rural development, taxes, trade, and miscella-neous policies and programs. Examples of the individual policies were food stamps (or the Supplemental Nutrition Assistance Program), disaster aid, and ethanol subsidies. For a full list, see Appendix B. The range of topics and policies provided a microcosm of the broader legislative environment to be studied, where a variety of program are clustered together, action to change a policy must be selective (or even strategic), and the individual policies vary in cost, salience, and scope.
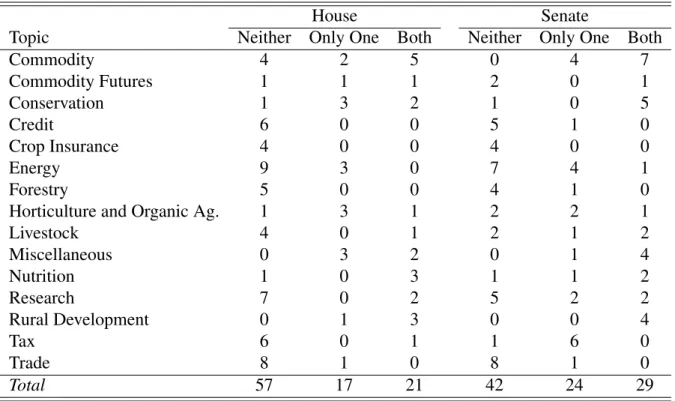
Of these topics, both parties gave speeches on an aggregated 33 policies across 10 top-ics. Table 2 shows the distribution of how many policies both parties, only one party, or neither party discussed on the House or Senate floor. The remainder of this paper focuses on those 21 policies in the House and 29 policies in the Senate that both parties spoke to. These speeches were identified through a series of searches in the master corpus of cleaned speeches obtained from Nguyen, Boyd-Graber and Resnik (2013). Each search consisted of the key terms associated with each policy. For example, the search to identify speeches on or referring to food stamps was “food stamps OR food stamp OR electronic benefit transfer OR supplemental nutrition assistance program.”7 As can be seen, not all topics receive at-tention from either party, a collection receive atat-tention from only one of the parties, and the
smallest collection receive attention from parties.
Table 2:Number of Policies Falling in Each Category by Chamber
House Senate
Topic Neither Only One Both Neither Only One Both
Commodity 4 2 5 0 4 7
Commodity Futures 1 1 1 2 0 1
Conservation 1 3 2 1 0 5
Credit 6 0 0 5 1 0
Crop Insurance 4 0 0 4 0 0
Energy 9 3 0 7 4 1
Forestry 5 0 0 4 1 0
Horticulture and Organic Ag. 1 3 1 2 2 1
Livestock 4 0 1 2 1 2
Miscellaneous 0 3 2 0 1 4
Nutrition 1 0 3 1 1 2
Research 7 0 2 5 2 2
Rural Development 0 1 3 0 0 4
Tax 6 0 1 1 6 0
Trade 8 1 0 8 1 0
Total 57 17 21 42 24 29
Who Speaks & How do they Differ?
essentially equal floor time is awarded to both parties? For the time being, these questions are bracketed. However, they do point to questions that should be answered in the future.
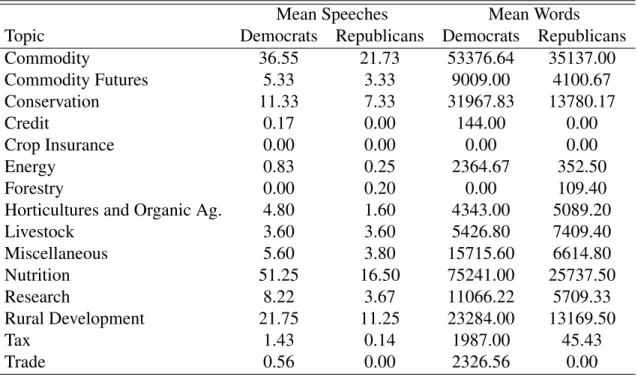
Table 3:Average Number of Speeches and Words by Topic
Mean Speeches Mean Words
Topic Democrats Republicans Democrats Republicans
Commodity 36.55 21.73 53376.64 35137.00
Commodity Futures 5.33 3.33 9009.00 4100.67
Conservation 11.33 7.33 31967.83 13780.17
Credit 0.17 0.00 144.00 0.00
Crop Insurance 0.00 0.00 0.00 0.00
Energy 0.83 0.25 2364.67 352.50
Forestry 0.00 0.20 0.00 109.40
Horticultures and Organic Ag. 4.80 1.60 4343.00 5089.20
Livestock 3.60 3.60 5426.80 7409.40
Miscellaneous 5.60 3.80 15715.60 6614.80
Nutrition 51.25 16.50 75241.00 25737.50
Research 8.22 3.67 11066.22 5709.33
Rural Development 21.75 11.25 23284.00 13169.50
Tax 1.43 0.14 1987.00 45.43
Trade 0.56 0.00 2326.56 0.00
Table 4:Number of Speakers by Topic
Topic Extreme D. Moderate D. Moderate R. Extreme R.
Commodity 39 99 29 83
Commodity Futures 9 25 3 16
Conservation 18 29 2 30
Credit 0 0 0 0
Crop Insurance 7 23 3 8
Energy 0 1 0 2
Forestry 0 0 0 0
Horticultures & Organic Ag. 4 10 2 5
Livestock 2 10 2 7
Nutrition 25 47 7 29
Research 13 31 5 23
Rural Development 13 20 3 16
Tax 0 3 1 0
Trade 0 0 0 0
Miscellaneous 4 12 5 10
Overlap on Policies in the Farm Bill
Examining Overlap Scores
Score
Frequency
0.0 0.2 0.4 0.6 0.8 1.0
0 2 4 6 8 10
(a) Overlap Coefficient Scores (N = 24)
Score
Frequency
0.0 0.5 1.0 1.5 2.0
0 2 4 6 8 10
(b) Variance in Wordfish Scores (N = 13)
Score
Frequency
0.0 0.2 0.4 0.6 0.8 1.0
0 2 4 6 8 10
(c) Cosine Similarity Scores (N = 24)
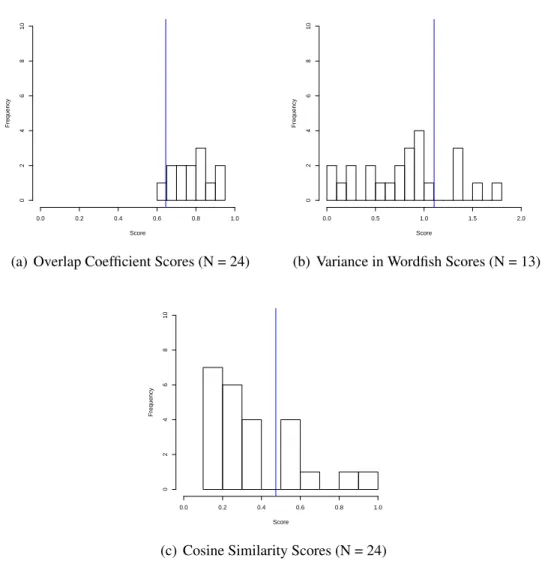
Fig. 1:Frequency of Scores by Policy in the House
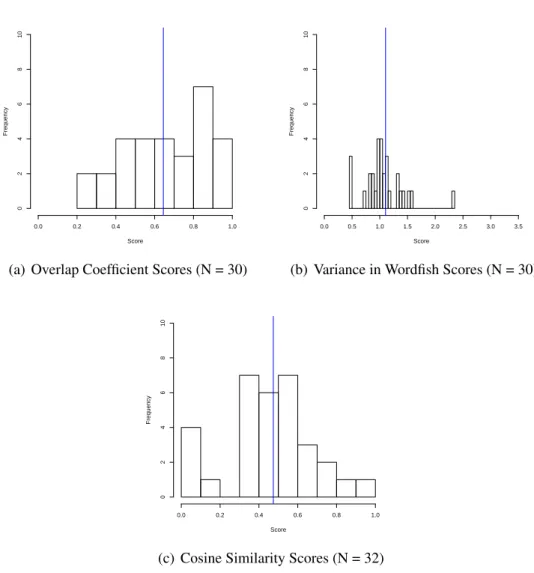
I estimated the three measures for both the House, the Senate, and an aggregated score including all speeches given in both the House and the Senate. The distribution of the scores are seen in Figures 1, 2, and 3. These distributions can be used to do three things. First, they visually present differences between the output of the different measures. Second, they provide an early face validity check by providing a visual placement of the scores, so that they may be compared between chambers of Congress. Third, they underscore comparative limitations among the scores.
Score
Frequency
0.0 0.2 0.4 0.6 0.8 1.0
0 2 4 6 8 10
(a) Overlap Coefficient Scores (N = 30)
Score
Frequency
0.0 0.5 1.0 1.5 2.0 2.5 3.0 3.5
0 2 4 6 8 10
(b) Variance in Wordfish Scores (N = 30)
Score
Frequency
0.0 0.2 0.4 0.6 0.8 1.0
0 2 4 6 8 10
(c) Cosine Similarity Scores (N = 32)
Fig. 2:Frequency of Scores by Policy in the Senate
Score
Frequency
0.0 0.2 0.4 0.6 0.8 1.0
0 2 4 6 8 10
(a) Overlap Coefficient Scores (N = 31)
Score
Frequency
0.0 0.5 1.0 1.5 2.0 2.5 3.0 3.5
0 5 10 15 20 25 30
(b) Variance in Wordfish Scores (N = 32)
Score
Frequency
0.0 0.2 0.4 0.6 0.8 1.0
0 2 4 6 8 10
(c) Cosine Similarity Scores (N = 35)
Fig. 3:Frequency of Scores by Policy, Aggregated
scores present the opposite tendency. One reason for this may be that overlap coefficients lend themselves more to the development and analysis of networks, which is one of its implementations in computer science and computational linguistics. In sum, this provides a visual hint that these different scores are leveraging different aspects of the text and are most likely reacting to different aspects of the texts.
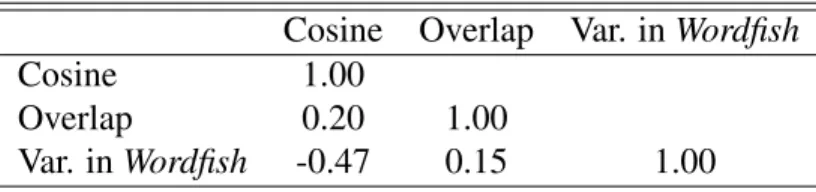
A clearer picture of this difference in scores and another indication that these scores are “reacting” to different characteristics in the corpus can be seen in table 5. This table shows the correlations between the scores produced by the aggregated term frequencies by party. The variance in Wordfish scores should be inversely related to both the cosine scores and overlap scores. This is only seen in the relationship between the Wordfish scores and the cosine similarity. Additionally, the only two scores that results in a moderate correlation is that between the Wordfish scores and the cosine similarity scores. This indicates that the scores relating discursive overlap are only moderately related to one another. With this I have a strong indication that a more detailed analysis of the content of the speeches in relation to these scores must be conducted. The first part of this analysis is establishing and comparing levels of overlap identified by the scores.
Table 5:Correlations Between Scores, Aggregated
Cosine Overlap Var. inWordfish
Cosine 1.00
Overlap 0.20 1.00
Var. inWordfish -0.47 0.15 1.00
Discerning Levels of Overlap
is.8 Additionally, there is no default null level of overlap that estimates the expected overlap given both parties speaking on the same topic versus constructed low levels of overlap and purposeful high levels of overlap. To establish levels of overlap, I established a null value indicative of “moderate” overlap. This was the overall discursive overlap scores for each measure using the entire corpus (all speeches given during the 110th Congress). Additionally, I bootstrapped confidence intervals around these scores to establish the range that a score may fall in to be considered as moderate or not different from the null. I classified scores outside of the confidence interval and below this as low levels of discursive overlap and scores outside of the confidence interval and above this as reflective of high levels of discursive overlap. Scores falling within the confidence interval but either below or above the mean score are referred to as either low or high but not distinct.9
Table 6 shows the null score and null range of scores for each measure established using al the speeches delivered in the 110th Congress, or in 2007 and 2008. As can be seen, the numeric values vary between each. As previously discussed, the variance inWordfish scores at the aggregated level is engineered to be 1. Additionally, as discussed earlier in this section, the scores are not on a standard scale. These null values and ranges are treated as moderate levels of discursive overlap.10
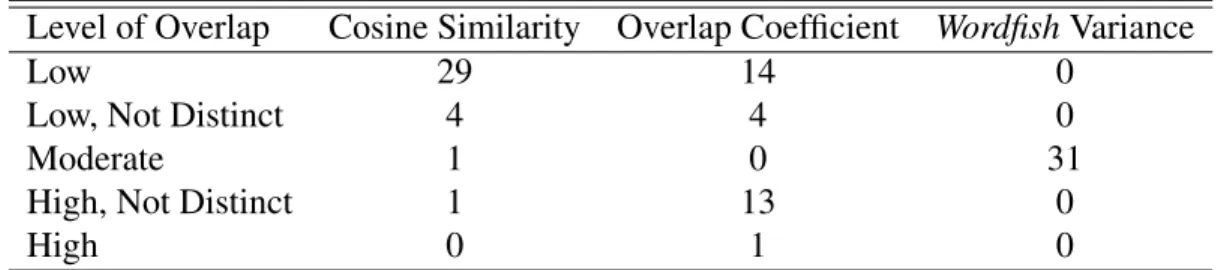
Table 7 shows the distribution of scores falling into each of the categories denoting low, low but not distinct, moderate, high but not distinct, and high levels of overlap by measure. Speeches on the identified policies saw relatively low levels of overlap. For both the cosine similarity scores and overlap coefficients, over 50% of the policies fell into either the low overlap or low but no statistically distinct from moderate overlap. Between the three measures, only one resulted in statistically significant high levels of overlap. This
8This discussion distinguishes levels of discursive overlap between the comparison of speeches that are realistically already reflections of high levels of overlap. This is because both parties delivering speeches on the same topic is indicative of great concern over change already.
9For a more extensive conversation on how this was done, see appendix D
seemingly low level of overlap on average is most likely reflective of the highly contentious nature of the farm bill in 2008. In a future study or extension of this study, I shall closely examine debate surrounding a bill and its parts that fostered greater compromise within the Halls of Congress to see whether these methods may also extract that information and reflect that context. With the level of discursive overlap discussed, I now turn toward how the composite parts of discursive overlap relate to the scores.
Table 6: Setting the Null: Overall Scores & Bounds
Lower Bound Score Upper Bound
Cosine 0.82 0.88 0.92
Overlap Coef. 0.75 0.75 0.75
WordfishVar. N/A 1 N/A
Table 7:Frequency of Level of Discursive Overlap by Measure
Level of Overlap Cosine Similarity Overlap Coefficient WordfishVariance
Low 29 14 0
Low, Not Distinct 4 4 0
Moderate 1 0 31
High, Not Distinct 1 13 0
High 0 1 0
The Content of the Overlap
I then address how the measures react to the different aspects of discursive overlap – shared frame usage and shared topic usage – by comparing the measures to the results coming from the hand-coded documents.
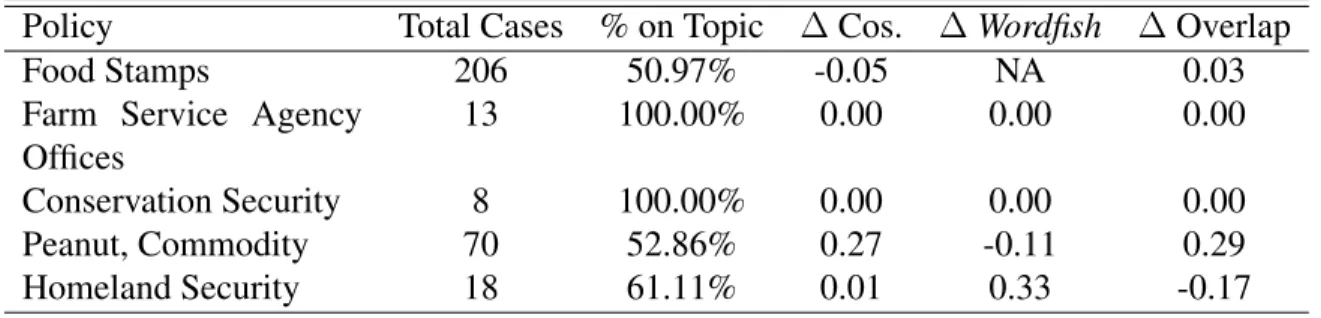
At first glance, the initial coding of the documents to be used for this analysis did not fare too well (Table 8). In only two of the five cases were all observations discussing the farm bill. The low rate for the discussion surrounding food stamps is attributable to the tendency of politicians to discuss social welfare programs using the same frames and language. During this time period, this was exacerbated by first the debate to raise the minimum wage and then the recession. As a result, while these were misses when in terms of the farm bill, they were true hits for discussion on food stamps. The low hit rate for peanut commodity are due to a salmonella outbreak in peanut butter that occurred during this Congress. Finally, homeland security had a low hit rate as well for a myriad of reasons, none being the sole cause. However, the true harm introduced by accidentally including these speeches is judged by to what extent they influenced the cosine similarity score. I recalculated the scores using only the cleaned sets of documents. It appears that the cosine similarity scores are relatively robust to the inclusion of documents that are not directly addressing the designated law. Further study on broader reliability and robustness needs to be conducted. This is because at this point only five policies have been examined, and only the author has examined them.
To discern what the content overlap was attributable to, I isolated the three movers of discursive overlap – shared frame usage, common topic of discussion, and use of techno-cratic language – put forward in the definition. By using a unique list of stop words11 and constructing the sets of documents to be compared in such a way that language should be held common. Thus while I coded for use of technocratic language, no relationship be-tween that coding and the scores should emerge. Additionally, by constructing the corpii
used to calculate discursive overlap scores for each policy in this way, the relationship be-tween topics discussed and the scores should be moderate but not strong. As a result, the best indicator should be shared frame usage.
Table 8:Overview of Content Validity Coding
Policy Total Cases % on Topic ∆Cos. ∆Wordfish ∆Overlap
Food Stamps 206 50.97% -0.05 NA 0.03
Farm Service Agency Offices
13 100.00% 0.00 0.00 0.00
Conservation Security 8 100.00% 0.00 0.00 0.00
Peanut, Commodity 70 52.86% 0.27 -0.11 0.29
Homeland Security 18 61.11% 0.01 0.33 -0.17
Table 9: Overview of Content Validity Scores
Policy Frame Corr. Provision Corr. %, Technocratic Language
Conservation Security 0.57 0.65 12.50%
Farm Service Agencies 0.72 0.64 38.46%
Food Stamps 0.93 0.92 28.16%
Homeland Security 0.25 0.46 55.55%
Peanuts Commodity 0.34 0.82 4.29%
Table 10: Comparison of Measures
Measure Frame, Corr Topic, Corr Frame, Reg Topic, Reg
Cosine Sim., Old 0.89 0.86 0.79 0.74
Var. in Wordfish, Old N/A N/A 0.56 0.56
Overlap Coef., Old 0 0.48 0 0.23
Cosine Sim., New 0.93 0.52 0.87 0.27
Var. in Wordfish, New N/A N/A 0.56 0.56
Overlap Coef., New 0 0.14 0 0.02
To leverage these frame usage and topic usage comparisons as an evaluative tool, I used standard processes to extract how well or badly the measures track with the measures of shared frame and topic use. I first correlated the scores from the overlap measures with the topic and frame scores for each policy to test whether they move together. Then, I regressed the scores on the correlations to test whether movement in either shared frame or topic usage results in a similar movement in the overlap scores; this is indicated by high R2. A summary of this is seen in Table 10. A high level of correlation (near 1 for either the cosine similarities or overlap coefficient or -1 for the variance inWordfishscores) means that the parties used frames at similar rates. A low level of correlation means that the parties used distinctly different frames. This was done with both the original scores and the corrected scores. The overlap coefficient scores do not seem to relate to either frame or topic use. Variance in theWordfish scores seems to react to frame usage in the original scores and to topic usage when corrected. Finally, the cosine similarity scores originally showed high levels of response for both categories, but only for frame usage in the updated scores. Second, I regressed the measures on frame usage and topic usage to estimate how much variance in the measure is explained by shared usage. The results for this portion are very similar to that of the correlations.
Factions & Within Party Variation in Overlap
One final baseline validity check on the measures is in order. We theorize and observe that different levels of discursive overlap should arise between different subgroups. While there are many these comparisons that could be made, I will focus on the “easiest” of those. The easiest case is simply by comparing discursive overlap scores between the discourse put forward by the extremists in each party to the discourse put forward by the moderates. Here I define extremist as anyone who falls in the most extreme quartile of each party’s DW-Nominate scores. A moderate is anyone else. The expectation is that a measure that appropriately reflects reality will show greater overlap when the discourse of moderates is compared than when the discourse of extremists is compared. Additionally, this should hold for either chamber or the aggregation of the two.
Table 11:Overlap Between Moderate Speakers Greater than Between Extreme Speakers, % of Cases
Measure Aggregate House Senate
Cosine 100 73 100
WordfishVariance 86 36 46
Overlap 0 50 50
Discussion
The goal of this enterprise was to identify a method of measurement to allow for the content of that language to be incorporated into models of policy change, institutional pro-cesses, and elite behavior. Of the three measures evaluated in this project, the cosine simi-larity score performed the best, because it is the most responsive to the composite parts of the discursive overlap. Additionally, it tracks best with the intuitive expectations and results found through the course of this study.
However, further validation and testing needs to be done. For the measures introduced and examined in this study, more validation should be done, because all documents were read and coded only by the author. In the future, this process should be repeated with more individual reading and coding the test documents. Additionally, this process should be conducted on more policies and across different years. Congress considers and amends the Farm Bill every five years, as a result I would be able to track how much the conversation changes over time and identify to what extent these measures are robust over time. For measures not included in this study, a wider survey of the literature should be done to identify other potential contenders not considered to this point.
Appendix A: A Demonstrations of the Measures
To walk through the calculations associated with each of the measures, let us revisit an example from the paper. Table 12 provides four sentences drawn from the corpus and includes two statements by Democrats and two statements by Republicans. The processing of these statements was done in R rather than in QDA Miner to condense the process to a single R file rather than a dispersed collection of sources. The first step in the process – to calculate the scores with any of the measures – is to generate a document term matrix for the sentences. Table 13 partially shows the end product of this process; only the ten rows of the resulting matrix are shown. The rows consist of the counts of word occurance and the columns consist of the individual documents. In addition to the individual documents, I have calculated word frequency for the aggregated Republican and Democratic statements. The total number of words included in this is 78.
Table 12:Examining Overlap Between Example Sentences from the Congressional Record
Example Sentence Speaker
1 “The President and his Republican supporters in the Senate determined that while bipartisanship made good policy, obstruction made better pol-itics.”
Senator Reid, 2007 Dec. 7
2 “I cannot begin to explain how unbelievably frustrating it is for people elected to come to this body, they say the greatest deliberative body, to be at parade rest day after day, unable to move because of two simple words uttered almost routinely every day by the minority: I object.”
Senator Dorgan, 2007 Dec. 5
3 “We could have been debating amendments to the farm bill for a week or two now. Instead we have been stalled by a procedure that has filled the amendment tree, for those who don’t follow the rules of the Senate.”
Senator Crapo, 2007 Nov. 15
4 “The Milk Income Loss Contract Program has probably the strongest payment limits of any program. What came out of the Agriculture Com-mittee includes caps on such programs such as EQIP, the Conservation Reserve Program, and Conservation Security Program.”
Table 13: A Snippet of the Produced Document-Term Matrix
Terms Sen. Crapo Sen. Dorgan Sen. Grassley Sen. Reid Rep.s Dem.s
agriculture 0 0 1 0 1 0
almost 0 1 0 0 0 1
begin 0 1 0 0 0 1
better 0 0 0 1 0 1
bipartisanship 0 0 0 1 0 1
body 0 2 0 0 0 2
caps 0 0 1 0 1 0
committee 0 0 1 0 1 0
conservation 0 0 2 0 2 0
These vectors of word counts are then used to calculate the scores. Below is the math associated with the calculation of the cosine similarity score:
cos(θ) = A·B
kAkkBk =
n P i=1
Ai×Bi
r n P
i=1
(Ai)2×
r n P
i=1
(Bi)2
(5)
0.032 = Rep·Dem
kRepkkDemk =
2
√
54×73 (6)
Below is the math associated with the calculation of the overlap coefficient:
overlap(X, Y) = |X∩Y|
min(|X|,|Y|) (7)
0.025 = 2
78 (8)
Below are the steps that produce the overlap score adapted from the Wordfish documents output:
wordfish.matrix <- cbind(as.numeric(example.docs$Sen.Crapo),
as.numeric(example.docs$Sen.Dorgan),
as.numeric(example.docs$Sen.Grassley),
as.numeric(example.docs$Sen.Reid))
output <- wordfish(wordfish.matrix,dir=c(1,4))
output.doc <- output$documents
# Crapo = 0.06; Dorgan = -1.31; Grassley = 1.12; Reid = 0.12
var(output.doc[,1]) #1
Appendix B: Coding Categories and Provisions
These are the codes for the broad categories (ex. nutrition, energy, etc.) and the specific provisions within each category (ex. dairy, food stamps, etc.). I held these code constant across datasets and stages of the data collection and cleaning process. Below are the nu-meric codes attached to the category and provision.
1. Commodity(1000)
(a) Countercyclical Payments (1001) (b) Dairy (1002)
(c) Direct Attribution of Farm Payments (1003) (d) Fixed Payments (1004)
(e) Market Loans (1005) (f) Payment Limits (1006) (g) Peanuts (1007)
(h) State-Based Countercyclical Payments (1008) (i) Sugar (1009)
(j) Other Commodities (1010)
2. Commodity Futures (1100) (a) CFTC (1101)
(b) Energy Speculation (1102)
(c) Foreign Currency Transactions (1103) (d) Market Manipulation (1104)
(a) Conservation Reserve Program (1201) (b) Conservation Security Program (1202)
(c) Environmental Quality Incentives Program, EQIP (1203) (d) Grassland Reserve Program (1204)
(e) Wetlands Reserve Program (1205) (f) Other Conservation (1206)
4. Credit (1300)
(a) Conservation Loans (1301) (b) Emergency Loans (1302) (c) Farm Credit (1303)
(d) Farm Ownership Loans (1304) (e) Farmer Loans (1305)
(f) Other Credit (1306)
5. Crop Insurance (1400)
(a) Administrative and Operating Subsidies (1401) (b) Investigating Fraud and Abuse (1402)
(c) Organic Crop Insurance (1403)
(d) Standard Reinsurance Agreement (1404)
6. Energy (1500)
(d) Biofuels Infrastructure Assessment (1504) (e) Biomass Crop Assistance (1505)
(f) Biomass Research and Development (1506) (g) Biorefinery Assistance (1507)
(h) Federal Procurement of Biobased Products (1508) (i) Forest and Wood Fuels (1509)
(j) Renewable Energy System and Energy Efficiency Improvements (1510) (k) Rural Energy for America Program (1511)
(l) Sugar Ethanol Program (1512) 7. Forestry (1600)
(a) Community Forest and Open Space Conservation Program (1601) (b) Enhanced Community Fire Protection (1602)
(c) Forest Land Enhancement Program (1603) (d) Healthy Forests Reserve Program (1604) (e) Training for Minorities (1605)
8. Horticulture and Organic Agriculture (1700) (a) Farmers’ Market Promotion (1701) (b) Honey Bees (1702)
(c) National Clean Plant Network (1703) (d) Pest and Disease Management (1704) (e) Other Horticulture (1705)
9. Livestock (1800)
(b) Interstate Shipment of Meat (1802) (c) Livestock Contracts (1803)
(d) Packers and Stockyards Act (1804) (e) Other Livestock (1805)
10. Nutrition (1900)
(a) Child Nutrition and Related Programs (1901) (b) Commodity Distribution (1902)
(c) Emergency Food Assistance Program (1903) (d) Food Stamps (1904)
11. Research (2000)
(a) Agricultures Extensions (2001)
(b) Agriculture and Food Research (2002) (c) Biosecurity (2003)
(d) Bovine Johne’s Disease Control Program (2004) (e) Energy Research (2005)
(f) Initiative for Future Agriculture and Food Systems (2006) (g) Minority Researchers (2007)
(h) National Institute of Food and Agriculture (2008) (i) Specialty Crops (2009)
12. Rural Development (2100)
(c) Rural Health Care Programs (2103) (d) Water and Wastewater Programs (2104)
13. Tax (2200)
(a) Conservation Reserve Program Payments (2201) (b) Customs User Fees (2202)
(c) Endangered Species (2203) (d) Ethanol Tax Credits (2204)
(e) Forest Conservation Bonds (2205)
(f) Limitation of Farming Losses Claimed on Tax Returns (2206)
(g) Taxation of Qualified Timber Gain and Timber REIT Provisions (2207)
14. Trade (2300)
(a) Caribbean Trade (2301) (b) Food for Progress (2302)
(c) Global Crop Diversity Trust (2303) (d) Haiti Trade (2304)
(e) Local Purchase Pilot Program (2305) (f) Market Access Program (2306)
(g) McGovern-Dade International Food Program (2307) (h) Softwood Lumber Act (2308)
(i) Other Trade (2309)
15. Miscellaneous (2400)
(b) Disaster Aid (2402)
(c) Farm Service Agency Offices (2403) (d) Office of Homeland Security (2404)
(e) Socially Disadvantaged Farmers and Ranchers (2405)
Appendix C: Measuring Distinctiveness Between Partisan Speeches
1. Coding the Documents: This was a two step process. In the first, I developed a set of identifiers by simply searching for shortened forms of the names of the provisions. Below is a list of search terms. Secondly, I had QDA Miner automatically code the documents for whether the provision was mentioned. These codes were then saved.
• The codes applied, but not the keywords used, are found in Appendix .
2. Pulling the Requisite Vectors from QDA Miner & WordStat: Using the drop down retrieval menu in QDA Miner, choose “Coding Retrieval.” Next choose which ever code and variables you need to analyze. Hit the search button. With the produced table, click on the “export to WordStat” button. Once within WordStat, click on the “frequency” tab. This calculates the occurrences of individual words, which the program will use to generate phrases. After this has run, click on the phrases tab; hit the flashlight (search button). Click on the crosstabs button. The settings here should be speaker for the variable, none for the statistic, and frequency for the tabulation. Save the produced spreadsheet as “PROVISION freq.csv”.
• The settings for this are: a DLL porter stemmer, the built-in English exclusion dictionary or the slightly adjusted English dictionary, and at least 3 occurrences.
documents such that four vectors result – Democrats in the House, Republicans in the House, Democrats in the Senate, and Republicans in the Senate.
4. Calculating Overlap Scores:
(a) Overlap Coefficient:Input the Democratic frequency and Republican frequency vectors into the “overlapEst” function in the overlap package in R. Isolate the first score.
(b) Variance in Wordfish Scores: Use the Wordfish function for R to calculate the scores for speakers in the House and the Senate. Take the variance of these scores using the var command in R.
(c) Cosine Values:Input the Democratic frequency and Republican frequency vec-tors into the “cosine” function in the lsa package in R.
Appendix D: The Constructed List of Stop Words
Below is the list of stop words used for this study:
HAVE,LATTER, O, RESOLU, THAT’S, VARIOUS, YOU’VE, AFTER, BRIEF, EAR-MARK, HAVEN’T,LATTERLY, OBVIOUSLY, RESPECTIVELY, THE, VERY, Z, AF-TERWARDS, BUT, EDU, HAVING,LAW, OF, RIGHT, THEIR, VETO, ZERO, AGAIN, BY, EG, HE,LEADER, OFF, RULE, THEIRS, VIA, AGAINST, C, EIGHT, HELLO, LEADERSHIP, OFTEN, S, THEM, VIZ, AGRE, CALL, EITHER, HELP,LEAST, OH, SAID, THEMSELVES, VOTE, AGREEM, CAME, ELSE, HENCE,LEGISL, OK, SAME, THEN, VS, AIN’T, CAN, ELSEWHERE, HER,LESS, OKAY, SAW, THENCE, W, AISL, CANNOT, ENACT, HERE,LEST, OLD, SAY, THERE, WANT, ALL, CANT, ENERGI, HEREAFTER,LET, ON, SAYING, THEREAFTER, WANTS, ALLOW, CAN’T, ENOUGH, HEREBY,LET’S, ONCE, SAYS, THEREBY, WAS, ALLOWS, CASE, ENTIRELY, HEREIN, LIKE, ONE, SECOND, THEREFORE, WASHINGTON, ALMOST, CAUSE, ESPECIALLY, HERE’S, LIKED, ONES, SECONDLY, THEREIN, WASN’T, ALONE, CAUSES, ET, HEREUPON,LIKELY, ONLY, SEE, THERES, WAY, ALONG, CERTAIN, ETC, HERS,LITTLE, ONTO, SEEING, THERE’S, WE, ALREADY, CERTAINLY, EVEN, HERSELF,LOOK, OPPOS, SEEM, THEREUPON, WE’D, ALSO, CHAIRMAN, EVER, HE’S,LOOKING, OR, SEEMED, THESE, WELCOME, ALTHOUGH, CHAIRWOMAN, EVERY, HI,LOOKS, ORDER, SEEMING, THEY, WELL, ALWAYS, CHANGES, EVERYBODY, HIM,LTD, OTHER, SEEMS, THEY’D, WE’LL, AM, CLEARLY, EVERYONE, HIMSELF,M, ERS, SEEN, THEY’LL, WENT, AMEND, C’MON, EVERYTHING, HIS,MADAM, OTH-ERWISE, SELF, THEY’RE, WERE, AMONG, CO, EVERYWHERE, HITHER,MADE, OUGHT, SELVES, THEY’VE, WE’RE, AMONGST, COLLEAGU, EX, HOLD,MAINLY, OUR, SENAT, THINK, WEREN’T, AN, COLLEG, EXACTLY, HONOR,MAJOR, OURS, SENSIBLE, THIRD, WE’VE, AND, COM, EXAMPLE, HOPEFULLY,MAKE, OUR-SELVES, SENT, THIS, WHAT, ANOTHER, COME, EXCEPT, HOUR,MANY, OUT, SERIOUS, THOROUGH, WHATEVER, ANY, COMES, F, HOUS,MAY, OUTSIDE, SE-RIOUSLY, THOROUGHLY, WHAT’S, ANYBODY, COMMITTE, FAIL, HOW,MAYBE, OVER, SESSION, THOSE, WHEN, ANYHOW, CONCERNING, FAR, HOWBEIT,ME,
DEMO-CRAT, GIVE, IT’D,NEEDS, R, SUBCOMMITTE, UNION, WON’T, BECOME, SCRIBED, GIVEN, IT’LL,NEITHER, RAIS, SUCH, UNIT, WOULD, BECOMES, DE-SPITE, GIVES, ITS,NEVER, RATHER, SUP, UNLESS, WOULDN’T, BECOMING, DID, GO, IT’S,NEVERTHELESS, RD, SUPPORT, UNLIKELY, X, BEEN, DIDN’T, GOES, ITSELF,NEW, RE, SURE, UNTIL, Y, BEFORE, DIFFERENT, GOING, I’VE,NEXT, RE-ALLY, T, UNTO, YE, BEFOREHAND, DISTINGUISH, GONE, J,NINE, REASONABLY, TAKE, UP, YEA, BEHIND, DISTRICT, GOT, JUST,NO, REAUTHOR, TAKEN, UPON, YEAR.
Appendix E: Levels of Overlap
In political science, the limited applications of this measure have been estimating the degree to which two bills share language – essentially the extent to which one document plagiarizes another Garrett and Jansa (N.d.). However, here I am both comparing documents and scores within a context and thus need a score. To establish discernible levels of overlap and all for an easier evaluation, an “average” or normal level of overlap within speeches needs to be ascertained. Here I have done this by estimating the scores for the entire corpus between the Democrats and Republicans. This was done simply by repeating the same process as before, but without filtering the search results. Then to better contextualize the relative levels of the scores, I bootstrapped confidence intervals around the overall scores. This allowed me to establish low, medium, and high scores rather than simply high or low. These confidence intervals were then placed around each of the scores. This allowed for standard hypothesis testing to take place. I created five categories: strictly low, low but not significantly different, moderate, high but not significantly different, and strictly high. In future research, this distinction will be helpful.
Appendix F: Instruction for Content Coding
• In R, sample from the list of provisions that satisfy the condition of both parties giving speeches on that provision. 33 provisions meet this criteria. See the associated .R file for the specific code to do this.
• The first five provisions R sampled from this list were: farm service agency of-fices, food stamps, conservation security program,peanuts, and office of home-land security. The second five provisions R sampled from this list were: child nutrition and related programs, rural broadband and telephone and energy, rural employment and business development, other commodities (fruit and vegetable subsidies), and energy research.
2. Pull the speeches and all associated variables that are auto-coded with these provision codes from QDA Miner. Save these files as .tab files, which can then be opened in Excel.
• Side-note: To open .tab files in Excel, simply open Excel, choose open files and force it to show all file types, and click the delimt:tab button on the pop-up screen. If the text to columns screen does not automatically appear, highlight the column of text and click on the text-to-columns button under the ”Data” tab at the top of the Excel screen. Within the text-to-columns screen, click delimit and then tab. This should split the single column of text into a more recognizable Excel file.
3. Prepare the files for validation coding. This should be done by: • Delete everything but the document code and speech text.
• Generate six new columns. Label these: farmbill, provision, tone, frames, tech-nocratic, and notes.
4. Carry-out the validation coding. This is contained to the five new columns in the cleaned files. The codes that should be applied are:
• farmbill:
– 0 == does not discuss the Farm Bill and/or any of its provisions
– 1 == discusses the Farm Bill and/or any of its provisions
• provision:Choose which provisions the speech mentions from the provided code
list of topics and provisions within the Farm Bill. Each provision mentioned should be separated by a semicolon (;).
• tone:
– -1 == uses a predominately negative tone throughout the speech
– 1 == uses a predominately positive tone throughout the speech
• frames: Choose which frames the speaker uses during the speech from the list
of general frames developed by Boydstun, Gross, Resnik, and Smith n.d.. Each frame used should be separated by a semicolon (;). The frames and their asso-ciated codes are:
(a) Economic
(b) Capacity and Resources (c) Morality
(d) Fairness and Equality
(e) Constitutionality and Jurisprudence (f) Policy Prescription and Evaluation (g) Law and Order, Crime and Justice (h) Security and Defense
(k) Cultural Identity (l) Public Opinion (m) Political
(n) External Regulation and Reputation (o) Other
• technocratic: Is the document using technocratic language? This could be
ei-ther in the use of highly procedural language (i.e. discussing the ins and outs of filibustering, voting, or quorum calls) or highly specific language on the imple-mentation and evaluations of a specific policy.
– 0 == does not use technocratic language
– 1 == uses technocratic language
• notes: Any additional information that may be helpful such as quirks in the data
or providing reasons as to why the speech does not appear to be speaking to the Farm Bill.
REFERENCES
Aldrich, John H. 2011. Why Parties? A Second Look. The University of Chicago Press.
Almanac, Congressional Quarterly. 2008. “110th Congress.”2nd Session.
Baumgartner, Frank R., Suzanna L. DeBoef and Amber E. Boydstun. 2008. The Decline of the Death Penalty and the Discovery of Innocence. Cambridge University Press.
Benford, Robert D. and David A. Snow. 2000. “Framing Processes and Social Movements: An Overview and Assessment.”Annual Review of Sociology26:611–639.
Bollegala, Danushka Tarupathi, Yutaka Matsuo and Mitsuru Ishizuka. 2010. Relational duality: Unsupervised extraction of semantic relations between entities on the web. In Proceedings of the 19th international conference on World wide web. ACM pp. 151– 160.
Bollegala, Danushka, Yutaka Matsuo and Mitsuru Ishizuka. 2007. “Measuring semantic similarity between words using web search engines.”www7:757–766.
Boydstun, Amber E. 2013. Making the News: Politics, the Media, and Agenda Setting. University of Chicago Press.
Boydstun, Amber E, Justin H Gross, Philip Resnik and Noah A Smith. n.d. “Identifying Media Frames and Frame Dynamics Within and Across Policy Issues.”.
Druckman, James N. 2001. “On the Limits of Framing Effects: Who Can Frame?”The Jou 63(4):1041–1066.
Druckman, James N, Lawrence R Jacobs and Eric Ostermeier. 2004. “Candidate strategies to prime issues and image.”Journal of Politics66(4):1180–1202.
Food, Conservation. 2008. “Energy Act of 2008.”Public Law110:134.
Freedman, Paul and Ken Goldstein. 1999. “Measuring media exposure and the effects of negative campaign ads.”American journal of political Sciencepp. 1189–1208.
Garrett, Kristin N. and Joshua M. Jansa. N.d. “Interest Group Influence in Policy Diffusion Networks.” . Forthcoming.
Gerrity, Jessica C, Tracy Osborn and Jeanette Morehouse Mendez. 2007. “Women and Representation: A Different View of the District?”Politics & Gender3(02):179–200.
Grimmer, Justin. 2013.Representational Style in Congress: What Legislators Say and Why It Matters. Cambridge University Press.
Grimmer, Justin and Brandon M Stewart. 2013. “Text as data: The promise and pitfalls of automatic content analysis methods for political texts.”Political Analysisp. mps028.
Grimmer, Justin, Sean J Westwood and Solomon Messing. 2014. The Impression of In-fluence: Legislator Communication, Representation, and Democratic Accountability. Princeton University Press.
Gross, Justin, Kelsey Shoub, Andrew Tyner and Amy Sentementes. N.d. Measuring Ideo-logical Do- mains: An Instrument Design and Evaluation Approach to Text. InAnnual Meeting of the Society for Political Methodology, ed. PolMeth.
Harris, Douglas B. 2005. “Orchestrating Party Talk: A Party-Based View of One-Minute Speeches in the House of Representatives.”Legislative Studies Quarterly30(1):127–141.
Hill, Kim Quaile and Patricia A Hurley. 2002. “Symbolic speeches in the US Senate and their representational implications.”The Journal of Politics64(01):219–231.
Kl¨uver, Heike. 2009. “Measuring interest group influence using quantitative text analysis.” European Union Politics10(4):535–549.
Kl¨uver, Heike. 2013.Lobbying in the European Union: interest groups, lobbying coalitions, and policy change. Oxford University Press.
Laver, Michael, Kenneth Benoit and John Garry. 2003. “Extracting policy positions from political texts using words as data.”American Political Science Review97(02):311–331.
Matsuo, Yutaka, Junichiro Mori, Masahiro Hamasaki, Takuichi Nishimura, Hideaki Takeda, Koiti Hasida and Mitsuru Ishizuka. 2007. “POLYPHONET: an advanced social network extraction system from the web.” Web Semantics: Science, Services and Agents on the World Wide Web5(4):262–278.
Mayhew, David R. 1974. Congress: The Electoral Connection. Yale University Press.
McCall, Leslie. 2013. The Undeserving Rich. Cambridge University Press.
Morris, Jonathan S. 2001. “Reexamining the politics of talk: Partisan rhetoric in the 104th House.”Legislative Studies Quarterlypp. 101–121.
Nelson, Thomas E, Rosalee A Clawson and Zoe M Oxley. 1997. “Media framing of a civil liberties conflict and its effect on tolerance.” American Political Science Review 91(03):567–583.
Nguyen, Viet-An, Jordan Boyd-Graber and Philip Resnik. 2013. Lexical and hierarchical topic regression. InAdvances in Neural Information Processing Systems. pp. 1106–1114.
Oleszek, Walter J. 2013. Congressional procedures and the policy process. SAGE.
Osborn, Tracy and Jeanette Morehouse Mendez. 2010. “Speaking as women: Women and floor speeches in the Senate.”Journal of Women, Politics & Policy31(1):1–21.
Pearson, Kathryn and Logan Dancey. 2011. “Elevating Women?s Voices in Congress Speech Participation in the House of Representatives.” Political Research Quarterly 64(4):910–923.
Polletta, Francesca. 1998. “Legacies and liabilities of an insurgent past: Remembering Martin Luther King, Jr., on the House and Senate floor.”Social Science Historypp. 479– 512.
Quinn, Kevin M., Burt L. Monroe, Michael Colaresi, Michael H. Crespin and Dragomir R. Radev. 2010. “How to Analyze Political Attention with Minimal Assumptions and Costs.” 54:209–228.
Riker, William H. 1986. The Art of Political Manipulation. Yale University Press.
Rose, Max and Frank R. Baumgartner. 2013. “Framing the Poor: Media Coverage and US Poverty Policy 1996-2008.”Policy Studies Journal41:22–43.
Schaffner, Brian F and Patrick J Sellers. 2010. Winning with words: the origins and impact of political framing. Routledge.
Schmid, Friedrich and Axel Schmidt. 2006. “Nonparametric estimation of the coefficient of overlapping?theory and empirical application.”Computational statistics & data analysis 50(6):1583–1596.
Slapin, Jonathan B and Sven-Oliver Proksch. 2008. “A scaling model for estimating time-series party positions from texts.”American Journal of Political Science52(3):705–722.
Smith, Steven S. 2014. The Senate Syndrome: The evolution of procedural warfare in the modern US Senate. Vol. 12 University of Oklahoma Press.
Taylor, Andrew. 2012. The Floor in Congressional Life. University of Michigan Press.
Volkens, Andrea, Judith Bara, Ian Budge, Michael D McDonald and Hans-Dieter Klinge-mann. 2013. Mapping policy preferences from texts: statistical solutions for manifesto analysts. Oxford University Press.
Werner, Annika, Onawa Lacewell and Andrea Volkens. 2010. “Manifesto Coding Instruc-tions (4th fully revised edition).”.”.