ORAL HEALTH AND COGNITIVE FUNCTION IN
THE ATHEROSCLEROSIS RISK IN COMMUNITIES (ARIC) STUDY
Supawadee Naorungroj
A dissertation submitted to the faculty of the University of North Carolina at Chapel Hill in partial fulfillment of the requirements for the degree of Doctoral of Philosophy in the Department of
Epidemiology, Gillings School of Global Public Health.
Chapel Hill 2013
ii ©2013
iii ABSTRACT
SUPAWADEE NAORUNGROJ: Oral health and cognitive function in the Atherosclerosis Risk in Communities (ARIC) study
(Under the direction of Gary D. Slade and Victor J. Schoenbach)
Emerging evidence suggests possible links between poor oral health and cognitive
dysfunction in older adults; however, it is unclear whether the association is present in midlife, and whether poor oral health in midlife increases risk of subsequent cognitive decline. The present study aimed to investigate whether a) periodontal disease and tooth loss were associated with low cognitive performance and b) periodontal disease and tooth loss were predictive of eight-year cognitive decline. The study used data collected from adults aged 52-75 years who participated in the dental health component of the Atherosclerosis Risk in Communities (ARIC) study.
Cognitive function tests consisted of Delayed Word Recall (DWR), Digit Symbol
Substitution (DSS), and Word Fluency (WF). At ARIC Visit 4 (1996-1998), 9,874 participants also answered dental screening questions, and 5,942 of the 8,554 dentate participants received
comprehensive oral examinations, including periodontal probing. From 2004-2006, cognitive
function for 911 participants was reassessed as part of the Brain MRI study; 785 of these participants were dentate, and 558 of them had received periodontal examinations at ARIC Visit 4. Models fit with multiple linear regression and generalized estimating equations (GEE) used dental status, number of teeth, or clinical periodontal conditions classified by the Biofilm-Gingival Interface (BGI) classification to predict Visit 4 cognitive scores and eight-year change in cognitive scores,
iv
v DEDICATION
To my Advisors
vi
ACKNOWLEDGEMENTS
I want to thank my committee, Dr. Gerardo Heiss, Dr. James D. Beck and Dr. Lisa Miller Wruck for their patience and time, and invaluable suggestions regarding study analysis and
manuscripts preparation. I also want to thank Kimon Divaris and Jin-Liern Hong who shared with me their enthusiasm and experience in the Epidemiology program during my study at UNC. I am grateful to Prince of Songkla University and Her Royal Highness the Princess Mother Fund (Thailand) for their financial support. I want to express my appreciation to Anna M. Kucharska-Newton (ARIC Coordinating Center) and Kevin Moss (Center for Oral and Systemic Diseases) for preparing study data sets. Special thanks to my friends (Karla, Kasemsiri, Jittima, Chotibhak, Praepun, and Sarinya) for fulfilling my life here. I will never forget the great times we spent together.
The ARIC study was carried out as a collaborative study supported by National Heart, Lung and Blood Institute (contracts HC55015, HC 55016, HC 55018, HC 55019, N01-HC 55020, N01-N01-HC 55021, N01-N01-HC 55022). The collection and analysis of dental data were
vii
TABLE OF CONTENTS
LIST OF TABLES ...x
LIST OF FIGURES ... xiii
LIST OF ABBREVIATIONS ... xvi
Chapter 1. LITERATURE REVIEW ... 1
A. Introduction ...1
B. Dementia and cognitive decline ...1
C. Determinants of cognitive decline, dementia, and structural brain abnormalities ...3
D. Associations of oral health measures with cognitive function ...7
E. Cognitive assessments ...12
F. Neuroimaging ...14
G. Periodontal disease assessments ...16
H. Tables ...19
I. Figures ...20
References ...21
2. SPECIFIC AIMS ... 28
A. Rationale ...28
B. Specific aims ...29
viii
3. RESEARCH METHODS ... 36
A. Study design ...36
B. Source of population ...36
C. Data sources and participants’ involvement ...36
D. Sample size and power ...38
E. Assessment of exposures, outcomes, and covariates ...38
F. Statistical analyses ...42
G. Protection of human subjects ...47
H. Tables ...49
I. Figures ...51
References ...52
4. STUDY 1: RESULTS ... 53
A. Overview ...53
B. Introduction ...54
C. Methods ...56
D. Results ...58
E. Discussion ...60
F. Conclusion ...63
G. Human participants protection ...64
H. Tables ...65
I. Figures ...68
J. Supplemental materials ...70
K. Supplemental tables ...71
L. Supplemental figures ...81
References ...83
ix
A. Overview ...85
B. Introduction ...86
C. Methods ...87
D. Result ...91
E. Discussion ...93
F. Conclusion ...97
G. Human participants protection ...97
H. Tables ...98
I. Figures ...101
J. Supplemental materials ...104
K. Supplemental tables ...106
L. Supplemental figures ...119
References ...123
6. DISCUSSION AND CONCLUSIONS ... 126
A. Summary of major findings ...126
B. Strengths ...129
C. Limitations ...131
D. Public health significance ...132
E. Future research direction ...133
References ...135
Appendix A: Summary of major findings ...136
Appendix B: Directed acyclic graphs (DAGs) ...143
Appendix C: Oral health measures ...145
Appendix D: Cognitive function assessment in ARIC study ...154
Appendix E: Characteristics of ARIC study participants ...163
x
LIST OF TABLES
Table 1-1. Inflammatory markers associated with cognitive decline and dementia in epidemiologic studies ... 19 Table 1-2. Test scores in the ARIC MRI study among participants who
completed cognitive tests on all four follow-ups ... 19 Table 1-3. Gingival crevicular fluid-mediator levels and Biofilm-Gingival
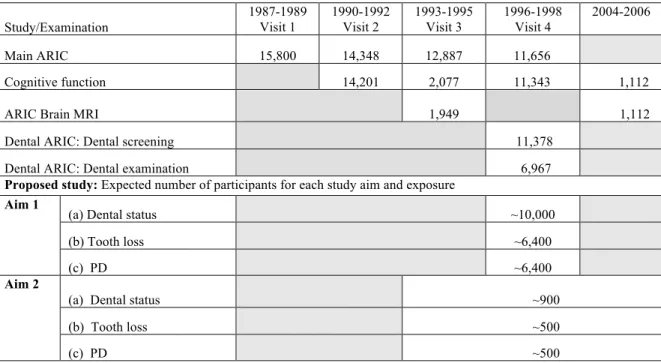
Interface categories ... 19 Table 3-1. Numbers of subjects participating in the ARIC study from
Visit 1 through Visit 4, Dental ARIC, and Brain MRI ... 49 Table 3-2. Definition and prevalence of periodontal disease classified by
Biofilm-Gingival Interface (BGI) system in adults aged 52 to 74 years at ARIC Visit 4 ... 49 Table 3-3. Summary of candidate variables, coding, and analytic approach ... 50 Table 4-1. Race- and gender- specific of ARIC Visit 4 characteristics of
study samples ... 65 Table 4-2. Comparisons of self-reported causes of tooth loss, the use of
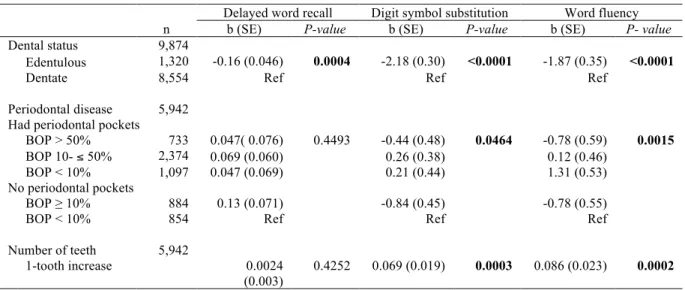
prosthesis, and gum disease of study participants who were edentulous and those who were dentate ... 66 Table 4-3. Regression coefficients for the associations between oral health
measures and Visit 4 cognitive scores ... 67 Table 4-4. Self-reported causes of tooth loss, prosthesis use, gum disease,
oral hygiene care, and dental visits of dentally-screened participants ... 71 Table 4-5. Cognitive scores at Visit 4 in relation to selected study
characteristics (n = 9,874) ... 73 Table 4-6. Study centers-specific estimates for association between oral
health measures and cognitive function ... 75 Table 4-7. Prevalence of periodontal disease classified by CDC/AAP index
and other clinical measures of periodontal disease in relation to five levels of Biofilm-Gingival Interface ... 76
Table 4-8. Regression coefficients for associations of CDC/AAP periodontal disease classification and clinical signs of periodontal disease with three measures of cognitive function at Visit 4 ... 77 Table 4-9. Regression coefficients for associations between dental status
xi
Table 4-10. Regression coefficients for associations between periodontal disease classified by Biofilm-Gingival Interface (BGI) classification and three cognitive scores at Visit 4 (n = 5,942) ... 79 Table 4-11. Regression coefficients for associations between number of
teeth and three cognitive scores at Visit 4 (n = 5,942) ... 80 Table 5-1. Race- and gender-specific socio-demographics, health conditions,
and cognitive function at baseline (1996-1998) of study participants from Forsyth County NC and Jackson MS study sites ... 98 Table 5-2. Cognitive scores at Visit 4 and the eight-year changes in
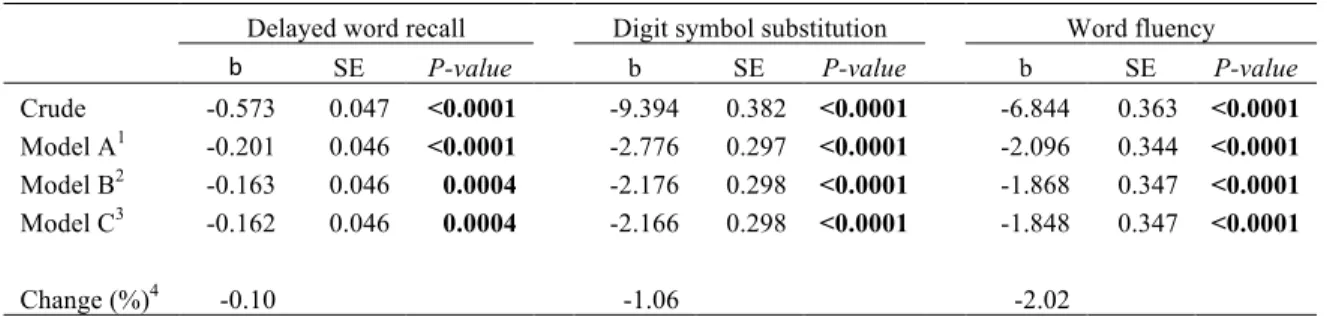
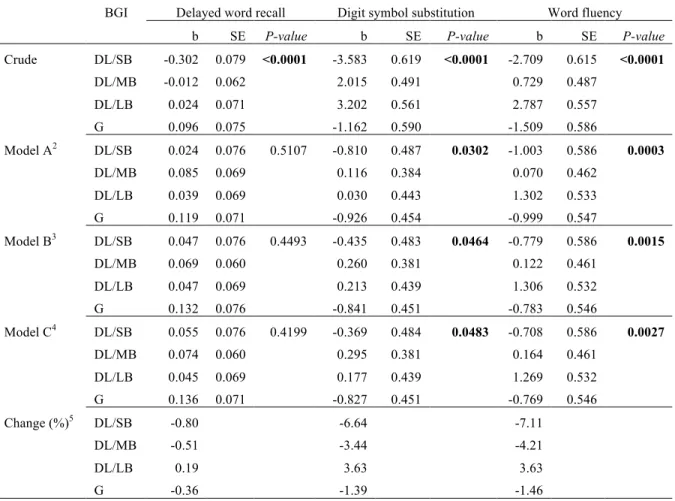
cognitive scores ... 99 Table 5-3. Regression coefficients for the effects of time, oral health
measures, and the interaction between time and oral health measures on three cognitive scores ... 100 Table 5-4. Regression coefficients for the associations between oral health
measures and Visit 4 cognitive scores: A cross-sectional analysis ... 106 Table 5-5. Comparison of cognitive scores at baseline and follow-up of
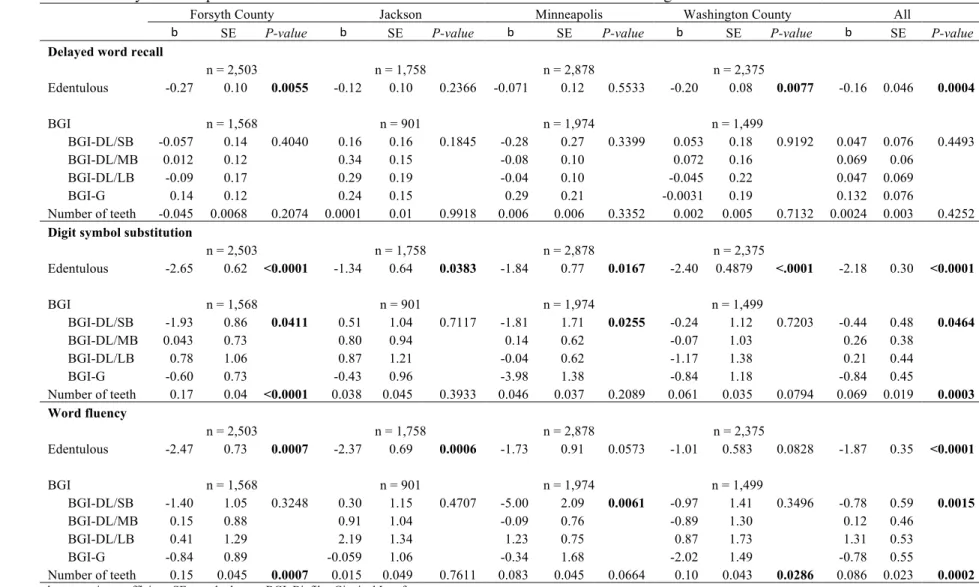
participants who were from Forsyth County NC and Jackson MS ... 107 Table 5-6. Study site-specific estimates for associations between time,
dental status, and their interaction on three measures of cognitive function ... 108 Table 5-7. Regression coefficients for the effects of time, oral health
measures, and their interaction on three cognitive scores, excluding subjects with stroke at baseline ... 109 Table 5-8. Regression coefficients for effects oral health measures on
cognitive function changes: Change score models ... 110 Table 5-9. Baseline characteristics and repeated measures (1996-1998 and
2004-2006) of the three cognitive test scores (n = 911) ... 111 Table 5-10. Regression coefficients for effects of time, dental status, and
their interaction on cognitive scores (n = 911) ... 113 Table 5-11. Stratum-specific estimates for associations between dental status
and cognitive scores (n = 911) ... 114 Table 5-12. Regression coefficients for effects of time, periodontal disease,
and their interaction on cognitive scores (n = 558) ... 115 Table 5-13. Stratum-specific estimates for associations between periodontal
xii
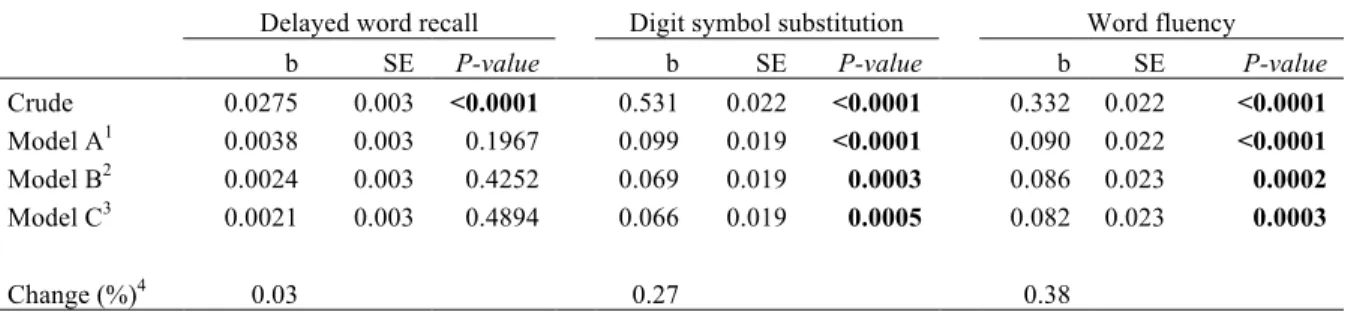
Table 5-14. Regression coefficients for effects of time, number of teeth, and their interaction on cognitive scores ... 117 Table 5-15. Stratum-specific estimates for the association between number
of teeth and cognitive scores (n = 558) ... 118 Table A-1. Cardiovascular and other non-oral health risk factors for cognitive
decline, dementia, and brain abnormalities identified in the ARIC studies ... 136 Table A-2. Cognitive decline and dementia are associated with an increased
likelihood of poor oral health ... 138 Table A-3. Possible causal relationships of periodontal disease or tooth loss
with cognitive decline ... 139 Table A-4. Clinical measures, inflammatory biomarkers, and microbiology
components of periodontal diseases: Dental ARIC ... 142 Table C-1. Selected baseline characteristics of ARIC study samples in
relation to dental status ... 145 Table C-2. Prevalence of periodontal diseases in Dental ARIC study,
classified by CDC/AAP1 index and Biofilm-Gingival Interface
classification (n = 6,700) ... 147 Table C-3. Selected characteristics of ARIC study participants at Visit 4 in
relation to periodontal disease prevalence: A cross-sectional study (n = 5,966) ... 149 Table C-4. Selected characteristics at Visit 4 of ARIC study participants
from Jackson and Forsyth County study sites in relation to periodontal disease: A longitudinal study (n = 558) ... 150 Table C-5. Selected characteristics of ARIC study participants in relation
to number of teeth ... 153 Table D-1. Means, standard deviations, and median scores of three cognitive
tests for African American and white participants at each ARIC visit ... 154 Table D-2. Cognitive scores at Visit 4 in relation to selected study
characteristics (n = 9,909) ... 157 Table E-1. Characteristics of ARIC cohort members who were included in or
xiii
LIST OF FIGURES
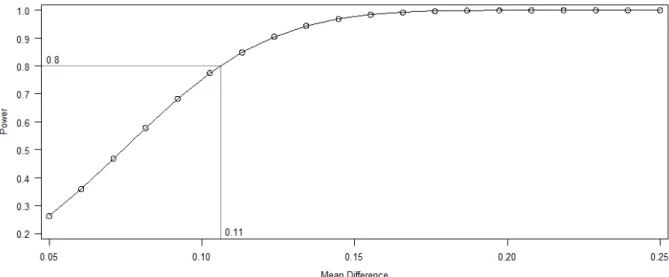
Figure 1-1. Age-specific prevalence of all types of dementia (per 100 population) across continents and countries ... 20 Figure 3-1. Data sources, key variables, and study design for each specific aim ... 51 Figure 3-2. Power plot for detectable difference in means between
BGI-DL/SB vs. others ... 51
Figure 4-1. Crude and adjusted means with 95% confidence intervals of three cognitive scores, comparing edentulous participants with dentate participants (n = 9,874) ... 68 Figure 4-2. Crude and adjusted means with 95% confidence intervals of
three cognitive scores, comparing among five levels of periodontal conditions (n = 5,942) ... 69 Figure 4-3. Flow chart of ARIC participants who completed three cognitive
function tests, dental screening, and comprehensive dental examination between 1996 and 1998 ... 81 Figure 4-4. Extent of probing pocket depth by five levels of Biofilm-Gingival
Interface classification (n = 5,942) ... 82 Figure 4-5. Extent of attachment loss by five levels of Biofilm-Gingival
Interface classification (n = 5,942) ... 82 Figure 5-1. Crude and adjusted means with 95% confidence intervals for
the Delayed Word Recall test scores at baseline and follow-up comparing edentulous with dentate participants (n = 911) ... 101 Figure 5-2. Crude and adjusted means and 95% confidences intervals for
the Delayed Word Recall test scores at baseline and follow-up in relation to five levels of periodontal conditions (n = 558) ... 101 Figure 5-3. Crude and adjusted means and 95% confidences intervals for
the Digit Symbol Substitution test scores at baseline and follow-up comparing edentulous with dentate participants (n = 911) ... 102 Figure 5-4. Crude and adjusted means and 95% confidences intervals of
Digit Symbol Substitution test scores at baseline and follow up in relation to five levels of periodontal conditions (n = 558) ... 102 Figure 5-5. Crude and adjusted means and 95% confidences intervals of
xiv
Figure 5-6. Adjusted means and 95% confidences intervals of Word Fluency test scores at baseline and follow up in relation to five levels of periodontal conditions (n = 558) ... 103 Figure 5-7. Flow chart of ARIC participants who completed two cognitive
function assessments (1996-1998 and 2004-2006) and participated in the Dental ARIC Study ... 119 Figure 5-8. Scatterplots for the association between baseline cognitive
scores and change in the Delayed Word Recall by race, study sites, and dental status (n = 911) ... 120 Figure 5-9. Scatterplots for the association between baseline cognitive
scores and change in the Digit Symbol Substitution scores by race, study sites, and dental status dental status (n = 911) ... 121
Figure 5-10. Scatterplots for the association between baseline cognitive
scores and change in the Word Fluency scores by race, study sites, and dental status dental status (n = 911) ... 122
Figure B-1. Directed acyclic graph for associations between periodontal disease and cognitive function ... 143 Figure B-2. Directed acyclic graph for associations between tooth loss
and cognitive function ... 144 Figure C-1. Extent of probing pocket depth among Dental ARIC participants, by five levels of Biofilm-Gingival Interface classification (n = 6,700) ... 147 Figure C-2. Extent of attachment loss of Dental ARIC participants by five levels of Biofilm-Gingival Interface classification (n = 6,700) ... 148 Figure C-3. Density plot for a distribution of number of teeth for
Dental ARIC participants (n = 6,700) ... 151 Figure C-4. Boxplots for number of teeth by five levels of Biofilm-Gingival
Interface (BGI) classification for ARIC participants: A cross-sectional study (n = 5,966) ... 152 Figure C-5. Boxplots for number of teeth by five levels of Biofilm-Gingival
Interface (BGI) classification for ARIC participants: A cohort study (n = 558) ... 152
Figure D-1. Pearson correlation coefficients among three cognitive scores at 1996-1998 for ARIC participants (n = 11,097) ... 155 Figure D-2. Pearson correlation coefficients among three cognitive function
scores at 2004-2006 for ARIC participants (n = 1,101) ... 156 Figure D-3. Race- and gender-specific density plots for three cognitive
xv
Figure D-4. Density plots for a) Delayed Word Recall scores at a) 1996-1998 and 2004-2006; b) race- and gender-specific changes in Delayed Word Recall scores: A cohort study (n = 911) ... 160 Figure D-5. Density plots for a) Digit Symbol Substitution scores at
1996-1998 and 2004-2006; b) race- and gender-specific changes in Digit Symbol Substitution scores: A cohort study (n = 911) ... 161 Figure D-6. Density plots for a) Word Fluency scores at 1996-1998
xvi
LIST OF ABBREVIATIONS
AD Alzheimer Disease
ACT Antichymotrypsin
APOE Apolipoprotein E
ARIC The Atherosclerosis Risk in Communities BGI Biofilm-Gingival Interface
BMI Body Mass Index
BOP Bleeding on Probing
CAL Clinical Attachment Level
CDC/AAP Centers for Disease Control / American Academy of Periodontology
CHD Coronary Heart Disease
CI Confidence Interval
CRP C-Reactive Protein
DAG Directed Acyclic Graph
DL Deep Lesion
DWR Delayed Word Recall
DSS Digit Symbol Substitution
G Gingivitis
GCF Gingival Crevicular Fluid
GEE Generalized Estimating Equations
GLMs Generalized Linear Models
GR Gingival Recession
H Healthy
HR Hazard Ratio
xvii ICAM Intracellular Adhesion Molecule IPWS Inverse Probability Weights
LDL Low Density Lipoprotein
LB Low Bleeding
MB Moderate Bleeding
MCI Mild Cognitive Impairment
MMSE Mini-Mental State Examination
MRI Magnetic Resonance Imaging
MSM Marginal Structural Model
NHANES National Health and Nutrition Examination Survey NSAIDS Nonsteriodal Anti-Inflammatory Drugs
PGE2 Prostaglandin E2
PPD Probing Pocket Depth
PR Prevalence Ratio
OR Odds Ratio
WF Word Fluency
WMHs White Matter Hyperintensities
SB Severe Bleeding
SD Standard Deviation
SE Standard Error
SW Sulcal Width
TNF Tumor Necrosis Factor
VaD Vascular Dementia
xviii
VIF Variance Inflation Factor
LITERATURE REVIEW
A. Introduction
Dementia and cognitive impairment are major public health problems that are of growing concern in aging populations. Affected individuals become more dependent as cognitive impairment and dementia progress, disrupting their personal lives and those of their caregivers, as well as causing substantial expenditures for medical and long-term care services (1). At present, effective prevention or treatment is unavailable, and biological pathways contributing to cognitive impairment and dementia are not clearly understood.
B. Dementia and cognitive decline
Age-related cognitive decline, mild cognitive impairment, and dementia
Cognitive decline is a decrease in the ability of the brain to perform regular functions such as judgment, reasoning, memory, learning, and understanding. Decline can be a result of
neurodegenerative disease or the aging process (2). Neurodegenerative diseases that cause cognitive decline include Alzheimer disease (AD) and vascular dementia (VaD) (e.g., due to stroke). Cognitive aging is a result of aging-related changes in brain physiology, the cerebrovascular system, and neurochemical levels. The changes produce decreases in brain vascularization, reduction in
2
Older adults with MCI are at increased risk of developing dementia, a chronic and irreversible deterioration of cognition. Education is associated with lower rates of age-related cognitive decline because a high level of education may be a proxy indicator of cognitive reserve. Higher education level reflects better resilience and plasticity of cognitive networks that protect individuals from the negative effects of aging (3). Moreover, education attainment is related to risk factors for the underlying pathologic processes of dementia, such as lifetime patterns of health care use and health behaviors. Each year, about 10% to 15% of individuals with MCI are estimated to progress from MCI to dementia. In one study, progression rates from MCI to dementia were 2.3, 1.3, and 0.3/100 person-years for Alzheimer disease, vascular dementia, and other types of dementia, respectively (4). As the aging population is growing, attempts to identify MCI and predictors of progression from MCI to dementia become important, because MCI is treatable. Furthermore, the earlier the interventions occur, the greater the possibility to delay or stop the neurodegenerative process. Many studies, therefore, use brain imaging techniques and biomarkers in addition to
neuropsychological testing to identify people who are likely to progress from MCI to dementia (5-7).
Public health burden of cognitive decline and dementia
Cognitive decline and dementia are major public health problems affecting older adults in the United States (U.S.) and worldwide. Incidence and prevalence of dementia rise substantially with age (1). In the U.S., the prevalence of all types of dementia ranges from approximately 2% in people aged 65-69 up to more than 30% in people over 90 years of age (Figure 1-1). Incidence rates are between approximately 4 per 1000 person-years in people aged 65-69 and up to 60 per 1000 person-years among the group aged over 90 years old (8). The two most common types of dementia are AD and VaD, accounting for up to 75% of all dementia cases (4,8,9).
3
Furthermore, the 2012 report revealed that annual health care costs for patients with AD and other dementias were triple the health care costs for adults aged 65 and older without dementia (1). At the individual level, dementia results in physical disability, institutionalization, decreased quality of life, and increased risk of mortality. Therefore, it is essential to identify underlying mechanisms and treatable factors affecting clinical onset and progression of dementia.
C. Determinants of cognitive decline, dementia, and structural brain abnormalities
Advancing age and low education are prominent risk factors for age-related changes in cognitive function (1,3,8). Many observational studies have identified potential risk factors that may contribute to initiation and progression of dementia and cognitive decline, such as severe
atherosclerosis, hypertension, diabetes mellitus, hyperlipidemia, and smoking (6,8,11-13). However, few factors have sufficient evidence to support a causal association with cognitive decline and dementia. Stroke and cardiovascular risk factors are consistently reported as risk factors for
neurocognitive disease, particularly VaD. Several studies have also related genetic factors as well as systemic infection and inflammation to both AD and VaD (7,14-16). However, specific underlying mechanisms of AD and VaD have not been clearly characterized (8,9). Neurodegenerative changes (i.e., progressive brain atrophy and accumulations of cortical senile plaques and neurofibrillary tangles) in AD and cerebral infarction in VaD may lead toneuronal or axonal loss, impairing
cognitive function. Since AD and VaD are the two most prevalent dementia subtypes, the following is a summary of major risk factors that may contribute to cognitive impairment caused by AD or VaD pathogeneses. Relevant findings from ARIC studies are summarized in Table 7-1.
APOE genotype
Despite uncertainty about the causes of cognitive impairment and dementia, genetic factors are accepted as part of the etiology, particularly the association between the apolipoprotein E (APOE)
4
found in demented compared to non-demented people, with an apparent dose-response relationship (16,18). Compared to individuals with the ε3/ε3 genotype, the risk of dementia hospitalization for
persons with the ε4/ε4 genotype was highest, followed by those with ε3/ε4 genotype (19). Several
longitudinal studies have shown a greater cognitive decline among non-demented people who are carriers of the APOE ε4 allele(11,14).
In the ARIC cohort, associations between the APOE genotype and cognitive decline among middle-aged white participants have been reported. The greatest cognitive decline was found in participants with combinations of APOE ε4 with cardiovascular risk factors, particularly
hypercholesterolemia or diabetes, suggesting a synergistic effect (14). Likewise,in a Dutch study, AD and VaD were associated with atherosclerosis, and the association was pronounced in participants with APOE ε4 (20).
The relationships of APOE ε4 with cognitive decline and dementia are well-documented
(18-20); however, the underlying mechanisms are unknown. A possible mechanism is that APOE enhances proteolytic breakdown of peptide beta-amyloid protein in the brain, both within and between cells, and the isoform APOE ε4 is not as efficient as other isoforms in catalyzing this
reaction. Consequently, individuals with the APOE ε4 variation tend to accumulate beta-amyloid
protein, predisposing to AD. In addition to an increased risk of AD, APOE ε4 also increases risk of
cardiovascular disease as a result of impaired cholesterol transport and metabolism (18,21).
Stroke and cardiovascular risk factors
5
VaD (16). The observed associations among stroke CHD, and cognitive decline may also be due to sharing several common risk factors such as low education, smoking, and diabetes mellitus
(8,12,16,22).
Stroke: Stroke causes cognitive and motor impairments that are both acute and chronic. History of stroke is also a risk factor for developing dementia (16). In ARIC, a follow-up study conducted over a 14-year period found that stroke was associated with a decline in performance on the DWR and WF test scores but not on the DSS test (11).
CHD: Evidence from studies examining an association between CHD and cognitive performance is inconsistent. Two large epidemiologic studies have reported an association between CHD and lower cognitive scores (22,23) Another study with fewer participants did not observe the association between CHD and dementia diagnosis (24). Low cardiac output, brain hypoperfusion, and cardiac microembolization after myocardial infraction have been proposed as possible causal
pathways of cognitive impairment.
Hypertension: Hypertension in midlife is a strong risk factor for cognitive decline, cerebral abnormalities, and dementia (12). In the ARIC cohort, baseline hypertension was associated with a decline only in the DSS test score (25).
Diabetes: Studies have shown a clear association of diabetes with both cognitive decline and dementia (19). People with diabetes at baseline exhibited greater decline in cognitive function over the six-year interval. Of the three cognitive tests (DWR, DSS, and WF), change in the DSS scores was most strongly associated with diabetes(25). Associations between clinical signs or symptoms related to diabetes and cognitive disorders, however, were inconsistent (26,27). Cognitive decline was not correlated with hyperglycemia (26), but a relation was detected with hyperinsulinemia (27).
6
middle-aged adults after follow-up for 6 years in the ARIC study (25). Nonetheless,
hypercholesterolemia, elevated total cholesterol in midlife, was associated with dementia incidence in a longitudinal study with an average follow-up of 12.8 years (19).
Smoking: A cross-sectional study reported a dose-response relation between cigarette smoking and silent cerebral infarction, in which infarction prevalence was highest for current smokers, followed by ex-smokers, persons exposed only to environmental tobacco smoking, and nonsmokers (29). A 14-year prospective study of the ARIC cohort found smoking to be the primary risk factor for dementia incidence (19). However, in another prospective study with a follow-up interval of 6 years in the same cohort, the most important risk factors for cognitive decline were diabetes and hypertension; the association of cognitive decline with cigarette smoking was not significant (25).
Alcohol consumption: A previous study has shown a protective effect of low and moderate alcohol consumption on stroke (30). In the ARIC study, current drinkers had higher baseline scores for cognitive performance than nondrinkers (31). Alcohol intake was not associated with the presence of brain infarction lesions. However, a positive correlation between number of alcoholic drinks per week and brain atrophy was observed (32).
Systemic infection and inflammation
Viral or bacterial pathogens and inflammation have the potential to cause neurocognitive disease; however, the specific mechanisms are unknown. Several types of data including post-mortem examinations have suggested that chronic infection and inflammation might contribute to the
7
(e.g. C. pneumoniae), and periodontal pathogenic spirochetes (e.g., T. denticola, T. pectinovorum, T. vincenti, T. amylovorum, T. maltophilum, T. medium, and T. socrankii) have been detected in the brains of demented patients, suggesting other possible risk factors for AD (42-44). Observational studies have also shown the benefits of using long-term, nonsteroidal anti-inflammatory drug (NSAIDs) to prevent or slow cognitive decline; however, results from clinical trials have failed to confirm any positive effect on cognition (7,13).
D. Associations of oral health measures with cognitive function
Public health burden of periodontal disease and tooth loss in adults
Periodontal disease is defined as a chronic infectious disease that causes inflammation of periodontal tissues and destruction of the periodontal ligament that attaches the tooth to its bony socket. Periodontal disease is associated with increased systemic inflammatory markers such as CRP and local inflammatory levels such as gingival crevicular fluid (GCF) prostaglandin E2 (PGE2)
(17,45). As a result of inconsistent case definitions for PD, there is a difficulty in comparing the disease prevalence and incidence estimates across epidemiologic studies (46). Overall, prevalence of periodontal disease has declined in the U.S. population. The Third National Health and Nutrition Examination Survey: NHANES III (1998-1994) estimated that 10% of adults (20-64 years) had moderate or severe periodontal disease compared with 5% in 1999-20041, using the same case
definition. Moderate or severe periodontitis decreased from approximately 27% to 17% between 1988-1994 and 1999-2004 among adults aged 65 years and older (47). However, these data, which
1The Centers for Disease Control and Prevention/ The American Academy of Periodontology (CDC/AAP) case definitions were applied.
8
obtained using a partial-mouth protocol (i.e. one maxillary and one mandibular quadrant), underestimate true prevalence observed when all periodontal tissues are assessed (48).
A recent NHANES (2009-2010), which is the first national survey to use a full mouth protocol, reported that total prevalence of periodontitis ranged from 24.4% in adults 30-34 years old to 70.1% in adults aged 65 years and older. Prevalence of mild, moderate, and severe periodontitis in adults aged 30 years and older was 8.7%, 30.0%, and 8.5%, respectively (49).
Advanced periodontal disease destroys the periodontal ligament, loosening the tooth and contributing to tooth loss. Tooth loss has been described as a clinically-meaningful outcome of dental caries and periodontal disease (50), although in all age groups, dental caries is a more common underlying cause of tooth loss (51). Complete tooth loss (edentulism) is common among older adults aged 65 or older worldwide. The positive association with age can be attributable primarily to elevated rates of tooth loss in generations born in the first half of the 20th century (52).At present, prevalence of complete tooth loss is declining in the U.S. For adults (20-64 years) the prevalence of edentulism decreased from approximately 6% during 1988-1994 to 4% during 1999-2004. For older adults (65-74 years), complete tooth loss was 24% in 1999-2004 compared with 29% in 1988-1994 (47). The recent NHANES (2009-2010) reported that 15% of adults 65-74 years old and 22% of adults 75 years and older were edentulous (53). Tooth loss affects not only chewing ability and nutritional status (54,55), but also quality of life and self-sufficiency (21,56). Associations of tooth loss with an increased risk of stroke, mortality, and elevated inflammatory markers have also been shown (57,58).
Bidirectional associations between oral health measures and cognitive function
9
socioeconomic status, smoking, and diabetes mellitus. Furthermore, the association likely is bidirectional and the underlying mechanisms remain unclear.
There are several proposed explanations as to how cognitive decline might contribute to dental caries, severe periodontal disease, and tooth loss (66,67). First, older adults with impaired memory and reduced physical function lack the capacity to perform proper oral health care (66). Second, older individuals are less likely to receive regular dental care (68). Third, decreased saliva production is a side effect of many commonly prescribed medications used to treat depressive symptoms in demented people, thereby impairing oral clearance and neutralization of dental plaque acid (69). Recently, two large observational studies suggest that socioeconomic inequalities in oral health might explain the relationship between cognitive ability and oral health. The authors proposed that low cognitive ability limits education achievement and income, and thus impairs self-care, which may lead to poor oral health (60,70).
Poor oral health resulting from cognitive impairment has been confirmed in many studies, but several findings have suggested that the reverse association is plausible. Periodontal disease and tooth loss in midlife may lead to early onset and rapid progression of cognitive decline (59,61,71). A longitudinal study of aging and AD suggested that a low number of teeth (0-9) was related to
increased prevalence and incidence of dementia (72), and the decline in cognitive function was more rapid for those who carried the APOE ε4 allele(73). A case-control study in monozygotic twins
10
Several biologically plausible pathways have been proposed for a causal effect of oral disease on cognition. However, most evidence comes from cross-sectional studies (65,71,76,77), longitudinal studies with small sample size (61,73,78,79), and varieties of periodontal case definitions and
cognitive tests (Appendix A). Potential mechanisms include inflammatory mediators produced in response to periodontal pathogens (76), dissemination of gram-negative bacteria to the brain, and increased risk of stroke and cerebrovascular injury (17,80-83).
Contribution of periodontal disease and tooth loss to cognitive decline and dementia
Periodontal pathogens can induce systemic inflammation. Previous studies have showed the involvement of inflammation in AD, though it remains unclear whether the inflammatory process is related specifically to initiation or progression of the disease. Elevation of inflammatory
biomarkers, such as serum CRP, has been associated with periodontal pathogens, periodontitis, and dementia (76,80,82,84). NHANES III revealed a positive association between systemic exposure to P. gingivalis (measured as serum antibody to P. gingivalis) and poor cognition (85). Thus, it has been hypothesized that periodontal pathogens may influence neuropathogenesis of dementia via the inflammatory process (41). Lipopolysaccharide, a bacterial endotoxin, from periodontal pathogens can stimulateproinflammatory cytokines as well as CD14 activity, resulting in chronic elevation of systemic inflammatory markers. In addition, chronic periodontitis may result in long-term locally increased proinflammatory molecules that surround the trigeminal cranial nerve endings (6).
Hypothetically, then, periodontal-derived cytokines could reach the brain by both systemic and neural pathways and amplify brain cytokine pools, contributing to the progression of dementia (33,41,81).
Periodontal pathogens can invade brain tissue. Periodontal pathogens such as P.
11
have Treponema (42-44). These finding suggested that oral bacteria may be capable of invading brain tissue via peripheral nerve fibers.
Periodontal disease may increase risk for CHD and stroke. Previous studies discussed several potential mechanisms relating periodontal disease and CHD, including bacteremia, systemic inflammation, and vascular injury (45,86).Periodontal pathogens have been found in atherosclerotic plaques, and they mayinduce vascular pathology through their cytotoxicity or inflammatory process. It has been shown that chronic, low-grade inflammation in response to periodontal infection may contribute to the development of atherosclerosis or CHD(45,83). Systemic inflammatory biomarkers, which are elevated in people with PD and CHD, include CRP, IL-6, tumor necrotic factor-alpha (TNF-α), and fibrinogen (45,87). Since PD is associated with elevated risk of stroke and CHD
(83,87), which are risk factors for dementia (4,22), the elevated risk of dementia among people with periodontal disease may be mediated by CHD and stroke. Nonetheless, a recent review by Lockhart
et.al. (2012) concluded that although current evidence suggests an independent association between periodontal disease and cardiovascular diseases, the evidence is insufficient to demonstrate the causal relationship (88).
Tooth loss results in malnutrition. Weight loss and deficiency of vitamin B6 have been suggested as potential risk factors for dementia (8,89). Tooth loss can lead to impaired masticatory function, thereby influencing food choices and nutritional status. However, a review study found that most studies reported a weak association between tooth retention, masticatory function and nutrition, and thus a definite casual effect cannot be established (90). In an animal model, the loss of molar teeth resulted in reduced mastication and impairment of spatial memory (91,92).
12
body of evidence from longitudinal studies with standardized measures of periodontal disease and tooth loss as well as careful follow-up. From a public health perspective, if further studies
consistently identify periodontal disease as a risk factor for cognitive decline and dementia, the implications are significant since periodontal disease is treatable and preventable. Therefore,
epidemiological studies investigating the relationship of periodontal disease as well as tooth loss with cognitive function are warranted.
E. Cognitive assessments
Changes in cognitive function may occur in one or more cognitive domains and those domains may change differentially within an individual (2). Cognitive screening assessments aim to objectively assess a patient’s history of cognitive deficits or chief symptoms (3). Many instruments and approaches are available to screen for cognitive impairment, but none covers all cognitive domains (93). In addition, patterns of impairment differ among subtypes of dementia, and thus, no single test can accurately screen for all forms of dementia. Most instruments focus on memory impairment, a common symptom of AD at the initial stage of disease. In addition to memory loss, AD can manifest as gradually progressive neuropsychological deficits with, for example, dysphasia or subtle abnormalities in executive function. A well-known instrument for AD screening, the Mini-Mental State Examination (MMSE), is a brief and focused screen of cognitive domains most often affected in AD. This test includes items such as asking patients to name actual time and place of the test, repeat lists of words, perform arithmetic (e.g., serial sevens), and perform tasks involving
language use and comprehension as well as basic motor skills. Possible scores range from 0 to 30, and scores between 21 and 24 indicate MCI. Since MMSE is very limited in evaluating executive
13
Each dementia subtype is characterized by different cognitive domain deficits. In comparison with people with AD, those with VaD tend to score lower on tests of executive function, such as verbal fluency, and their level of memory impairment is usually less severe. Similarly, people with frontotemporal dementia typically possess reduced letter fluency and executive function than people with AD, but their memory performance is often better.Individuals diagnosed as Lewy body dementia are even more dysfunctional in areas such as attention, visuospatial tasks, letter fluency, mental tracking, and abstract reasoning. Therefore, a comprehensive screening instrument should cover the following six core domains: a) attention/working memory; b) new verbal learning and recall; c) expressive language; d) visual construction; e) executive function; and f) abstract reasoning (93).
There is no consensus regarding a standard screening test; using both formal and informal assessments may provide more information about people’s cognitive performance. A formal test provides a summary measure of cognitive performance, but that measure may be influenced by anxiety on the part of the subject. An informal evaluation, carried out through a conversation using simple questions, may permit a more realistic assessment of cognitive performance in relation to cognitive deficits, but will not provide a summary score.
Cognitive function assessment in the ARIC study
The entire ARIC cohort completed two neurocognitive function assessments at both Visits 2 and 4 (Figure 3-1). For those who participated in the Brain MRI study, cognitive function
14
nonverbal), language, visuospatial, attention, executive function, motor function, and premorbid intelligence. However, Visit 5 data collection was not complete at the time of writing this dissertation.
A previous ARIC study reported that DWR, DSS, and WF scores at baseline were normally distributed and negatively associated with age (31). Participants aged 65-69 years had lower cognitive scores compared to those who were younger, and women had higher average scores than men for every age group. In addition to demographic characteristics, baseline cognitive function was also associated with cardiovascular risk factors, including smoking status, alcohol use, depressive symptoms, diabetes, and hypertension. A subset of ARIC participants was followed for fourteen years. An analysis found that stroke, diabetes, hypertension, metabolic syndrome, and APOE genotype predicted cognitive decline. However, the magnitude of changes for the DWR, DSS, and WF scores was relatively small (11) (Table 1-2).
F. Neuroimaging
Neuroimaging provides a sensitive and noninvasive method for detecting subclinical abnormalities in both cortical and subcortical brain structures. With the introduction of MRI, a number of recent studies have focused on assessing brain structural changes in normal aging, especially hippocampal-parahippocampal atrophy to detect early AD and MCI (5,95). Positive correlations between variation in brain structure and cognitive function have also been shown in healthy adults, particularly in domains such as processing speed, executive function, and memory (5,96). However, the basis for cerebral-cognitive relationships observed in current studies remains unclear.
15
Atherosclerosis of arteries and arterioles supplying blood to white matter may cause neurovascular changes as well as a reduction in myelination. The degradation and disruption of these white matter pathways will then result in cognitive deficits. Greater brain volume has been thought to be a protective factor for neurocognitive disorders, including cognitive aging. Ventricular and sulcal size as measures of brain volume have been associated with reduced cognitive function in both normal aging and AD (5,96,98). A longitudinal study in AD patients suggested that greater ventricular size measured on MRI might be a marker for preclinical AD neuropathology (98). Several pathologies such as neuronal loss, brain tissue density reduction, white matter degeneration, and microvascular pathology can result in decreased brain volume or brain atrophy (5,95,97).
Brain MRI assessment in the ARIC study
A study using ARIC Visit 3 data reported prevalence of brain neurodegenerative changes by comparison subjects’ MRI images with standardized images that successively increased from barely detectable (score 1) to extensive change (score 8). Studies with no change received score 0, and those with changes worse than score 8 received score 9. A high-grade abnormality was defined as
ventricular grade 4 or higher (14%), sulcal size grade 3 or higher (26%), and WMHs grade 3 or higher (11%). Associations between these abnormalities and cognitive test scores have been reported (high grade WMHs with DWR, DSS, and WF; high ventricular grade with DWR and DSS; and high sulcal grade with DWR scores) (96). Two other ARIC studies reported that brain atrophy was
16 G. Periodontal disease assessments
Clinical measures used to define periodontal disease
Previous literature reviews highlighted methodological problems in studying periodontal epidemiology, particularly a lack of uniform criteria used to define periodontitis (48,100,101). Most periodontal indicesare developed by using clinical signs and symptoms of gingival inflammation, such as bleeding on probing (BOP) and destruction of periodontal supporting tissue, as measured by alveolar bone loss or attachment loss (AL)1. Other clinical measures that may be included are gingival recession (GR) and pocket probing depth (PPD2). Attachment loss is considered to be the gold standard for measuring the history of periodontal disease and its progression, as opposed to current disease activity (102). Inconsistencies in the use of disease indicators and a threshold for quantifying severity of periodontitis lead to multiple case definitions of periodontal disease. These methodological issues also arise from a difference in areas of the mouth surveyed (e.g., full-mouth, partial-mouth, or index teeth), periodontal probes, and techniques used to measure PPD and AL (100,101,103). As a result, it is very difficult to compare PD occurrence across studies.
Centers for Disease Control/ American Academy of Periodontology (CDC/AAP) classification In 2003, a working group appointed by the CDC and AAP developed a standardized clinical case definition for population-based studies of periodontitis based on measurements of PPD and AL. The case definition for moderate periodontitis requires at least two sites on different teeth have interproximal AL > 4 mm or interproximal PPD > 5 mm. Severe periodontitis was defined as two or more interproximal sites with AL ≥ 6 mm, not on the same tooth, and at least one interproximal site
with PPD ≥ 5 mm.(104).Nonetheless, validity of prevalence or incidence estimation largely depends
on examination protocols, where the full mouth approach serves as “a gold standard”. A recent
17
validation study demonstrated that partial mouth protocols using the CDC/AAP definition
underestimated the prevalence of severe and moderate periodontitis by 63% and 59%, respectively (48). Using this case definition, prevalence of severe periodontitis in Dental ARIC was 16.9% (83). The Dental ARIC study used the full mouth protocol to measure periodontal disease in the ARIC cohort. Thus, the estimated periodontal disease prevalence is unlikely to be underestimated due to the examination protocol.
Biofilm-Gingival Interface (BGI) index
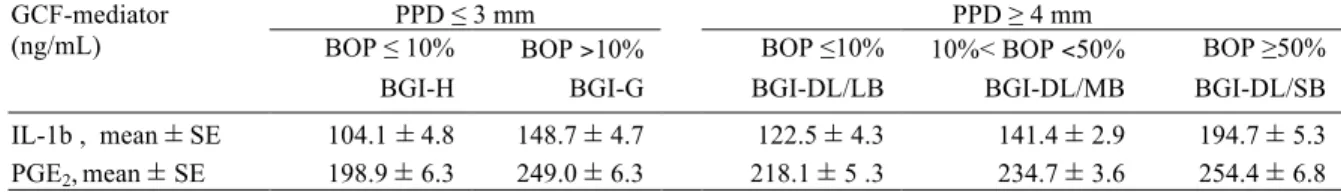
Unlike attachment loss or tooth loss that are historical markers of periodontal disease and treatment, the BGI index has been developed based on a concept that clinical disease classification should reflect an underlying biological process of periodontal disease that involves a complex interaction of the microorganisms with host inflammatory and immune response. Two clinical signs of disease, PPD and BOP, were used to create this case definition. The concept underlying the BGI is that periodontal disease represents pathology at the biofilm-gingival interface, which is bordered on the gingival tissue side by the epithelium and subgingival plaque within the pocket. Five levels of BGI were defined based on the extent of PPD (e.g., no periodontal pockets; PPD ≤ 3 mm vs. had
periodontal pockets; PPD ≥ 4 mm) in combination with bleeding scores (e.g., low, LB; moderate, MB; or severe, SB) (Table 3-2). A study showed that levels of inflammatory mediators within the periodontal pockets (e.g., Interleukin 1-beta (IL-1β) and PGE2) were lowest among those with healthy
periodontal tissue and increased significantly among subjects with gingivitis and periodontitis. The higher levels of gingival crevicular fluid (GCF) inflammatory markers were related to severe BOP conditions. In addition, the presence of periodontal pathogens was associated with each BGI group. For example, C. rectus was associated with gingivitis, BGI-DL/MB and BGI-DL/SB; P. gingivalis
18 Gingival crevicular fluid (GCF) inflammatory markers
Evidence from epidemiological and microbiological studies reveal that microorganisms associated with periodontal disease are also found in healthy individuals and at sites where periodontal disease is not progressing. Moreover, an individual’s disease severity or extent is not associated with levels of plaque control. These findings led to the current concept that periodontal disease progression is highly dependent upon inflammatory host response to localized microbial plaque challenge (17,105,106). Lipopolysaccharide, a cell-wall component of gram negative bacteria, triggers monocytes to release inflammatory mediators that increase local destruction of the
periodontium. Therefore, levels of monocyte inflammatory mediators in GCF, such as PGE2, IL-1β,
IL-6, IL-8, TNF, and collagenase can be markers of periodontal disease activity at the site level. It has been demonstrated that GCF composition reflects the nature and amplitude of the inflammatory host response to bacterial plaque and periodontal status (17,102,107). A systemic host response to periodontal disease is evidence by serum antibodies to common oral bacteria such as P. gingivalis
(85,106), and elevation in serum inflammatory markers such as serum CRP and sICAM (17,80,82,83).
The Dental ARIC study reported levels of GCF-inflammatory markers in association withBGI index (Table 1-3). Compared to healthy subjects (BGI-H), all four categories had significantly increased GCF-levels of IL-1b and PGE2. Increased expression of the
H. Tables
Table 1-1. Inflammatory markers associated with cognitive decline and dementia in epidemiologic studies
Study n Inflammatory markers Outcomes
Framingham study (35) 619 IL-1
Tumor necrosis factor alpha (TNF-α)
Dementia
MacArthur studies (36) 779 IL-6 Cognitive decline
Health ABC study (37) 3,031 IL-6 CRP TNF-α
Cognitive decline
Rotterdam study (38) 188 cases
727 controls IL-6 CRP
α-1 antichymotrypsin (ACT)
Dementia
Leiden 85+ study (39) 599 TNF-α
IL-10
Cognitive decline
Honolulu-Asia Aging study (33) 1,050 CRP Dementia
Longitudinal aging study Amsterdam (40)
1,284 α-1 antichymotrypsin (ACT) Cognitive decline Greek community (15) 37 cases
33 controls CRP Intracellular adhesion molecule (ICAM-1) Vascular cell adhesion molecule (VCAM-1)
Cognitive decline
Table was modified from Watts A, Crimmins EM, Gatx M. Inflammation as a potential mediator for the association between periodontal disease and Alzheimer’s disease. Neuropsychiatric Disease and Treatment 2008;4(5):865-76.(81)
Table 1-2. Test scores in the ARIC MRI study among participants who completed cognitive tests on all four follow-ups
Cognitive assessment Visit 2
(1990-1992) (1993-1995) Visit 3 (1996-1998) Visit 4 2004-2006 Delayed word recall 6.6 (1.4) 6.6 (1.6) 6.7 (1.5) 6.0 (1.7) Digit symbol substitution 41.1 (13.2) 40.7 (14.4) 40.4 (14.0) 36.7 (13.2) Word fluency 33.3 (12.1) 33.2 (12.8) 33.4 (12.8) 31.6 (12.3)
Means (standard deviations) of test scores for 1,018 participants.
Table was adapted from Knopman DS, Fourteen-year longitudinal study of cardiovascular risk factors, APOE genotype, and cognition: The ARIC study. Alzheimer’s & Dementia 2009(5):207-14. (11)
Table 1-3. Gingival crevicular fluid-mediator levels and Biofilm-Gingival Interface categories GCF-mediator
(ng/mL)
PPD ≤ 3 mm PPD ≥ 4 mm
BOP ≤ 10% BOP >10% BOP ≤10% 10%< BOP <50% BOP ≥50% BGI-H BGI-G BGI-DL/LB BGI-DL/MB BGI-DL/SB IL-1b , mean ± SE 104.1 ± 4.8 148.7 ± 4.7 122.5 ± 4.3 141.4 ± 2.9 194.7 ± 5.3 PGE2, mean ± SE 198.9 ± 6.3 249.0 ± 6.3 218.1 ± 5 .3 234.7 ± 3.6 254.4 ± 6.8
20 I. Figures
21 References
1. Alzheimer's association. 2012 Alzheimer's Facts and Figures. Alzheimers Dement. 2012;8(2):131–168.
2. Salthouse TA. Selective review of cognitive aging. J Int Neuropsychol Soc. 2010;16(5):754– 760.
3. Drag LL, Bieliauskas LA. Contemporary review 2009: cognitive aging. J Geriatr Psychiatry Neurol. 2010;23(2):75–93.
4. Solfrizzi V, Panza F, Colacicco AM, et al. Vascular risk factors, incidence of MCI, and rates of progression to dementia. Neurology. 2004;63(10):1882–1891.
5. Söderlund H, Nilsson L-G, Berger K, et al. Cerebral changes on MRI and cognitive function: the CASCADE study. Neurobiol of Aging. 2006;27(1):16–23.
6. Solfrizzi V, D'Introno A, Colacicco AM, et al. Circulating biomarkers of cognitive decline and dementia. Clinica Chimica Acta. 2006;364(1-2):91–112.
7. Gorelick PB. Role of inflammation in cognitive impairment: results of observational epidemiological studies and clinical trials. Ann N Y Acad Sci. 2010;1207(1):155–162. 8. Qiu C, Kivipelto M, Strauss von E. Epidemiology of Alzheimer's disease: occurrence,
determinants, and strategies toward intervention. Dialogues Clin Neurosci. 2009;11(2):111– 128.
9. Hampel H, Prvulovic D, Teipel S, et al. The future of Alzheimer's disease: The next 10 years.
Prog Neurobiol. 2011;95(4):718–728.
10. Hebert LE, Scherr PA, Bienias JL, et al. Alzheimer disease in the US population: prevalence estimates using the 2000 census. Arch Neurol. 2003;60(8):1119–1122.
11. Knopman D, Mosley TH, Catellier DJ, et al. Fourteen-year longitudinal study of vascular risk factors, APOE genotype, and cognition: the ARIC MRI Study. Alzheimers Dement.
2009;5(3):207–214.
12. Knopman D, Penman A, Catellier D, et al. Vascular risk factors and longitudinal changes on brain MRI: The ARIC study. Neurology. 2011;76(22):1879–1885.
13. Plassman BL, Williams JW, Burke JR, et al. Systematic review: factors associated with risk for and possible prevention of cognitive decline in later life. Ann Intern Med. 2010;153(3):182– 193.
14. Blair CK, Folsom AR, Knopman DS, et al. APOE genotype and cognitive decline in a middle-aged cohort. Neurology. 2005;64(2):268–276.
15. Dimopoulos N, Piperi C, Salonicioti A, et al. Indices of low-grade chronic inflammation correlate with early cognitive deterioration in an elderly Greek population. Neurosci Lett.
22
16. Sahathevan R, Brodtmann A, Donnan GA. Dementia, stroke, and vascular risk factors; a review. Int J Stroke. 2011;7(1):61–73.
17. Offenbacher S, Barros SP, Singer RE, et al. Periodontal Disease at the Biofilm–Gingival Interface. J Periodontol. 2007;78(10):1911–1925.
18. Williamson J, Goldman J, Marder KS. Genetic Aspects of Alzheimer Disease. The Neurologist. 2009;15(2):80–86.
19. Alonso A, Mosley TH, Gottesman RF, et al. Risk of dementia hospitalisation associated with cardiovascular risk factors in midlife and older age: the Atherosclerosis Risk in Communities (ARIC) study. J Neurol Neurosurg Psychiatry. 2009;80(11):1194–1201.
20. Hofman A, Ott A, Breteler MM, et al. Atherosclerosis, apolipoprotein E, and prevalence of dementia and Alzheimer's disease in the Rotterdam Study. The Lancet. 1997;349(9046):151– 154.
21. Musacchio E, Perissinotto E, Binotto P, et al. Tooth loss in the elderly and its association with nutritional status, socio-economic and lifestyle factors. Acta Odontol. Scand. 2007;65(2):78–86. 22. Singh-Manoux A, Sabia S, Lajnef M, et al. History of coronary heart disease and cognitive
performance in midlife: the Whitehall II study. Eur Heart J. 2008;29(17):2100–2107.
23. Breteler MM, Claus JJ, Grobbee DE, et al. Cardiovascular disease and distribution of cognitive function in elderly people: the Rotterdam Study. BMJ. 1994;308(6944):1604–1608.
24. Bursi F, Rocca WA, Killian JM, et al. Heart disease and dementia: a population-based study.
Am J Epidemiol. 2006;163(2):135–141.
25. Knopman D, Boland LL, Mosley T, et al. Cardiovascular risk factors and cognitive decline in middle-aged adults. Neurology. 2001;56(1):42–48.
26. Christman AL, Matsushita K, Gottesman RF, et al. Glycated haemoglobin and cognitive decline: the Atherosclerosis Risk in Communities (ARIC) study. Diabetologia.
2011;54(7):1645–1652.
27. Young SE, Mainous AG, Carnemolla M. Hyperinsulinemia and cognitive decline in a middle-aged cohort. Diabetes Care. 2006;29(12):2688–2693.
28. Knopman D, Roberts R. Vascular risk factors: imaging and neuropathologic correlates. J Alzheimers Dis. 2010;20(3):699–709.
29. Howard G, Wagenknecht LE, Cai J, et al. Cigarette Smoking and Other Risk Factors for Silent Cerebral Infarction in the General Population. Stroke. 1998;29(5):913–917.
30. Weyerer S, Schäufele M, Wiese B, et al. Current alcohol consumption and its relationship to incident dementia: results from a 3-year follow-up study among primary care attenders aged 75 years and older. Age Ageing. 2011;40(4):456–463.
1998;44(2):95–105.
32. Ding J, Eigenbrodt ML, Mosley TH, et al. Alcohol intake and cerebral abnormalities on magnetic resonance imaging in a community-based population of middle-aged adults: the Atherosclerosis Risk in Communities (ARIC) study. Stroke. 2004;35(1):16–21.
33. Schmidt R, Schmidt H, Curb JD, et al. Early inflammation and dementia: A 25-year follow-up of the Honolulu-Asia aging study. Ann Neurol. 2002;52(2):168–174.
34. Laurin D, David Curb J, Masaki KH, et al. Midlife C-reactive protein and risk of cognitive decline: A 31-year follow-up. Neurobiology of Aging. 2009;30(11):1724–1727.
35. Tan ZS, Beiser AS, Vasan RS, et al. Inflammatory markers and the risk of Alzheimer disease: the Framingham Study. Neurology. 2007;68(22):1902–1908.
36. Weaver JD, Huang M-H, Albert M, et al. Interleukin-6 and risk of cognitive decline: MacArthur studies of successful aging. Neurology. 2002;59(3):371–378.
37. Yaffe K, Lindquist K, Penninx BW, et al. Inflammatory markers and cognition in well-functioning African-American and white elders. Neurology. 2003;61(1):76–80.
38. Engelhart MJ, Geerlings MI, Meijer J, et al. Inflammatory proteins in plasma and the risk of dementia: the rotterdam study. Arch Neurol. 2004;61(5):668–672.
39. van Exel E, de Craen AJM, Remarque EJ, et al. Interaction of atherosclerosis and inflammation in elderly subjects with poor cognitive function. Neurology. 2003;61(12):1695–1701.
40. Dik MG, Jonker C, Hack CE, et al. Serum inflammatory proteins and cognitive decline in older persons. Neurology. 2005;64(8):1371–1377.
41. Kamer AR, Craig RG, Dasanayake AP, et al. Inflammation and Alzheimer's disease: possible role of periodontal diseases. Alzheimers Dement. 2008;4(4):242–250.
42. Riviere GR, Riviere KH, Smith KS. Molecular and immunological evidence of oral Treponema in the human brain and their association with Alzheimer's disease. Oral Microbiol. Immunol.
2002;17(2):113–118.
43. Miklossy J. Alzheimer's disease - a neurospirochetosis. Analysis of the evidence following Koch‘s and Hill’s criteria. J Neuroinflammation. 2011;8:90.
44. Itzhaki RF, Wozniak MA, Appelt DM, et al. Infiltration of the brain by pathogens causes Alzheimer's disease. Neurobiol Aging. 2004;25(5):619–627.
45. Joshipura KJ, Wand HC, Merchant AT, et al. Periodontal Disease and Biomarkers Related to Cardiovascular Disease. J Dent Res. 2004;83(2):151–155.
46. Kingman A, Albandar JM. Methodological aspects of epidemiological studies of periodontal diseases. Periodontol. 2000. 2002;29:11–30.
24
48. Eke PI, Thornton-Evans GO, Wei L, et al. Accuracy of NHANES Periodontal Examination Protocols. J Dent Res. 2010;89(11):1208–1213.
49. Eke PI, Dye BA, Wei L, et al. Prevalence of Periodontitis in Adults in the United States: 2009 and 2010. J Dent Res. 2012;91(10):914–920.
50. Hujoel PP, DeRouen TA. A survey of endpoint characteristics in periodontal clinical trials published 1988-1992, and implications for future studies. J Clin Periodontol. 1995;22(5):397– 407.
51. Burt BA, Eklund SA. Dentistry, dental practice, and the community. 6thed. St Louis, MO; Elsevier: pp 228-229.
52. Thompson GW, Kreisel PS. The impact of the demographics of aging and the edentulous condition on dental care services. J Prosthet Dent. 1998;79(1):56–59.
53. Dye BA, Thornton-Evans G. Oral health disparities as determined by selective healthy people 2020 oral health objectives for the United States, 2009-2010. CDC, NCHS Data Brief. 2012;104:1–8.
54. Nowjack-Raymer RE, Sheiham A. Numbers of natural teeth, diet, and nutritional status in US adults. J Dent Res. 2007;86(12):1171–1175.
55. Savoca MR, Arcury TA, Leng X, et al. Severe tooth loss in older adults as a key indicator of compromised dietary quality. Public Health Nutr. 2010;13(4):466–474.
56. Gerritsen AE, Allen PF, Witter DJ, et al. Tooth loss and oral health-related quality of life: a systematic review and meta-analysis. Health Qual Life Outcomes. 2010;8:126.
57. You Z, Cushman M, Jenny NS, et al. Tooth loss, systemic inflammation, and prevalent stroke among participants in the reasons for geographic and racial difference in stroke (REGARDS) study. Atherosclerosis. 2009;203(2):615–619.
58. Polzer I, Schwahn C, Völzke H, et al. The association of tooth loss with all-cause and circulatory mortality. Is there a benefit of replaced teeth? A systematic review and meta-analysis. Clin Oral Investig. 2012;16(2):333–351.
59. Batty GD, Li Q, Huxley R, et al. Oral disease in relation to future risk of dementia and cognitive decline: Prospective cohort study based on the Action in Diabetes and Vascular Disease: Preterax and Diamicron Modified-Release Controlled Evaluation (ADVANCE) trial.
European Psychiatry. 2011;XX:1–4 (Epub).
60. Matthews JC, You Z, Wadley VG, et al. The association between self-reported tooth loss and cognitive function in the REasons for Geographic And Racial Differences in Stroke study: an assessment of potential pathways. J Am Dent Assoc. 2011;142(4):379–390.
61. Kaye EK, Valencia A, Baba N, et al. Tooth loss and periodontal disease predict poor cognitive function in older men. J Am Geriatr Soc. 2010;58(4):713–718.
63. Yu Y-H. Association Between Cognitive Function and Periodontal Disease in Older Adults. J Am Geriatr Soc. 2008;56:1693–1697.
64. Kamer AR, Morse DE, Holm-Pedersen P, et al. Periodontal inflammation in relation to
cognitive function in an older adult Danish population. J Alzheimers Dis. 2012;28(3):613–624. 65. Stewart R, Sabbah W, Tsakos G, et al. Oral health and cognitive function in the Third National
Health and Nutrition Examination Survey (NHANES III). Psychosom Med. 2008;70(8):936– 941.
66. Avlund K, Holm-Pedersen P, Morse DE, et al. Tooth loss and caries prevalence in very old Swedish people: the relationship to cognitive function and functional ability. Gerodontology. 2004;21(1):17–26.
67. Syrjälä A-MH, Ylöstalo P, Ruoppi P, et al. Dementia and oral health among subjects aged 75 years or older. Gerodontology. 2012;29(1):36–42.
68. Wu B, Plassman BL, Liang J, et al. Cognitive function and dental care utilization among community-dwelling older adults. Am J Public Health. 2007;97(12):2216–2221.
69. Ship JA, Puckett SA. Longitudinal study on oral health in subjects with Alzheimer's disease. J Am Geriatr Soc. 1994;42(1):57–63.
70. Sabbah W, Watt RG, Sheiham A, et al. The Role of Cognitive Ability in Socio-economic Inequalities in Oral Health. J Dent Res. 2009;88(4):351–355.
71. Grabe HJ, Schwahn C, Völzke H, et al. Tooth loss and cognitive impairment. J Clin Periodontol. 2009;36(7):550–557.
72. Stein PS, Desrosiers M, Donegan SJ, et al. Tooth loss, dementia and neuropathology in the Nun study. J Am Dent Assoc. 2007;138(10):1314–1322.
73. Stein PS, Kryscio RJ, Desrosiers M, et al. Tooth loss, apolipoprotein E, and decline in delayed word recall. J Dent Res. 2010;89(5):473–477.
74. Gatz M, Mortimer JA, Fratiglioni L, et al. Potentially modifiable risk factors for dementia in identical twins. Alzheimers Dement. 2006;2(2):110–117.
75. Kondo K, Niino M, Shido K. A case-control study of Alzheimer's disease in Japan--significance of life-styles. Dementia. 1994;5(6):314–326.
76. Rai B, Kaur J, Anand SC. Possible relationship between periodontitis and dementia in a North Indian old age population: a pilot study. Gerodontology. 2012;29(2):e200–e205.
77. Okamoto N, Morikawa M, Okamoto K, et al. Relationship of tooth loss to mild memory impairment and cognitive impairment: findings from the fujiwara-kyo study. Behav Brain Funct. 2010;6(1):1–8.
78. Starr JM, Hall RJ, Macintyre S, et al. Predictors and correlates of edentulism in the healthy old people in Edinburgh (HOPE) study. Gerodontology. 2008;25(4):199–204.
26
Impairment, and Mortality in Institutionalized Elderly People. J Dent Res. 2001;80(1):340–345. 80. Slade GD, Offenbacher S, Beck JD, et al. Acute-phase Inflammatory Response to Periodontal
Disease in the US Population. J Dent Res. 2000;79(1):49–57.
81. Watts A, Crimmins EM, Gatz M. Inflammation as a potential mediator for the association between periodontal disease and Alzheimer’s disease. Neuropsychiatr Dis Treat.
2008;4(5):865–876.
82. Slade GD, Ghezzi EM, Heiss G, et al. Relationship between periodontal disease and C-reactive protein among adults in the Atherosclerosis Risk in Communities study. Arch Intern Med.
2003;163(10):1172–1179.
83. Beck JD, Eke P, Heiss G, et al. Periodontal disease and coronary heart disease: a reappraisal of the exposure. Circulation. 2005;112(1):19–24.
84. Pejcic A, Kesic LJ, Milasin J. C-reactive protein as a systemic marker of inflammation in periodontitis. Eur J Clin Microbiol Infect Dis. 2010;30(3):407–414.
85. Noble JM, Borrell LN, Papapanou PN, et al. Periodontitis is associated with cognitive impairment among older adults: analysis of NHANES-III. J Neurol Neurosurg Psychiatry. 2009;80(11):1206–1211.
86. Mattila KJ, Pussinen PJ, Paju S. Dental infections and cardiovascular diseases: a review. J Periodontol. 2005;76(11 Suppl):2085–2088.
87. Xu F, Lu B. Prospective association of periodontal disease with cardiovascular and all-cause mortality: NHANES III follow-up study. Atherosclerosis. 2011;218(2):536–542.
88. Lockhart PB, Bolger AF, Papapanou PN, et al. Periodontal disease and atherosclerotic vascular disease: does the evidence support an independent association?: a scientific statement from the American Heart Association. 2012:2520–2544.
89. Kim J-M, Stewart R, Prince M, et al. Dental health, nutritional status and recent-onset dementia in a Korean community population. Int J Geriatr Psychiatry. 2007;22(9):850–855.
90. N'gom PI, Woda A. Influence of impaired mastication on nutrition. J Prosthet Dent. 2002;87(6):667–673.
91. Onozuka M, Watanabe K, Mirbod SM, et al. Reduced mastication stimulates impairment of spatial memory and degeneration of hippocampal neurons in aged SAMP8 mice. Brain Res.
1999;826(1):148–153.
92. Onozuka M, Watanabe K, Nagasaki S, et al. Impairment of spatial memory and changes in astroglial responsiveness following loss of molar teeth in aged SAMP8 mice. Behav Brain Res.
2000;108(2):145–155.
93. Cullen B, O'Neill B, Evans JJ, et al. A review of screening tests for cognitive impairment. J Neurol Neurosurg Psychiatry. 2007;78(8):790–799.