1
MORTGAGE INSURANCE IN THE GREAT RECESSION
Kevin Alan Park
A dissertation or thesis submitted to the faculty at the University of North Carolina at Chapel Hill in partial fulfillment of the requirements for the degree of Doctor of Philosophy in the Department of City and
Regional Planning.”
Chapel Hill 2015
ii
iii
ABSTRACT
Kevin Alan Park: Mortgage Insurance in the Great Recession (Under the direction of Roberto Quercia)
Mortgage insurance compensates lenders for losses in the event of a default by borrowers. Whether offered by private mortgage insurance companies or the Federal Housing Administration (FHA), mortgage insurance is often required for borrowers with insufficient wealth for a large downpayment to purchase a home. Consequently, mortgage insurance is particularly important for first-time homebuyers and historically underserved populations, such as racial and ethnic minorities. This doctoral dissertation evaluates and discusses mortgage insurance in the context of the housing boom and bust of the early twenty-first century. The first chapter provides an introduction to mortgage insurance in the United States.
The second chapter estimates the degree of substitution between FHA insurance, private mortgage insurance, and a subordinate lien mortgage product that became popular during the housing bubble. Both types of mortgage insurance lost market share during the housing bubble. Only after conventional (i.e., not government-insured) options became less available did FHA fill the void. More recently, FHA lending has declined but has not been replaced by conventional alternatives.
The third chapter evaluates the selection of private or FHA mortgage insurance and the decline in the availability of mortgage insurance, and therefore mortgage credit, as the housing market collapsed. Differences across racial and ethnic minorities are found in both the choice of insurance and the likelihood of denial. In addition, a decline in private insurer’s regulatory capital ratios constrained their ability to endorse new mortgages, demonstrating the importance of a public mortgage insurance program.
The fourth chapter compares the risk of default of FHA-insured loans to similar privately-insured and uninsured loans. Surprisingly, FHA-insured loans are found to perform as well or better than
uninsured loans and substantially better than privately-insured loans. Both FHA and private mortgage insurance, however, are found to suffer from adverse selection.
iv
v
ACKNOWLEDGEMENTS
I would like to thank George McCarthy and the Ford Foundation for providing funding and CoreLogic’s Academic Research Council for providing the loan performance data used in the analysis presented in Chapter 4.
I have great respect and appreciation for the esteemed members of my doctoral dissertation committee: Dr. William Rohe, Dr. Todd BenDor, Dr. Daniel Immergluck and Dr. Carolina Reid. Dr. Reid in particular provided timely and insightful comments on early drafts of my dissertation.
I also want to single out individuals and organizations that have helped shape my interest and career in the American housing finance system. Dr. William Apgar and Harvard University’s Joint Center for Housing Studies introduced me to the housing finance system just as the mortgage market entered freefall. I continued my research on housing policy under Dr. Roberto Quercia and Janneke Ratcliffe at the Center for Community Capital in the University of North Carolina at Chapel Hill. Over the years, Dr. Apgar, Dr. Quercia and Ms. Ratcliffe have offered valuable personal and professional guidance with humor and kindness.
vi
TABLE OF CONTENTS
LIST OF TABLES
... X
LIST OF FIGURES
... XII
LIST OF ABBREVIATIONS
... XIV
CHAPTER 1: INTRODUCTION TO MORTGAGE INSURANCE
... 1
MORTGAGE INSURANCE IN THE AMERICAN HOUSING FINANCE SYSTEM ... 1
MORTGAGE INSURANCE IN THE GREAT RECESSION ... 5
MODEL OF MORTGAGE UNDERWRITING ... 8
CHAPTER 2: FHA SUBSTITUTION WITH CONVENTIONAL ALTERNATIVES
...10
BACKGROUND ... 11
PUBLIC AND PRIVATE MORTGAGE INSURANCE ... 11
PIGGYBACK LENDING AND THE HOUSING BUBBLE ... 14
CONCEPTUAL FRAMEWORK ... 16
METHODOLOGY ... 17
vii
FINDINGS ... 21
DISCUSSION ... 33
CONCLUSION ... 36
CHAPTER 3: APPLICATION AND ACCESS TO MORTGAGE INSURANCE
...37
BACKGROUND ... 38
MARKET SEGMENTATION AND OVERLAP ... 39
CREDIT AVAILABILITY ... 42
CONCEPTUAL FRAMEWORK ... 47
METHODOLOGY ... 49
DATA ... 50
FINDINGS ... 61
TYPE OF INSURANCE ... 61
LIKELIHOOD OF DENIAL ... 66
NEIGHBORHOOD ANALYSIS ... 80
REASON FOR DENIAL ... 84
DISCUSSION ... 86
viii
CHAPTER 4: LOAN PERFORMANCE AND ADVERSE SELECTION
...93
BACKGROUND ... 96
ADVERSE SELECTION ... 98
CONCEPTUAL FRAMEWORK ... 101
METHODOLOGY ... 104
LOAN PERFORMANCE DATA ... 104
PROPENSITY SCORE MATCHING ... 107
COMPETING RISKS SURVIVAL MODEL ... 111
MODEL VARIABLES ... 112
FINDINGS ... 115
DISCUSSION ... 122
CONCLUSION ... 124
CHAPTER 5: MORTGAGE INSURANCE AFTER THE GREAT RECESSION
... 126
RECOGNIZING PRIVATE MORTGAGE INSURANCE AS PRIVATE CAPITAL ... 126
RECONSIDERING THE ROLE OF THE FEDERAL HOUSING ADMINISTRATION ... 130
ix
APPENDIX A. METROPOLITAN AREA SUBSTITUTION COEFFICIENTS ... 139
APPENDIX B. METROPOLITAN AREAS AND DIVISIONS SAMPLES ... 151
x
LIST OF TABLES
TABLE 2.1A HIGH LTV MORTGAGE LENDING
...22
TABLE 2.1B HIGH LTV MORTGAGE PRODUCT MARKET SHARE
...23
TABLE 2.2 FHA ENDORSEMENTS: NATIONAL FIXED EFFECTS MODEL
...28
TABLE 2.3 FHA ENDORSEMENTS: MINORITY AND LOWER INCOME HOUSEHOLDS
...29
TABLE 2.4 FHA ENDORSEMENTS: MINORITY AND LOWER INCOME NEIGHBORHOODS
...30
TABLE 2.5 METROPOLITAN ESTIMATES OF FHA SUBSTITUTION: SUMMARY
...31
TABLE 3.1A MORTGAGE INSURANCE APPLICATIONS BY YEAR AND ACTION
...53
TABLE 3.1B FHA APPLICATION MARKET SHARE BY YEAR AND REGION
...53
TABLE 3.2 DESCRIPTIVE STATISTICS
...59
TABLE 3.3 SELECTION EQUATION: FHA INSURANCE APPLICATION
...62
TABLE 3.4 OUTCOME EQUATION: FHA DENIAL
...67
TABLE 3.5 OUTCOME EQUATION: PMI DENIAL
...71
TABLE 3.6 OUTCOME EQUATION: PMI DENIAL WITH CAPITAL RATIOS
...75
TABLE 3.7 MARGINAL EFFECTS
...78
xi
TABLE 4.1 SAMPLE CHARACTERISTICS
... 105
TABLE 4.2A PRIVATE MORTGAGE INSURANCE PREMIUMS (BASIS POINTS)
... 106
TABLE 4.2B FHA MORTGAGE INSURANCE PREMIUMS (BASIS POINTS)
... 106
TABLE 4.3 MORTGAGE RATE SPREADS ADJUSTED FOR INSURANCE PREMIUMS
... 114
TABLE 4.4 DEFAULT SUBHAZARD
... 116
TABLE 4.5 PREPAYMENT SUBHAZARD
... 120
xii
LIST OF FIGURES
FIGURE 1.1 MORTGAGE INSURANCE MARKET SHARE AND HOUSE PRICE-RENT INDEX
... 6
FIGURE 1.2 MODEL OF MORTGAGE UNDERWRITING
... 9
FIGURE 2.1 UNDERWRITING STANDARDS AND LOAN VOLUME
...17
FIGURE 2.2 LOW DOWNPAYMENT MORTGAGE PRODUCTS
...24
FIGURE 2.3A MARKET SHARE BY METROPOLITAN AREA, 2005
...25
FIGURE 2.3B MARKET SHARE BY METROPOLITAN AREA, 2009
...26
FIGURE 2.4 METROPOLITAN AREA ESTIMATES DISTRIBUTION
...31
FIGURE 2.5 METROPOLITAN ESTIMATES OF FHA SUBSTITUTION
...32
FIGURE 2.6 COMPONENTS OF CHANGE IN FHA LENDING
...33
FIGURE 3.1 LTV RATIO AND CREDIT SCORE ON LOANS WITH INSURANCE
...40
FIGURE 3.2 REGULATORY CAPITAL RATIOS
...45
FIGURE 3.3 CREDIT RISK DISTRIBUTION OF APPLICATIONS
...48
FIGURE 3.4 METROPOLITAN AREA TYPES
...57
FIGURE 3.5 STANDARD DISTRIBUTION, PROBABILITIES AND Z-SCORES
...61
xiii
FIGURE 3.6B NEIGHBORHOOD FIXED EFFECTS ANALYSIS: FHA DENIAL
...82
FIGURE 3.6C NEIGHBORHOOD FIXED EFFECTS ANALYSIS: PMI DENIAL
...83
FIGURE 4.1A SERIOUS DELINQUENCY RATE BY MORTGAGE INSURER
...94
FIGURE 4.1B FHA CUMULATIVE CLAIMS RATE BY BOOK OF BUSINESS
...96
FIGURE 4.2 CREDIT RISK AND MARKET SEGMENTATION
... 103
FIGURE 4.3 PROPENSITY SCORE MATCHING COMMON SUPPORT
... 110
FIGURE 4.4 PROPENSITY SCORE MATCHING AND SURVIVAL ESTIMATE
... 111
FIGURE 4.5 DEFAULT SUBHAZARD BY CREDIT SCORE AND MTMLTV RATIO
... 117
FIGURE 4.6 DEFAULT SUBHAZARD BY MORTGAGE INSURANCE TYPE
... 119
FIGURE 4.7 PREPAYMENT SUBHAZARD BY MORTGAGE INSURANCE TYPE
... 119
FIGURE 5.1 COST ACCOUNTING AND RISK PRICING
... 134
xiv
LIST OF ABBREVIATIONS
CBSA
CORE BASED STATISTICAL AREA
CES
CLOSED-END SUBORDINATE LIEN
CFPB
CONSUMER FINANCIAL PROTECTION BUREAU
DTI
DEBT-TO-INCOME
FFIEC
FEDERAL FINANCIAL INSTITUTIONS EXAMINATION COUNCIL
FHA
FEDERAL HOUSING ADMINISTRATION
FHFA
FEDERAL HOUSING FINANCE AGENCY
GAO
GOVERNMENT ACCOUNTABILITY OFFICE
GSE
GOVERNMENT-SPONSORED ENTERPRISE
HELOC
HOME EQUITY LINE OF CREDIT
HMDA
HOME MORTGAGE DISCLOSURE ACT
HUD
U.S. DEPARTMENT OF HOUSING AND URBAN DEVELOPMENT
LTV
LOAN-TO-VALUE
MTMLTV
MARK-TO-MARKET LOAN-TO-VALUE
1
CHAPTER 1: INTRODUCTION TO MORTGAGE INSURANCE
Mortgage insurance is a contract in which lenders or investors are compensated for losses in the event of a default by the borrower. In the American home mortgage market, there are two main types of mortgage insurance: private mortgage insurance offered by monoline insurance companies and mortgage insurance offered by the federal government through the Federal Housing Administration (FHA), an agency within the US Department of Housing and Urban Development (HUD) . FHA was created to stimulate the housing market in the Great Depression. In the process, FHA developed the popular long-term, fixed-rate, prepayable self-amortizing home loan and helped make homeownership an integral— and achievable—part of the American Dream.
The following chapters assess both public and private mortgage insurance in the context of another severe housing market collapse—the Great Recession of the 21st century. The second chapter estimates whether FHA mortgage insurance is a complement or substitute to conventional low
downpayment alternatives, specifically private mortgage insurance and subordinate or “piggyback” mortgages used as the source of a downpayment to avoid mortgage insurance altogether. The third chapter evaluates the choice in the type of mortgage insurance and if mortgage insurance—and, by extension, mortgage credit—became less available during the housing downturn, with a particular focus on the effect of minimum capital requirements on private financial institutions. The fourth chapter examines the likelihood of default of comparable FHA-insured, privately-insured and uninsured home loans and the possibility of adverse selection in mortgage insurance programs. A conclusion summarizes the findings of these chapters and discusses their implications for the future of the American housing finance system. The remainder of this introduction provides background on mortgage insurance common to all three chapters and the motivation for the research.
Mortgage Insurance in the American Housing Finance System
2
the economic calamity known as the Great Depression. Although the stock market crash of 1929 is well known causa proxima for the Great Depression, other factors, including the housing market, contributed to make the economy vulnerable to disaster.
Until the 1930s, home mortgages in the United States were typically short term (5 to 10 years), interest-only loans that required substantial downpayments of 50 percent or more (Green and Wachter 2005). Short loan terms required a loan to be refinanced frequently, which could be a problem if house prices declined, raising the loan-to-value (LTV) ratio, or financial institutions became illiquid and unwilling to roll over the loan. A private mortgage insurance market had grown out of the title insurance industry in the late 19th century, but was untested. A study of urban housing finance at the time noted:
From the standpoint of the surety companies, the guaranteeing of mortgages or mortgage bonds is an experiment. To date losses have been negligible, but we have passed through no serious crises calculated to put the guarantee to the test. Rightly or wrongly, these companies take an attitude of watchful waiting which does not indicate any rapid increase in the near future of their contingent liability on this account. (Gray and Terborgh 1929)
In fact, nominal house prices had peaked in 1925. Foreclosures began to climb for the next eight years. A thousand homes were foreclosed on every day in 1933 and one survey found nearly 44 percent of urban, owner-occupied homes with a mortgage were in default at the start of 1934 (Wheelock 2008). The nascent private mortgage insurance industry proved unable to weather the extreme losses (Alger 1934; Graaskamp 1967).
In response to the turmoil in the housing and mortgage markets, Title II of the National Housing Act of 1934 created a “system of mutual mortgage insurance” administered by the Federal Housing Administration backed by the full faith and credit of the United States government. By assuming the risk of default, FHA encouraged banks and other financial institutions to lend, creating new demand for housing. FHA-insured loans could be for up to 80 percent of the house value and were required to have “complete amortization provisions,” meaning regular loan payments included both principal and interest such that the loan would be completely repaid by the end of the loan term.
3
percent or less in 1961. Loan terms initially set at 20 years were gradually increased to 30 years or more by 1954, spreading the loan principal over more payments and thereby reducing monthly costs (Vandell 1995). FHA, along with mortgage insurance provided by the Veterans Administration, helped the homeownership rate increase from 43.6 percent in 1940 to 61.9 percent in 1960.
Unfortunately, access and opportunity was not open to all. Early FHA underwriting manuals warned of the “ingress undesirable racial or nationality groups” and systematically favored financing suburban developments rather than houses in urban, minority areas (Stearns n.d.). Executive Order 11063, signed by President John F. Kennedy in 1962, prohibited discrimination in federally-funded housing programs. Nevertheless, the lack of equal access to FHA insurance in the prosperous post-war period is considered a crucial factor that contributed to a lack of wealth-building among minority
households (Coates 2014).
The private mortgage industry was reborn in the mid-20th century, beginning with the creation of the Mortgage Guaranty Insurance Corporation in 1957. Private insurance grew quickly thanks in part to the privatization of the Federal National Mortgage Association (“Fannie Mae”) in 1968. The charters of the re-purposed government-sponsored enterprise and its eventual twin, the Federal Home Loan Mortgage Corporation (“Freddie Mac”), allowed them to purchase conventional (i.e., not government-insured) home mortgages with a specific restriction:
4
In practice, private mortgage insurance became the most common form of credit enhancement for conventional mortgages with high LTV ratios and vital to gaining access to the secondary market liquidity provided by the government-sponsored enterprises.
Private mortgage insurers and the conventional mortgage market typically adjust insurance prices based on borrower risk characteristics. By contrast, FHA uses very little risk-based pricing. For the first nearly fifty years, FHA insurance was paid by borrowers through monthly premiums equivalent to an annual payment of 0.5 percent of the original loan amount, as mandated by the National Housing Act of 1934. The annual premium was replaced in 1983 with a 3.8 percent up-front premium, which could be financed in the loan amount. Since 1990, FHA has relied on both up-front and annual premiums. Among long-term (greater than 15 years) mortgage, the only variation in current FHA premiums is whether the base loan amount is above or below $625,500 and whether the LTV ratio is above or below 95 percent, although borrowers with low credit scores may not be eligible for insurance on mortgages with high LTV ratios. In fact, the Housing and Economic Recovery Act of 2008 specifically prohibited FHA for one year from taking “any action to implement or carry out risk-based premiums, which are designed for mortgage lenders to offer borrowers an FHA-insured product that provides a range of mortgage insurance premium pricing, based on the risk that the insurance contract represent.” FHA has continued that moratorium on risk-based premium pricing.
FHA is also prohibited by law from insuring large loan amounts. Initially, FHA’s loan limits were set high enough to cover more than 85 percent of owner-occupied homes (Vandell 1995). But failure to adjust these limits for inflation gradually confined FHA to a narrower segment of the market. More recently, loan limits were typically set a 95 percent of the area median house price, but not less than 48 percent of Freddie Mac’s conforming loan limit, although these limits were temporarily raised by the Housing and Economic Recovery Act of 2008.
5
which minorities and other underserved borrowers are unnecessarily shut out of the lower-priced conventional mortgage market (Bradford 1990).
Nevertheless, FHA appeared to be a vestigial part of the American housing finance system towards the end of 20th century. As the government-sponsored enterprises reigned supreme after the Savings and Loan Crisis demonstrated the benefits of mortgage-backed securitization, private mortgage insurance and the conventional market in general had confined FHA into a small niche of borrowers. However, the American housing and mortgage markets in the new millennium were about to be roiled to a degree not seen since the Great Depression.
Mortgage Insurance in the Great Recession
6
Figure 1.1 Mortgage Insurance Market Share and House Price-Rent Index
Note: Four-quarter moving average of market share. The Price-Rent Index is defined as the National Home Price Index deflated by Owners’ Equivalent Rent of Residences in the Consumer Price Index and indexed to the long-run average.
Source: Inside Mortgage Finance; S&P/Case-Shiller National Home Price Index; Bureau of Labor Statistics However, the availability of alternative loan products collapsed as housing prices fell. Private mortgage insurance initially filled the void, spiking to 16 percent of new loan origination volume in 2008. But private financial institutions in general and the private mortgage insurance industry in particular were not able to sustain a housing market in freefall. Only when the conventional mortgage market imploded did FHA see its share rise to nearly a quarter of new loan volume. The increase in FHA’s market share was aided by extraordinary increases in its loan limits, but the majority of the increase in endorsements remained among smaller loan amounts.
At the peak of the housing bubble, FHA’s serious delinquency rate was roughly seven percent, comparable to conventional subprime loans and above that reported by most private mortgage insurance companies. But as the housing market collapsed, the serious delinquency rates on most conventional loans began to rise. While FHA’s serious delinquency rate rose to approximately 12 percent, privately-insured loans had delinquency rates between 13 and 21 percent. For comparison, the serious
delinquency rate of subprime loans peaked at 35 percent.
60 80 100 120 140 160 0 5 10 15 20 25 1 9 8 7 Q 1 1 9 8 8 Q 1 1 9 8 9 Q 1 1 9 9 0 Q 1 19 91 Q 1 1 9 9 2 Q 1 1 9 9 3 Q 1 1 9 9 4 Q 1 1 9 9 5 Q 1 19 96 Q 1 1 9 9 7 Q 1 1 9 9 8 Q 1 1 9 9 9 Q 1 2 0 0 0 Q 1 20 01 Q 1 2 0 0 2 Q 1 2 0 0 3 Q 1 2 0 0 4 Q 1 2 0 0 5 Q 1 2 0 0 6 Q 1 2 0 0 7 Q 1 2 0 0 8 Q 1 2 0 0 9 Q 1 2 0 1 0 Q 1 2 0 1 1 Q 1 2 0 1 2 Q 1 2 0 1 3 Q 1 2 0 1 4 Q 1 2 0 1 5 Q 1 Pri c e -Ren t In d e x M a rk e t Sh a re (Pe rc e n t)
7
However, simple comparisons between serious delinquency rates may be misleading. The definition of seriously delinquency varies between mortgage insurance companies. Moreover, the flow rate involves combining books of business of different loan maturities. In particular, the increase in FHA loan volume after 2009 swelled the denominator used to calculate the serious delinquency rate and may therefore understate the increase in FHA default rates. On the other hand, FHA-insured borrowers are typically higher risk than those served by the private mortgage insurance industry; therefore, we might expect FHA generally to have a higher delinquency rate. The analysis of loan performance in the fourth chapter attempts to control for all these issues for an apples-to-apples comparison of default rates. Mortgage defaults lead to mortgage insurance claims, which deplete the capital resources of mortgage insurers. State regulators typically require private mortgage insurance companies to maintain a 25:1 risk-to-capital ratio, equivalent to a four percent minimum capital ratio. Insurers that fall below minimum capital requirements may be forced into run-off, where revenue on existing policies continues to be collected and claims paid but companies are prohibited from endorsing new loans. As in the Great Depression, losses suffered in the Great Recession wreaked havoc on private mortgage insurers’ balance sheets. Three private mortgage insurance companies (Triad Guaranty Insurance Corporation, Republic Mortgage Insurance Co., and PMI Mortgage Insurance Co.) failed. Other insurers were allowed regulatory forbearance to continue operating. The relationship between capital reserves and the ability of private mortgage insurance to sustain the mortgage market in a downturn is examined in the third chapter.
FHA also has a minimum capital requirement, but its two percent capital ratio standard is not comparable to the four percent required of private insurers because of differences in insurance coverage. Private mortgage insurance typically only covers 12 to 35 percent of the loan amount, depending on the LTV ratio at origination, but FHA insures the full loan amount; consequently, FHA is often able to recoup losses through foreclosure where private mortgage insurance coverage would be exhausted.
Nevertheless, FHA not only fell below its two percent capital ratio requirement, but turned negative. At the end of fiscal year 2012, losses on forward loans in the Mutual Mortgage Insurance Fund, which finances FHA’s mortgage insurance program, were expected to exceed future revenue and existing capital
8
its history. In September 2013, $1.7 billion was transferred from the U.S. Treasury to the Mutual Mortgage Insurance Fund.
In order to curb defaults and replenish capital reserves, mortgage insurers tightened underwriting standards and raised insurance premiums. For example, FHA adopted a minimum credit score
requirement and restricted maximum LTV ratios for other low credit scores. After years of unsuccessful attempts to curb controversial seller-funded downpayment assistance programs associated with appraisal fraud and high default rates, the practice was finally banned by the Housing and Economic Recovery Act. Congressional action (Public Law 111-229) was also needed to amend the National Housing Act so that premiums could be raised. Overall, upfront and annual premiums for mortgages with high LTV ratios and terms exceeding 15 years increased from 1.5 and 0.5 percent, respectively, to 1.75 and 1.35 percent over the course of the housing downturn. However, higher prices and more restrictive underwriting for
mortgage insurance reduces the availability of mortgage credit and therefore also housing demand, exacerbating the downturn in the housing market. FHA faces a dilemma between fulfilling its public purpose of sustaining the mortgage market in periods of distress while maintaining the fiscal solvency of the Mutual Mortgage Insurance Fund and, by extension, reducing the risk to taxpayers.
The turmoil in the mortgage market over the last housing cycle and the criticism of FHA’s mortgage insurance program in particular provides a unique opportunity to examine the role of mortgage insurance in the American housing finance system, from application for mortgage insurance to the performance of insured loans.
Model of Mortgage Underwriting
9
the maximum acceptable risk are rejected by the mortgage lender or insurers. Meanwhile, the average risk of loan originations is the weighted integral of all borrowers under the maximum acceptable risk. In this model, the mortgage market can be segmented by assuming either A) FHA has more lenient underwriting standards than conventional lenders and insurers, an approach introduced by Ambrose, Pennington-Cross and Yezer (2002) and adopted in the second chapter, B) applicants for FHA insurance tend to be higher risk than applicants for conventional credit, an assumption used in the third chapter, or C) some combination of both, used in the fourth chapter.
In summary, this dissertation project builds on the existing literature in economic theory and empirical methodology to derive policy implications that would make the mortgage insurance market work better for more people. The policy implications are presented in the conclusion section.
Figure 1.2 Model of Mortgage Underwriting
Fre
q
u
e
n
c
y
f(
Ω
)
Credit Risk Ω
Ω*
FHA
10
CHAPTER 2: FHA SUBSTITUTION WITH CONVENTIONAL ALTERNATIVES
In testimony before the House Financial Services Committee in 2013, Federal Housing Administration Commissioner Carol Galante stated, “By design, FHA’s programs are meant to
complement, not supplant, private capital. They are there to address a lack of available mortgage credit when private capital retreats or underserves markets, and to step back when private capital returns or expands to serve previously underserved populations.” The last decade of mortgage lending
demonstrates the countercyclical role of FHA. Between 2007 and 2009, the unemployment rate nearly doubled while house prices fell 20 percent. The availability of conventional low downpayment mortgage products, such as private mortgage insurance or so-called “piggyback” loans—subordinate liens used to finance the downpayment on a home purchase—collapsed. Meanwhile, the number of FHA
endorsements nearly quadrupled. This paper evaluates the determinants of FHA endorsement volume, with particular emphasis on the substitution of low downpayment mortgage products.
11
In addition, federal support for the Mutual Mortgage Insurance Fund, which finances FHA’s mortgage insurance program, also presents risks to taxpayers.1 The Fund lost nearly $38 billion in economic value between FY2007 and FY2012. In fact, the economic value of the Fund turned negative as the projected cost of future claims overwhelmed projected revenue and existing capital resources. Under the rules of the Federal Credit Reform Act of 2000, FHA was required to draw $1.7 billion from the U.S. Treasury in September 2013 to cover credit related losses for the first time in its history.
Background
In the first several decades after its creation, FHA served a broad segment of the mortgage market. But over time, its mortgage insurance program has faced increased competition from conventional low downpayment products, including private mortgage insurance and, more recently, “piggyback” loans. These alternatives have contributed to a reduction in FHA’s market to a niche of underserved, higher risk borrowers and neighborhoods experiencing severe economic hardship.
Public and Private Mortgage Insurance
The National Housing Act of 1934 established FHA to provide federal insurance of mortgages. Section 202 of the Act created the Mutual Mortgage Insurance Fund to collect premiums and disburse claims for insurance on eligible loans defined in Section 203(b). Implementation of the insurance program entailed standardization of loan products and underwriting requirements. In order to protect taxpayers’ money, FHA created property inspection and appraisal standards (infamously including redlining and other practices that favored suburban, White neighborhoods over inner-city, minority ones). Loans were fully self-amortizing, meaning monthly mortgage payments included principal and interest such that the loan was fully repaid by the end of the term. After proving the viability of the mortgage insurance program, the term to maturity of loans was extended to up to 30 years in 1954, reducing required monthly
payments. Maximum loan-to-value (LTV) ratios were initially set at 80 percent, resulting in substantially lower down payments than previously possible. They gradually increased up to 98.75 percent in order to
12
further expand homeownership.2 Loan limits were imposed, but could finance more than 85 percent of homes (Vandell 1995).
Although a private mortgage insurance (PMI) industry existed as early as the 1880s, it was not able to withstand the depths of the Great Depression and disappeared for over twenty years (Alger 1934; Graaskamp 1967). However, the success of FHA demonstrated the viability of mortgage insurance when properly managed. The private mortgage insurance industry was reborn when the Mortgage Guaranty Insurance Corporation was created in Wisconsin in 1957. Every state had passed legislation allowing for private mortgage insurance by 1973 (Herzog 2009; FHFA 2009). The role of PMI has been
institutionalized in the American housing finance system by regulations that prevent the government-sponsored enterprises, Fannie Mae and Freddie Mac, from purchasing mortgages with unpaid balances over 80 percent of the value of the property securing the loan, unless “guaranteed or insured by a qualified insurer as determined by the corporation.”
FHA and private mortgage insurance appear to segment the mortgage market by credit risk. More lenient underwriting standards create an “FHA wedge” in the mortgage market between borrowers served by the conventional market and borrowers deemed unacceptable credit risks, based on either the
borrower’s ability to repay or the value of the collateral (Ambrose, Pennington-Cross and Yezer 2002). Under this conception, there is very little room for product substitution because borrowers will always select the least expensive option available at any given point in time. Bunce et al. (1995) argue,
“[O]verlap is only possible when the lender and borrower fail to take advantage of a bonafide PMI offer of the same service at lower cost.” And given the complexity of the underwriting process, even observed incidences are only evidence of potential, not actual, overlap.
Although the delineation between FHA and conventional markets is not always sharp, higher credit risk increases the likelihood that a borrower will be forced to use FHA or else be denied credit. Pennington-Cross and Nichols (2000) find that a 10-point increase in credit score lowers the probability of using FHA insurance by 2.8 percent. Decomposing credit scores into specific components of credit
13
history such as revolving credit balance, ever delinquent, derogatory public notices provides even more explanatory power. Lacour-Little (2004) supports the finding that credit score predominantly distinguishes FHA and subprime mortgages from conventional prime mortgages, but also notes that documentation requirements appear to separate subprime and FHA loans. Immergluck (2011) also finds that low- or no-documentation of income and assets reduces the likelihood of FHA insurance.
Yet even after controlling for these elements of credit risk, the race and ethnicity of borrowers is a significant factor in the choice of mortgage financing. Early empirical studies (e.g., Fullerton and MacRae 1978; Canner, Gabriel and Woolley 1991; Gabriel and Rosenthal 1991; Holmes and Horvitz 1994) typically found minorities were disproportionately more likely to rely on FHA insurance than conventional mortgages. However, later studies find different patterns, possibly reflecting changes in the mortgage industry such as the introduction of greater risk-based pricing in the form of subprime loans. Pennington-Cross and Nichols (2000) find that Hispanics are more likely to use FHA insurance but Blacks are less likely. Karikari, Voicu and Fang (2011) find minority borrowers and neighborhoods were more likely to receive subprime mortgages than FHA-insured loans.
While highlighting the differences between FHA and conventional mortgages, these studies also reveal that the market is not nearly as segmented as theory would suggest. One US Department of Housing and Urban Development study from 1986 noted, “It appears, therefore, that Section 203(b) and private insurers are less different…than may be commonly believed.” Ambrose, Pennington-Cross and Yezer (2002) attribute the overlap to applicants’ tolerance for rejection. For example, risk averse applicants might apply for FHA insurance even when they would qualify for typically less expensive conventional mortgage credit alternatives.
14
estimate that 29 percent of subprime loans made in 2005 could have qualified for FHA insurance. Results presented in Spader and Quercia (2012) indicate that every ten subprime loans in a Census tract
between 2002 and 2006 was associated with roughly three fewer FHA-insured loans, although the opposite effect is observed between 1998 and 2001. There is also evidence that the market share of FHA was negatively impacted by other public policies, including affordable housing goals for the government-sponsored enterprises (An and Bostic 2008) and the Community Reinvestment Act (Spader and Quercia 2012). On the other hand, Ding et al. (2008) find FHA and subprime loans are complements at the neighborhood level, with the share of FHA loans in a census tract positively correlated with the share of subprime loans.
Piggyback Lending and the Housing Bubble
In the housing bubble of the mid-2000s, alternative forms of low downpayment lending became available without requiring any mortgage insurance. Simultaneous origination of a second3 lien or
“piggyback” loan enabled borrowers to avoid mortgage insurance altogether. For example, a so-called 80-10-10 arrangement combines a first mortgage with an 80 percent LTV ratio and either a closed-end second (CES) or home equity line of credit (HELOC), amounting to another 10 percent of the sales price. The borrower’s downpayment is thereby cut in half, from 20 percent to 10 percent. An 80-20 structure uses a junior lien for 20 percent of the sales price, effectively eliminating the need for a downpayment.
Until 2007, subordinate liens benefited from preferential tax treatment relative to mortgage insurance. Like other forms of secured home acquisition debt, interest payments on piggyback loans are tax deductible. Mortgage insurance premiums were not similarly treated until Section 419 of the Tax Relief and Health Care Act of 2006 temporarily expanded the deduction for new originations. Subsequent legislation has extended the provision (e.g., Mortgage Forgiveness Debt Relief Act of 2007; Tax Relief, Unemployment Insurance Reauthorization, and Job Creation Act of 2010; American Taxpayer Relief Act of 2012). However, mortgage insurance premiums are fully deductible only for households with adjusted gross incomes of less than $100,000 ($50,000 if married and filing separately) and completely phased out for incomes over $109,000. According to the Joint Committee on Taxation, only 24 percent of taxable returns with income less than $100,000 claimed the mortgage interest tax deduction in 2012, compared to
15
65 percent of returns with income over that amount. And lower income households that do take advantage of the tax deduction receive a disproportionately smaller benefit. Filing units with income under $100,000 accounted for 45 percent of returns claiming the deduction, but only 23 percent of the total amount of the tax expenditure. Consequently, higher-income households may still have an incentive to prefer second liens over mortgage insurance.
On the other hand, piggyback loans expose the borrower to greater interest rate risk if the subordinate loan has an adjustable rate compared to mortgage insurance that is fixed at a predetermined premium. In addition, loan servicers are required under the Homeowner Protection Act of 1998 to
automatically terminate private mortgage insurance on loans once the balance of the mortgage reaches 78 percent of the original value of the secured property—typically less than twelve years for a 30-year fully-amortizing mortgage. The Federal Housing Administration followed suit with a similar cancellation policy in 2001 (see Mortgagee Letters 2000-38 and 2000-46), but rescinded it in mid-2013 (Mortgagee Letter 2013-04).4 The length of time over which payments on a subordinate lien must be made, however, is fixed by the amortization schedule. Consequently, mortgage insurance may be preferred in periods of house price depreciation because normal amortization will reduce the loan balance below the 78 percent threshold while subordinate liens may not be able to be refinanced at mark-to-market LTV ratios
Nevertheless, the growth in piggyback loans during the housing bubble was dramatic. Goodman et al.’s (2010) analysis of CoreLogic data finds over half of first liens in private label securitizations between 2000 and 2007 had some kind of subordinate lien behind them, including nearly a quarter with a simultaneously originated junior lien. There were also noticeable geographic differences in the prevalence of piggyback loans. Calhoun (2005) finds rates of piggyback mortgages strongly correlates with an ex ante index of the risk of a decline in housing prices in the next two years, particularly for metropolitan areas in California. Belsky and Richardson (2010) note substantial regional variation in the use of piggyback loans, as well as disparities by the race and ethnic composition of the community, but not neighborhood income. These disparities were most pronounced in the most expensive metropolitan areas.
16
Avery et al. (2008) use HMDA data and a matching process to pair conventional closed-end subordinate liens with their respective first liens when made by the same lender. Assuming that piggyback loans were used as a substitute for mortgage insurance when the first lien loan was not subprime and the combined loan amount was less than the conforming loan limit, Avery et al. estimate that nearly 1.5 million borrowers used piggyback loans to avoid mortgage insurance between 2004 and 2007, accounting for nearly half (48.7%) of all subordinate home purchase mortgage originations.
Belsky and Richardson (2010) estimate that the odds of using a piggyback CES in 2005 were 50 percent greater when the first mortgage was subprime and 85 percent higher if the first mortgage was sold through private securitization. Black and Hispanic borrowers were also more likely to get a piggyback loan, although low income borrowers were less likely. Lee, Mayer and Tracy (2012) note important differences between types of subordinate mortgages. About 75 to 85 percent of Home Equity Lines of Credit (HELOCs) went to borrowers with credit scores over 700 and were often originated well after the first lien or to borrowers without other mortgages. CES loans, on the other hand, were more often simultaneous originations with non-prime first liens.
Conceptual Framework
In the theoretical framework used by Ferguson and Peters (1995) and Ambrose, Pennington-Cross and Yezer (2002), the credit risk of mortgage applicants is represented as a single variable, Ω ϵ [0, 1], with a probability density function 𝑓(Ω) (Figure 2.1). FHA’s less stringent underwriting standards can be represented as a maximum acceptable credit risk, ΩFHA, greater than that of conventional mortgage lenders or private mortgage insurers, ΩConv.
17
Figure 2.1 Underwriting Standards and Loan Volume
More importantly, changes in ΩFHA do not affect the cumulative distribution of conventional loan originations, but a change in ΩConv does affect the cumulative distribution of FHA endorsements. That is, variation in private mortgage insurance and piggyback lending is exogenous to the volume of FHA insurance. This may explain why Holmes and Horvitz (1994) find that the neighborhood default rate is negatively associated with conventional mortgage lending activity but positively associated with FHA activity. Immergluck (2011) also notes that falling house prices are associated with an increase in the likelihood of FHA insurance. The decrease in the maximum acceptable risk of private mortgage insurers and conventional subordinate home purchase mortgage lenders should lead to an increase in FHA endorsements, but a tightening of FHA underwriting standards may not lead to an increase in conventional mortgage volume.
Methodology
Following Spader and Quercia (2012), this paper uses a fixed effects model with census tracts as the unit of analysis to evaluate the determinants of FHA lending, including the degree of substitution with conventional low downpayment alternatives.
This model can be represented as
𝐹𝐻𝐴𝑖𝑡= 𝛼𝑖+ 𝑋𝑖𝑡𝛽 + 𝑃𝑀𝐼𝑖𝑡𝛿𝑃𝑀𝐼+ 𝐶𝐸𝑆𝑖𝑡𝛿𝐶𝐸𝑆+ 𝛾𝑡+ 𝜀𝑖𝑡
where
FHA is the number of endorsements by the Federal Housing Administration in a given census tract i at time t
Fre
q
u
e
n
c
y
f(
Ω
)
Credit Risk Ω
ΩFHA ΩConv
FHA
18
α represents neighborhood fixed effects (i.e., census tracts)
X represents time-varying neighborhood characteristics
PMI is the number of endorsements by private mortgage insurance companies
CES is the number of conventional closed-end subordinate lien home purchase loan originations
γ represents year of origination, and
ε is a tract- and time-specific error term
Neighborhood characteristics that vary by year include six variables. The number of mortgage applications in the census tract from 1) low- and moderate-income households, and 2) minority
households capture the demand for low downpayment mortgage loan products. Economic conditions are accounted for by 3) the denial rate on conventional mortgage applications by county, 4) the
unemployment rate by county and 5) annual change in employment by county , as well as 6) the annual (fourth quarter-to-fourth quarter) change in house prices in the metropolitan statistical area.
The census tract fixed effects absorb both observed and unobserved neighborhood
characteristics that are time-invariant. Similarly, dummy variables representing the year of origination account for differences in the economic climate not captured by time-varying characteristics. Errors are clustered at the metropolitan area level.
The coefficients of interest are represented by δ and measure the degree of substitution between FHA endorsements and either private mortgage insurance or piggyback mortgages. In order to explore differences in the degree of product substitution among underserved populations, the analysis is repeated using four subsets of the national data, including 1) minority households, 2) low- and moderate-income households, 3) majority-minority neighborhoods, and 4) low- and moderate-income neighborhoods.5 In addition, regional variation in substitution effects is explored by evaluating the distribution of coefficients across models estimated separately for each metropolitan area.
Notably, the dependent variable, FHAit, is not the market share of the Federal Housing Administration but rather the absolute volume of loan endorsements. The market share would
19
tautologically rise or fall with a decrease or increase, respectively, in the market share of alternative loan products. Meanwhile, the absolute volume of loan endorsements could also rise (product complement), fall (product substitute) or be unaffected by the other products.
Data
Detailed information on home mortgage loan originations is available through the Home Mortgage Disclosure Act (HMDA), which was enacted in 1975 to “provide the citizens and public officials of the United States with sufficient information to enable them to determine whether depository institutions are filling their obligations to serve the housing needs of the communities and neighborhoods in which they are located” (12 U.S.C. § 2801 (2010)). Since the Financial Institutions Reform, Recovery and
Enforcement Act of 1989, most mortgage lending institutions have been required to submit an application-level register to the Federal Financial Institutions Examination Council (FFIEC), which compiles the data for public use.
Information in the loan-application register (LAR) includes loan type, meaning whether the loan is conventional or insured by some government agency such as FHA. Although reporting is not required of smaller lenders, the HMDA data is estimated to cover 90 to 95 percent of all FHA lending (HUD 2011). Reforms to HMDA reporting requirements in 2004 included lien status, allowing identification of CES loans. Unfortunately, HELOCs are not required to be reported, resulting in an underestimate of total piggyback loans. As noted, Lee, Mayer and Tracy (2012) find that borrowers with lower credit scores are more likely to receive CES liens instead of HELOCs.
20
At the request of the Mortgage Insurance Companies of America, FFIEC also began to process information from mortgage insurance companies in 1993, leading to the creation of a similar database of private mortgage insurance activity (see Canner et al. 1994). Given the relative concentration in the mortgage insurance industry relative to general mortgage lending, reporting coverage is presumed to be as good as or better than HMDA.
The LAR also includes information on the race/ethnicity and income of the applicant. This study identifies minority households as any applicant whose race and ethnicity are other than non-Hispanic and White.6 Low- and moderate-income households are identified as applicants with reported income less than 80 percent of area median income, defined as the median family income in the metropolitan
statistical area. Area median income is obtained from the 2005-2009 American Community Survey, along with the median family income and racial/ethnic composition of the census tract. Low- and moderate-income neighborhoods are similarly identified as census tracts with median family moderate-income less than 80 percent of area median income. Majority-minority neighborhoods are identified as census tracts where non-Hispanic White households account for less than 50 percent of all households in the tract.
Finally, the LAR lists the loan amount and purpose as well as the occupancy and type of the property securing the mortgage. This analysis will focus on endorsements of first lien (unless CES) mortgages for purchase of owner-occupied, site-built, one-to-four unit properties in metropolitan areas between 2004 and 2011. Metropolitan statistical areas are fixed at their 2004 definitions. Similarly, applications are restricted to loan amounts less than the 2004 FHA loan limit, adjusted for inflation, for single-family units in a given county.7 This is meant to isolate the determinants of FHA lending from the effect of the large increase in FHA loan limits during this period. Because piggyback loans would typically cover less than one-fifth of the purchase price, CES originations are restricted to loan amounts less than roughly 21 percent of the FHA loan limits.8
6 Lenders are allowed to list up to five races for every borrower and co-borrower. This study relies on the ethnicity and race listed in the first field of the primary borrower.
7 Inflated is measured using the Bureau of Labor Statistics’s Consumer Price Index – All Urban Consumers.
21
The application- and loan-level data in HMDA is aggregated to tracts from the 2000 census, which serve as the unit of analysis. This study focuses on the period between 2004 and 2011 because changes to HMDA reporting requirements make comparisons to periods before 2004 difficult, while the shift in reporting to the 2010 tracts would make some neighborhood geographies inconsistent after 2011. Log transformation of the tract-level loan counts was considered, but not used because the number of neighborhoods with no endorsements or originations of at least one of the low downpayment options in a given year would substantially diminish the sample size and create an issue with missing data. Model errors violate the assumption of normality with or without log transformations of the different low
downpayment loan products. However, significant tests in linear regression have been found to be valid in large samples even in non-normal distributions (Lumley et al. 2002).
As noted, the research design also includes time-varying factors. Because HMDA does not include information on household wealth and assets, the demand for low downpayment mortgages is approximated by the number of first lien home purchase mortgage applications in a census tract across all loans, conventional and government-insured, from two typically wealth-constrained populations: low- and moderate-income households and minority households. HMDA also does not provide information on credit scores; therefore, the perceived risk of a neighborhood is gauged by the share of conventional-only first lien home purchase mortgage applications reported by HMDA in a county that are denied by the lender. However, the denial rate is a function of both the credit quality of the applicant pool and the risk tolerance of mortgage lenders in the neighborhood, compromising its usefulness as a control variable. In addition, control variables defined at the county or metropolitan area level may not accurately describe conditions in the neighborhoods where FHA lending is most prevalent if these neighborhoods are systematically different than the surrounding region.
Findings
22
Table 2.1A High LTV Mortgage Lending Thousands
2004 2005 2006 2007 2008 2009 2010 2011 All Borrowers and Neighborhoods
Total 2,523.7 2,585.1 2,223.3 1,731.8 1,443.6 1,492.9 1,330.8 1,264.3 FHA 311.3 231.3 194.5 189.7 527.5 739.0 653.4 550.3 PMI 448.8 379.9 364.6 571.0 319.5 107.8 75.0 101.9 CES 412.3 625.2 595.1 266.1 53.1 26.3 26.3 27.6 Subtotal 1,172.4 1,236.4 1,154.2 1,026.8 900.0 873.1 754.7 679.8 Minority Borrowers
Total 943.8 943.0 813.7 571.0 457.6 478.2 438.2 400.2 FHA 130.0 83.1 67.4 70.9 194.4 270.0 252.7 212.9 PMI 275.3 178.5 145.0 233.0 130.4 33.1 18.8 24.3 CES 185.3 276.7 249.3 92.0 17.9 7.6 8.4 10.3 Subtotal 590.7 538.3 461.7 395.9 342.7 310.6 280.0 247.5 Lower Income Borrowers
Total 1,120.3 1,104.2 937.9 726.0 619.5 778.6 683.5 620.7 FHA 178.3 129.0 102.6 85.8 245.1 428.3 387.3 313.8 PMI 236.3 202.1 207.6 308.2 142.3 40.3 26.0 34.8 CES 143.5 230.3 190.4 65.6 16.1 10.6 12.2 14.8 Subtotal 558.1 561.3 500.6 459.7 403.5 479.1 425.5 363.5 Majority-Minority Neighborhood
Total 614.6 615.2 527.0 364.7 321.5 343.0 301.5 261.0 FHA 87.6 57.4 46.2 48.0 146.1 209.1 186.5 150.4 PMI 112.1 84.4 77.2 132.2 73.9 19.2 10.4 12.7 CES 126.1 180.6 159.6 56.5 12.5 4.8 5.2 7.2 Subtotal 325.8 322.4 283.1 236.8 232.6 233.1 202.1 170.3 Lower Income Neighborhoods
23
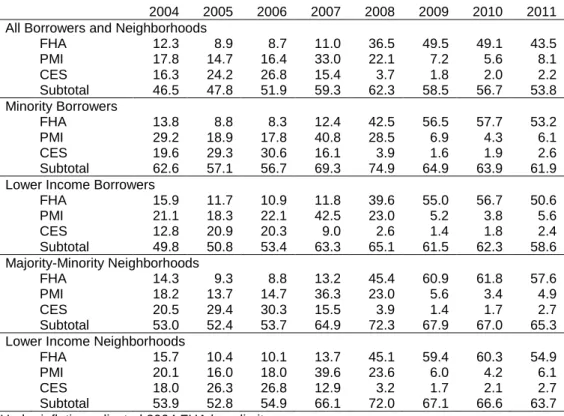
Table 2.1B High LTV Mortgage Product Market Share Percent
2004 2005 2006 2007 2008 2009 2010 2011 All Borrowers and Neighborhoods
FHA 12.3 8.9 8.7 11.0 36.5 49.5 49.1 43.5 PMI 17.8 14.7 16.4 33.0 22.1 7.2 5.6 8.1 CES 16.3 24.2 26.8 15.4 3.7 1.8 2.0 2.2 Subtotal 46.5 47.8 51.9 59.3 62.3 58.5 56.7 53.8 Minority Borrowers
FHA 13.8 8.8 8.3 12.4 42.5 56.5 57.7 53.2 PMI 29.2 18.9 17.8 40.8 28.5 6.9 4.3 6.1 CES 19.6 29.3 30.6 16.1 3.9 1.6 1.9 2.6 Subtotal 62.6 57.1 56.7 69.3 74.9 64.9 63.9 61.9 Lower Income Borrowers
FHA 15.9 11.7 10.9 11.8 39.6 55.0 56.7 50.6 PMI 21.1 18.3 22.1 42.5 23.0 5.2 3.8 5.6 CES 12.8 20.9 20.3 9.0 2.6 1.4 1.8 2.4 Subtotal 49.8 50.8 53.4 63.3 65.1 61.5 62.3 58.6 Majority-Minority Neighborhoods
FHA 14.3 9.3 8.8 13.2 45.4 60.9 61.8 57.6 PMI 18.2 13.7 14.7 36.3 23.0 5.6 3.4 4.9 CES 20.5 29.4 30.3 15.5 3.9 1.4 1.7 2.7 Subtotal 53.0 52.4 53.7 64.9 72.3 67.9 67.0 65.3 Lower Income Neighborhoods
FHA 15.7 10.4 10.1 13.7 45.1 59.4 60.3 54.9 PMI 20.1 16.0 18.0 39.6 23.6 6.0 4.2 6.1 CES 18.0 26.3 26.8 12.9 3.2 1.7 2.1 2.7 Subtotal 53.9 52.8 54.9 66.1 72.0 67.1 66.6 63.7 Under inflation-adjusted 2004 FHA loan limits
Looking at each low downpayment product separately, three distinct “waves” are evident. CES originations peaked in 2005 at over 625 thousand, accounting for over 30 percent of the home purchase market, but collapsed to just 30 thousand loans and two percent of the market by 2009. Private mortgage insurance spiked in 2007, rising to 571 thousand and a third of the market, but also fell as many mortgage insurers encountered high claims and heavy losses. Only after these conventional options had retrenched did FHA’s volume and market share increase.
The number of FHA endorsements rose from 190 thousand in 2007 to 527 thousand in 2008 and 739 thousand in 2009. As a share of the market, FHA increased from 11 percent in 2007 to nearly half in 2009. Figure 2.2 displays these three waves. The solid bars indicate loan originations under FHA’s 2004 loan limit, adjusted for inflation. The patterned bars indicate loan originations above these loan limits. Figure 2.2 shows that the majority of the increase in FHA lending was under the 2004 loan limits, and therefore not a consequence of loan limit increases.
24
mortgage insurance was disproportionately used by minority borrowers in 2004, accounting for 29 percent of origination compared to less than 18 percent across all borrowers and neighborhoods. Yet by 2009, the market share of private mortgage insurance was less in each of the underserved populations than the national average. Before 2011, piggyback loans are consistently less likely to be used by low- and moderate-income borrowers than the general population.
Figure 2.2 Low Downpayment Mortgage Products
*Adjusted for inflation 0
200 400 600 800 1,000 1,200 1,400
2004 2005 2006 2007 2008 2009 2010 2011
T
h
o
u
s
a
n
d
s
CES PMI FHA
CES PMI FHA
25
26
27
The results of the fixed effects models begin with Table 2.2. For ease of interpretation, estimates less than one will sometimes be described using their inverse. For example, an estimated coefficient of -0.250 might be described as one less FHA endorsement for every four originations of a conventional alternative.
The overall fixed effects model (Table 2.2) incorporates all borrower and neighborhood types. The coefficients capturing the effect of year reveal that even after controlling for demand from typically wealth-constrained applicants, conventional low downpayment alternatives, and economic conditions, the number of FHA endorsements increased between 2004 and 2008 before falling. The demand for credit from typically wealth-constrained populations has a statistically significant relationship with the number of FHA endorsements. Specifically, there is an additional FHA-insured loan origination for every 7.9 first lien home purchase mortgage applications from minority applicants, and an additional FHA endorsement for every 2.5 applications from lower-income households.
The unemployment rate also has a statistically significant and positive relationship with the number of FHA-insured loan originations, but the change in employment and the change in house prices are not statistically significant. Contrary to expectations, the coefficient for the denial rate on conventional first lien home purchase loans is statistically significant, but negative, indicating a higher denial rate is associated with fewer FHA endorsements.
28
Table 2.2 FHA Endorsements: National Fixed Effects Model
Coeff. Std. Err.
Applications
Minority 0.127*** 0.014
Low- and Moderate-Income 0.398*** 0.025 High LTV Substitutes
PMI Endorsements -0.448*** 0.024 CES Originations -0.719*** 0.035 Economic Conditions
Conventional Denial Rate -0.186*** 0.023 Change in Employment Level -0.018 0.035 Unemployment Rate 0.748*** 0.090 Change in House Prices 0.009 0.017 Year
2004 . .
2005 1.290*** 0.311
2006 2.764*** 0.340
2007 3.170*** 0.368
2008 5.400*** 0.395
2009 3.110*** 0.447
2010 1.805*** 0.446
2011 1.332** 0.443
Constant -0.806 0.801
N 415,360
F 227.6***
R2 0.858
Adjusted R2 0.837
AIC 2731533
Statistically significant at *10% level **5% level ***1% level
Table 2.3 presents the results when restricting the data by applicant characteristics. Among minority households (Table 3A), more of the variables representing economic conditions are statistically significant, including the year-over-year change in house prices. However, the coefficients do not always follow the expected signs. For example, an increase in county-level employment is associated with an
increase in FHA lending. In addition, the coefficients associated with the year of origination do not reveal an increase in FHA lending. In fact, there is a statistically significant decrease in FHA lending to minority households after 2008 relative to 2004. Among low- and moderate-income households (Table 3B), the pattern of statistical significance on control variables closely resembles that of the general model.
29
insured loans among minority households, or one less FHA endorsement for every 1.4 privately-insured loans among lower-income households. The degree of substitution between FHA insurance and CES originations is roughly one-to-one among both these sub-populations.
Table 2.3 FHA Endorsements: Minority and Lower Income Households
Minority Lower-Income
Coeff. Std. Err. Coeff. Std. Err.
Applications
Minority 0.307*** 0.017 . .
Low- and Moderate-Income . . 0.374*** 0.019
High LTV Substitutes
PMI Endorsements -0.511*** 0.039 -0.735*** 0.025 CES Originations -0.962*** 0.048 -1.054*** 0.048 Economic Conditions
Conventional Denial Rate -0.103*** 0.013 -0.112*** 0.013 Change in Employment Level 0.053** 0.020 -0.025 0.019 Unemployment Rate 0.568*** 0.059 0.353*** 0.056 Change in House Prices -0.045*** 0.007 -0.002 0.008 Year
2004 . . . .
2005 0.066 0.156 0.609*** 0.173
2006 -0.155 0.188 1.252*** 0.184
2007 -0.181 0.167 1.980*** 0.189
2008 0.143 0.186 2.344*** 0.200
2009 -1.268*** 0.281 1.684*** 0.262
2010 -1.703*** 0.281 1.426*** 0.272
2011 -1.852*** 0.255 1.029*** 0.258
Constant -0.579 0.459 -1.440** 0.445
N 415,360 415,360
F 136.9*** 284.9***
R2 0.821 0.855
Adjusted R2 0.796 0.835
AIC 2308048 2286247
Statistically significant at *10% level **5% level ***1% level
30
Table 2.4 FHA Endorsements: Minority and Lower Income Neighborhoods
Majority-Minority Lower-Income
Coeff. Std. Err. Coeff. Std. Err.
Applications
Minority 0.192*** 0.018 0.033** 0.012
Low- and Moderate-Income 0.351*** 0.026 0.311*** 0.018 High LTV Substitutes
PMI Endorsements -0.551*** 0.046 -0.411*** 0.029 CES Originations -0.909*** 0.047 -0.547*** 0.031 Economic Conditions
Conventional Denial Rate -0.220*** 0.039 -0.187*** 0.021 Change in Employment Level -0.120* 0.057 -0.021 0.028
Unemployment Rate 0.548*** 0.139 0.191** 0.061
Change in House Prices 0.028 0.023 0.030* 0.013 Year
2004 . . . .
2005 0.900 0.510 -0.149 0.264
2006 1.637** 0.603 0.442 0.293
2007 2.856*** 0.598 1.306*** 0.294
2008 5.851*** 0.659 4.223*** 0.343
2009 3.567*** 0.753 3.655*** 0.409
2010 2.602*** 0.749 2.642*** 0.366
2011 2.416** 0.740 1.621*** 0.333
Constant -1.055 1.217 3.280*** 0.612
N 130,437 141,812
F 74.1*** 119.0***
R2 0.855 0.827
Adjusted R2 0.834 0.802
AIC 876029 831802
Statistically significant at *10% level **5% level ***1% level
The results of the national model may obscure important regional variation in the degree of substitution. Consequently, separate models are run for every metropolitan area in the data, resulting in 358 estimates. Table 2.5 presents the averages from these metropolitan area models. Weighting the results by the number of observations (i.e., census tracts) in the metropolitan area increases the absolute value of the estimated substitution coefficients, but the averages of the metropolitan estimates are less than those derived from the national fixed effects model.
31
Table 2.5 Metropolitan Estimates of FHA Substitution: Summary
PMI CES
Mean Coeff. Std. Dev. Mean Coeff. Std. Dev.
Average -0.289 0.195 -0.478 0.290
Weighted Average -0.292 0.213 -0.548** 0.237 Statistically significant at *10% level **5% level ***1% level
Figure 2.4 Metropolitan Area Estimates Distribution
Note: Curved line shows normal distribution based on the weighted average and standard deviation of the
metropolitan estimates. The vertical dashed lines show the estimates derived from the national fixed effects model. Given the number of metropolitan areas, a Bonferroni correction is used to reduce the likelihood of obtaining false positives at the 5 percent confidence level when examining the distribution of
estimates.9 Even after this correction, 202 out of 358 models (56 percent) find the coefficient on privately-insured mortgages statistically significant, and 248 models (69 percent) find the coefficient on CES originations significant. Every statistically significant coefficient was negative, indicating substitution with FHA insurance. The large share of metropolitan areas for which the coefficients on low downpayment alternatives are negative and statistically significant indicates that product substitution is not limited to
9 i.e., critical p-value
= 𝛼 = 0.05 𝑛 = 358⁄ = .00014
0 10 20 30 40 50
M
et
ro
po
lit
an
A
re
as
-2 -1.5 -1 -.5 0 .5
PMI Coefficient 0 10 20 30 40 50
M
et
ro
po
lit
an
A
re
as
-2 -1.5 -1 -.5 0 .5
32
certain geographic regions. Nevertheless, Figure 2.5 shows some geographic patterns in the estimated coefficients. For example, none of the estimated coefficients on private mortgage insurance
endorsements are significant in metropolitan areas located in California, but 80 percent of the coefficients on CES originations in the state are significant and the mean value is stronger. Yet the strength and statistical significance of coefficients shows no systematic relationship to the level of PMI and CES activity.
Figure 2.5 Metropolitan Estimates of FHA Substitution
Finally, it is possible to use the model of FHA activity to create counterfactuals that isolate the impact of economic conditions from changes in conventional low downpayment alternatives. First, the number of FHA endorsements in a census tract is predicted while holding the number of PMI
33
employment, change in house prices and year of origination) to vary. Then the simulation is repeated with the number of conventional alternatives allowed to vary while holding economic conditions to their 2004 levels. Figure 2.6 shows the effect of these two components on the change in FHA lending, with the actual change represented by a solid black line. The decline in private mortgage insurance activity and piggyback lending contributed to an increase in FHA volume from 2006 to 2010. By contrast, economic conditions reduced FHA lending in 2006 and 2007, increased it in 2008 and 2009, then led to a reduction again in 2010 and 2011. Overall, over two-thirds of the increase in FHA activity between 2007 and 2009 was due to a decline in conventional low downpayment alternatives.
Figure 2.6 Components of Change in FHA Lending Year-Over-Year Change
Discussion
Based on the conceptual framework used in this paper, tightening FHA underwriting standards does not affect the number of conventional loan originations, but tightening conventional underwriting standards can increase the number of FHA endorsements. Underwriting involves multiple dimensions, but tightening standards ultimately results in fewer conventional loan originations and more FHA
endorsements. However, the degree of substitution appears greater between FHA and piggyback loans -200
-100 0 100 200 300 400
2005 2006 2007 2008 2009 2010 2011
T
h
o
u
s
a
n
d
s
34
than between FHA and private mortgage insurance, at least for the time period analyzed. This may be because while all loan products serve low wealth borrowers, FHA insurance and piggyback loans may cater to households with worse credit history than those households typically served by private mortgage insurance companies.
However, the delineation between conventional and FHA markets is not solely determined by underwriting standards but also by relative prices. Private mortgage insurers employ greater risk-based pricing, requiring higher premiums for higher-risk borrowers. At some threshold, these premiums exceed the flat and less cyclical prices of FHA. Effectively, relative prices help determine the maximum credit risk taken by conventional lenders and private mortgage insurers, but FHA influences this standard by its loan limits and premium schedules.
Indeed, FHA premiums have been raised multiple times, with the annual premium rising from 0.55 percent in early 2010 to up to 1.35 percent by mid-2013 (see Mortgagee Letters 2008-22; 2010-02; 2010-28; 2011-10; 2012-04; 2013-04). Nevertheless, FHA was less expensive at the start of 2015 than conventional loans financed through the government-sponsored enterprises for borrowers with credit scores under 680 and a downpayment of just five percent (Zandi and deRitis 2015). Although this paper accounted for changes in loan limits, it does not have enough information on private mortgage insurance premiums to control for relative prices. Consequently, conventional loan volumes may not be entirely exogenous to FHA policies and endorsements as assumed in the conceptual framework presented. The Obama Administration’s white paper on housing finance reform trumpeted “changes at FHA to help ensure the private market, not FHA, fills the market opportunities created by reform.”
35
mortgage insurers tightened underwriting standards and increased their own insurance premiums to guard against insolvency.
By contrast, FHA is able to ensure housing markets have continued access to mortgage credit because it is backed by the full faith and credit of the United States. But this public purpose is at odds with the financial viability of FHA’s insurance program. The first actuarial review of the Mutual Mortgage Insurance Fund stated, “We do not believe it is possible to build MMI’s equity to a level needed to cover catastrophic risk. To do so would require premiums at levels that would impair MMI’s social purposes. Catastrophic risk is implicitly covered through the backing of the U.S. Treasury” (Price Waterhouse 1990). In this sense, the credit subsidies estimated for FHA’s books of business in the housing crisis, and ultimately the negative economic value of the Mutual Mortgage Insurance Fund, act as an automatic economic stabilizer similar to unemployment insurance and akin to stimulus policies like the Emergency Economic Stabilization Act of 2008 and the American Recovery and Reinvestment Act of 2009.
Prematurely scaling back FHA’s activity may jeopardize recovery of the housing market. According to Moody’s Analytics, homes sales would have fallen an additional 2.4 million, and prices dropped nearly another 20 percent, if FHA had stopped insuring loans in October 2010. “Arguably the most important policy response to the housing crash has been the dramatic expansion of Federal Housing Administration lending” (Zandi and deRitis 2010). Moreover, retrenching before the Mutual Mortgage Insurance Fund is recapitalized creates an inter-temporal form of adverse selection, where FHA is most concentrated in the worst performing years of the housing cycle. The 2007 to 2009 books of business are projected to ultimately cost the Fund nearly $27 billion (HUD 2014).More recent
endorsements are projected to yield budgetary cost savings. But the Mutual Mortgage Insurance Fund’s capital ratio is still just 0.41 percent, well below the two percent required by the National Affordable Housing Act of 1990. Curbing fraudulent practices, such as seller-funded downpayment assistance programs, is necessary, but excessively raising premiums and tightening underwritings standards may be self-defeating.