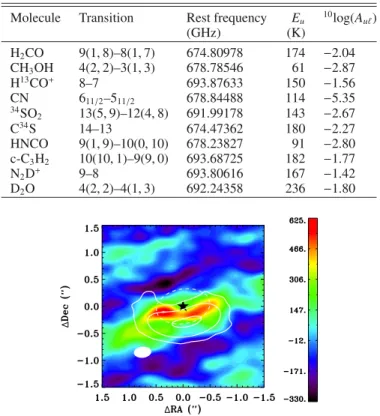
Warm formaldehyde in the Ophiuchus IRS 48 transitional disk
Full text
Figure


Related documents
A proposed ordinance (Appendix A) amending the Los Angeles Municipal Code to categorize low-intensity medical service uses as medical service professional offices;
Once the store manager (participant) has presented a plan for better telephone service and has answered your questions, you will conclude the role-play by thanking the participant
In order to establish the effect on young children’s arithmetical competencies, we will be comparing the test results and the time taken to solve problem of those
We applied the nanoparticles to acute mouse hippocampal slices while recording the action potentials from single neurons in the CA3 region.. Our results show that CA3
The aims of this observational study were to explore the relationship between maternal iron status in the third trimester and adverse birth outcomes in Chinese pregnant women,
From the subgroup analysis of data from women who received cryopreserved oocytes from donors, even though the mean number of oocytes thawed/warmed per cycle were similar, some
Additional file 1: Table S3 also shows the log ratio change of gene expression determined by microarray analysis for proteins identified by proteomics analysis in 6- and 25-week-old
This table shows numbers written in hebrew with the geresh and gershayim punctuations marks, as they would be if the numbers were embedded in text. 1-10 ʾʠ ʾʡ ʾʢ ʾʣ ʾʤ ʾʥ ʾʦ


