HAZARD MITIGATION
STRATEGY APPLICATION
An Evaluation of the Town of Princeville’s
Future Mitigation Strategies
ABSTRACT
This study looked at possible hazard mitigation options that can be implemented in Princeville, North Carolina. Having faced numerous extreme flooding events in the past few decades, the town is currently susceptible to further damage. The town flooded for various reasons, including the lack of proper structural mitigation measures currently in place. Based on the recommended mitigation measures brought forth by the North Carolina Emergency Management, this study evaluated three of their approaches using case studies: 1) Buyouts, 2) Town Relocation, and 3) Structural Elevation. The case study towns had previously implemented these mitigation practices post-disasters, and they were evaluated on their applicability to Princeville. To determine the best fit mitigation strategy for Princeville, a policy evaluation framework was used. The evaluation criterion has 5 parts: 1) Effectiveness, 2) Efficiency, 3) Flexibility, 4) Equity, and 5) feasibility. This study found that the best mitigation strategy to be applied to Princeville is a combination of buyouts and town relocation that will focus on the most flood-prone areas first. These strategies will also be used to preserve the cultural and historical history of Princeville.
Alexis Vreeland
Department of City and Regional Planning
Page | 1
Table of Contents
1. Introduction and Problem Background ... 2
2. Mitigation ... 10
3. Classifications ... 13
4. Study Area ... 14
5. Methods ... 20
6. Case Studies ... 21
7. Results ... 34
8. Discussion ... 37
9. Concluding Thoughts ... 40
References ... 41
Appendix ... 46
Page | 2
1. Introduction and Problem Background
1.1 IntroductionEastern North Carolina has been drastically impacted by inland flooding over the past 20 years. While flooding can be caused by many sources, during this time, the state has been hit by three major Hurricanes that caused unprecedented damage to the area. Thousands of people across the state were affected by these storm events, and even today, many are still feeling the effects of these storms. One particular area that was hard hit by these storms was Princeville, North Carolina. The town was damaged during both Hurricane Floyd and Hurricane Matthew, and is currently ill prepared to withstand another major storm. With the potential increase in catastrophic storms on the horizon, it is relevant to consider future mitigation strategies that the town can employ in order to better prepare them for the future.
This paper will further advance mitigation practices in the state by being proactive rather than reactive to flooding events. The paper will qualitatively evaluate mitigation strategies proposed by North Carolina Emergency Management in comparison to similar strategies implemented across the coast and in similar hard-hit communities. Specifically, this paper will look into towns that mitigated while preserving the culture and/or the character of their towns. These strategies and scenarios will then be applied to the town of Princeville to evaluate their proposed effectiveness in preventing future flooding events.
1.2 Climate Change
Climate change is said to be caused by two primary factors, natural and human induced. Natural causes of climate change include phenomenon such as cyclic variability and volcanic eruptions. According to NASA, “These natural causes are still in play today, but their influence is too small or they occur too slowly to explain the rapid warming seen in recent decades” (NASA, 2010). As research and studies have demonstrated, the main driver of climate change is anthropogenically caused, by humans. Humans, and the greenhouse gasses emissions that they generate, are the leading cause of the earth’s rapidly changing climate (Denchak, 2017). Until climate change can be taken under control and hopefully stalled or reversed, humans will be stuck in a never-ending cycle of adapting to their ever-changing climate. Whereby land cover, as “shaped by land use practices, affects the global concentration of greenhouse gases” and due to that, a changing climate can lead to changes in land use and land cover and people must adapt to their new reality mentally and physically (USGS, n.d.).
Page | 3
change amplifies three primary factors associated with hurricanes: storm surge, rainfall, and potential speed.
Warmer air can contain more water vapor than cooler air and global “analyses show that the amount of water vapor in the atmosphere has in fact increased over both land and oceans” (Walsh, Wuebbles, Hayhoe, Kossin, Kunkel, Stephens, & Anderson, 2014). For every 1.8°F increase in temperature, the atmosphere can hold 7% more water. Gabriel Vecchi, a geosciences professor at Princeton University stated, “A warmer ocean makes a warmer atmosphere. A warmer atmosphere can hold more water. So, all other things being equal, the same storm on a warmer planet will give you more rainfall” (Kluger, 2017). As the planet warms, the potential for more rainfall increases more than there was decades or even a few years ago.
According to the Center for Climate and Energy Solutions, rainfall rates during storms are expected to increase by about 20 percent (2018). Scientists predict that warmer sea surface temperatures can also intensity tropical storm wind speeds. Models for the continental United States in the Atlantic Basin project a 45-87 percent increase in the frequency of Category 4 and 5 storms (C2ES, 2018). Given these facts, cities in the United States need to be prepared for hurricanes that are stronger, faster, and wetter than past events. In order to prepare, cities need to understand the dangers that hurricanes pose as well as how to cope and adapt to them in the present and future.
1.3 Hurricanes
Hurricanes are formed when heat is given off from oceans and it is converted to wind. The warmer the oceans become, the more potential there is for these storms to form. Hurricanes have three major effects: wind, storm surge, and heavy rains. Hurricane winds can become very powerful, and pose an increasing threat as storms become larger and more powerful. Wind is responsible for much of the structural damage caused by hurricanes (Weather, 2013). The maximum winds from “fast moving and powerful storms may remain high, even when the storm is well inland” (Weather, 2013).
Storm surge is potentially catastrophic for coastal areas, such as the beaches along North Carolina’s coast. Generally speaking, the stronger the hurricane is, the stronger the storm surge will be (Weather, 2013). As the hurricane approaches land, the winds dive the water towards the shore. When the hurricane becomes closer, the water piles up and the water is forced onto the shore. This can cause devastating effects for the coastal areas (Weather, 2013).
Page | 4
areas where the storm initially strikes, but also can affect areas hundreds of miles from where the storm originally made landfall” (Weather, 2013). It is not uncommon for a storm to drop anywhere from 5-10 inches of rain. However, if the storm is moving slowly, rainfall could be even more excessive. Some hurricanes have produced over 20 inches of rain (Bales, Oblinger, & Sallenger, 2000). Intense flooding can also occur from “tropical depressions and storms that do not reach hurricane strength” (Weather, 2013). Even though most people associate hurricane damages with the coast, this paper, aims to among other things, shed light on the devastation that hurricanes can cause inland.
1.4 Inland Flooding
According to Howard Kunreuther from Penn State, flooding is the natural disaster that causes the most damage and impacts the greatest number of people worldwide (2018). Inland flooding can result under a number of factors. Sometimes moderate precipitation falls for several days. Other times, intense precipitation falls over a shorter period of time. Lastly, in instances where a dam, levee, or dike fails (Walsh, 2014).
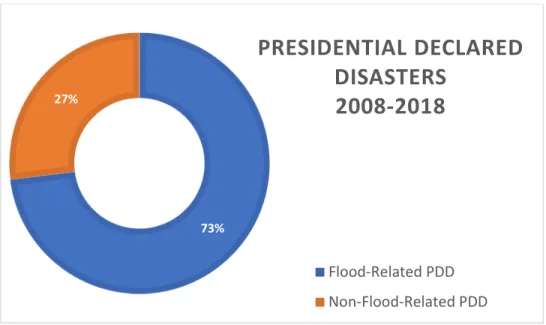
As demonstrated by the “widespread impacts of Hurricane Agnes (1972), Tropical Storm Dennis/Hurricane Floyd combo (1999), and Tropical Storm Allison (2001), inland flooding is a major threat that tropical and extratropical cyclones pose for people and property inland from the coast” (Walsh, 2014). Figure 1 below shows the proportion of natural disasters in the last 10 years that involved flooding.
Figure 1: Presidential Disaster Declarations in the past 10 years that included flooding Data Source: FEMA. (n.d.)
73% 27%
PRESIDENTIAL DECLARED
DISASTERS
2008-2018
Page | 5
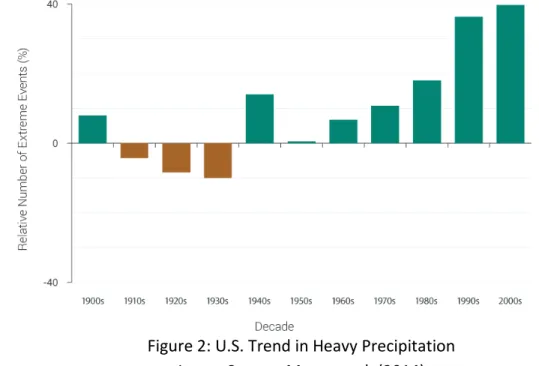
The Third National Climate Assessment found that the risk of inland flooding has increased as heavy downpours have increased across the United States in the last 3-5 decades as seen in Figure 2 below. This coincides with increase global temperatures and the increasing potential for storms to hold more water. The heaviest rainfall events have become heavier and more frequent.
Figure 2: U.S. Trend in Heavy Precipitation Image Source: Moser et al. (2014)
Inland floods caused more damage annually than any other severe weather event – averaging $6.9 billion per year for the period 1976-2006 (Walsh, 2014). This figure is expected to rise as storms become stronger and occur more frequently. Along with damage, inland flooding can also lead to a large number of deaths. More than 60% of U.S. related hurricane deaths from 1970-1999 occurred in inland counties. More than half of those deaths were related to freshwater flooding (Moser, Davidson, Kirshen, Mulvaney, Murley, Neumann, Petes, & Reed, 2014). At least 23% of U.S. tropical cyclone deaths occurred to “people who drown in, or attempting to abandon, their cars” (Rappaport, 2002). This results from, among other factors, a lack of preparedness and education related to natural hazards.
Page | 6
1.5 Hurricanes in North Carolina
1.5.1 Hurricane Floyd
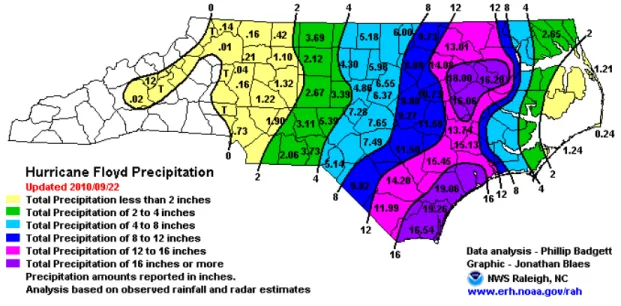
In the past 20 years, North Carolina has been hit by three major hurricanes that caused unprecedented damage and lost lasting effects. On September 16, 1999, Hurricane Floyd struck North Carolina as a category 2 storm on the Saffir-Simpson wind scale. This storm was preceded 10 days prior by Hurricane Dennis which dumped 6 to 16 inches of rain across the eastern part of the state. Due to the recent rain from this storm, when Floyd passed over and dumped an additional 12 to 20 inches of rain, the rivers overflowed their banks and flood waters creeped into communities across the eastern part of the state (Lawrence, Avila, Beven, Franklin, Guiney, & Pasch, 2001). Hurricane Floyd was twice the size of typical Atlantic hurricanes which shows the growing trend of more intense, larger storms as the Atlantic Ocean warms with global change (WRAL, 2009). With the exception of the Lumber River, all the major river basins in North Carolina experienced 500-year recurrence interval flooding (Bales et al., 2000). This demonstrates that flooding can cause tremendous impacts inland, and therefore solutions need to be studied and applied before more devastation occurs.
Figure 3: Estimated Rainfall over Eastern NC During Hurricane Floyd Image Source: ESP Associates Inc. (2018)
Page | 7
off guard when the Tar River overran its bank overnight and spilled water into the town. Not knowing what to expect due to lack of flooding education and personal experiences, people climbed onto their roofs to escape the encroaching water and had to be rescued (Herring 2000). The town of Princeville, for instance, had not flooded since 1958 (Bales et al., 2000). 86 percent of the deaths from the storm were due to inland flooding; thankfully none occurred in Princeville (Barnes 2013). After the flood waters receded, every single house of the 890 homes in Princeville was rendered “uninhabitable or seriously water damaged” (Chapman 2002). Most of the local businesses and houses were destroyed (MacConnell, 2017).
The total damage from the storm is estimated at $6 billion, most of it caused by flooding (Bin & Polasky, 2004). Before Hurricane Floyd, many people in eastern North Carolina did not have flood insurance and many homeowners that lived in floodplains were not aware that they were living in a floodplain (FEMA 2002). Flood maps were reevaluated after these storms, and many citizens became aware of their home’s flood prone status. However, whether they are affordable or not, today, many homeowners in flood zones do not have flood insurance policies (Kunreuther, Watcher, Kousky, & Lacour-Little, 2018). This presents a gap in knowledge, execution of ideals, and the dangerous vulnerabilities that people have placed themselves into by remaining in flood zones.
Page | 8
1.5.2 Hurricane Matthew
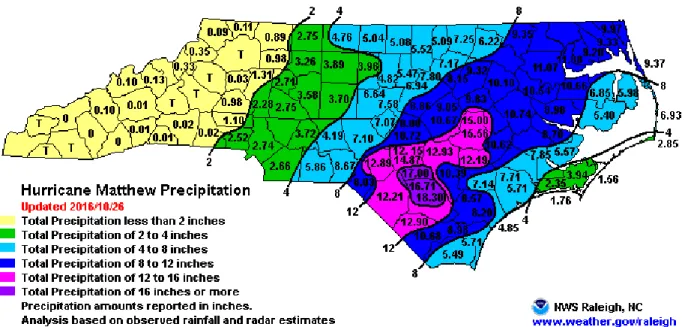
Hurricane Matthew, a category 1 storm, hit North Carolina in October of 2016 with 75-mph sustained winds. Like Hurricane Floyd, it was proceeded by another storm that caused saturation in the area. Hurricane Matthew inundated Eastern North Carolina due to the fact that it lingered inland longer than expected and dropped twice as much rain than was predicted (WRAL, 2017). Matthew brought widespread flash flooding and record river flooding to eastern North Carolina (Stewart 2017). Hurricane Matthew caused $4.8 billion in damage, affecting 98,000 homes and 20,000 businesses (Bidgood, 2017).
Figure 5: Estimated Rainfall over Eastern NC During Hurricane Mathew Image Source: NOAA. (2016)
Residents of Princeville were escorted out of the town preceding the storm in anticipation of the flooding (MacConnell, 2017). The town received more than 10-feet of flood water and more than 80% of the town was underwater. The Tar River gauge recorded a record crest at 36.29 feet, 17 feet above flood stage. Residents were not able to return to their homes for 2 weeks. The National Guard’s 875th Engineer Company pumped more than 76 million gallons of water from
Page | 9
Figure 6: Hurricane Matthew Damage in Princeville, NC. Image Source: HMDRRI. (2017)
1.5.3 Hurricane Florence
Page | 10
2. Mitigation
2.1 Emergency Management Cycle
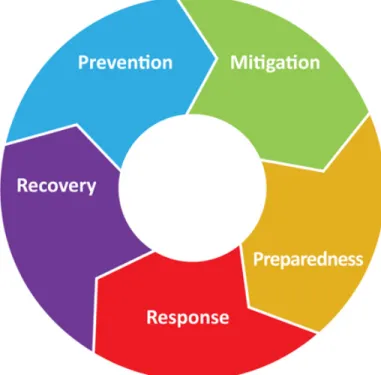
An emergency management program “examines potential emergencies and disasters based on the risks posed by likely hazards; develops and implements programs aimed toward reducing the impact of these events on the community, prepares for those risks that cannot be eliminated; and prescribes the actions required to deal with the consequences of actual events and to recover from those events” (FEMA, n.d.). The steps that make up this program can be seen in the 5-step emergency management cycle, in Figure 7 below.
The 5 steps are Prevention, Preparedness, Response, Recovery, and Mitigation. Prevention is actions taken to avoid an incident. Preparedness is “concerned with actions that are taken in advance of an emergency to develop operational capabilities and facilitate an effective response to an emergency” (Cova, 1999). Response actions are “carried out immediately before, during, and immediately after a hazard impact, which are aimed at saving lives, reducing economic losses, and alleviating suffering (St. Louis, n.d.). The recovery phase is characterized by activities that hope to return life to normal or improved levels (Cova, 1999). Lastly, and the focus of this analysis, is mitigation.
2.2 Mitigation Definition
Mitigation is the “effort to reduce loss of life and property by lessening the impact of disasters” (FEMA, 2018). In order for mitigation to be effective, action must be taken now, before the next disaster, to reduce damage, loss, and consequences later. As FEMA notes, “It is important to know that disasters can happen at any time and any place and if we are not prepared, consequences can be fatal” (2018). Effective mitigation requires that we “all understand local risks, address the hard choices, and invest in long-term community well-being” (FEMA, 2018). Without mitigation actions, “we jeopardize our safety, financial security, and self-reliance” (FEMA, 2018). The goal of risk reduction is to reduce the risk of life and property, not only to existing structures, but to future construction as well.
Page | 11
2.3 Importance
Due to the increasing nature of storms and their worsening effects, discussing mitigation strategies is important. Cities are complex and interdependent systems, extremely “vulnerable to threats” from natural hazards (Godschalk, 2003). The very features that make cities feasible and desirable – “their architectural structures, population concentrations, places of assembly, and interconnected infrastructure systems” – also put them at high risk to floods and hurricanes (Godschalk, 2003). Adaptation to the “inevitable impacts of a changing climate has emerged as a pressing concern at all levels of government, but actions are still hampered by lack of engagement, lack of resources, lack of adaptation-related research, poor understanding of vulnerability, and limited capacity to improve these conditions in the face of competing policy priorities” (National Research Council, 2006). Resiliency is important because “people and property should fare better in resilient cities struck by disasters than in less flexible and adaptive places faced with uncommon stress” (Godschalk, 2003).
Mitigation is valuable to a society because it creates safer communities, it allows people to recover from disasters more rapidly, and it lessens the financial impact on individuals, communities, and society as a whole (FEMA, 2018). Effective mitigation efforts can break the cycle of disaster damage, reconstruction, and repeated damage. In many cases, mitigation before a future disaster is the best and most cost-effective strategy. FEMA estimates that $1.00 spent on pre-disaster mitigation saves society an average of $4.00 in lower damages after a potential disaster (Weiss, 2013).
2.4 Strategy
Mitigation is proactive rather than reactive, and this is something that needs to be brought to the forefront of thought as we move forward into the future. As David Godschalk said, “rather than simply waiting for an extreme event and then trying to respond, mitigation planners estimate vulnerability to hazards and take anticipatory actions to lessen risk and exposure” (2003). Mitigation measures should be incorporated into planning for the future in all towns.
Page | 12
2.5 Public Involvement and Education
Mitigation can also be hindered by lack of public education and awareness of the severity of issues, especially when it comes to climate change and increased threats. The National Research Council notes that “risk communication is an important method by which hazard managers can increase the adoption and implementation of hazard adjustments by households, businesses, neighborhood organizations, and government agencies” (2006). There are also many factors that can limit people’s ability to adapt, such as social vulnerability. These factors include “lower income, minority stats, low educational achievement, advanced age, income dependencies, employment in low paying service, retail, and other sectors as well as being often place-bound, less economically and socially mobile, and much less likely to be insured than wealthy property owners” (Moser et al., 2014).
Increased public education about storm management, effects, and mitigation would be very beneficial to the future goals of hurricane mitigation. The average everyday person historically tends to rely on their observations of the world regarding these types of events as noted in the article The risk perception paradox—implications for governance and communication of natural
hazards (Wachinger, Renn, Begg, Kuhlicke, 2012). If people are informed of their risks, they might
make more informed decisions regarding mitigation strategies.
2.6 Next Steps
Page | 13
3. Classifications
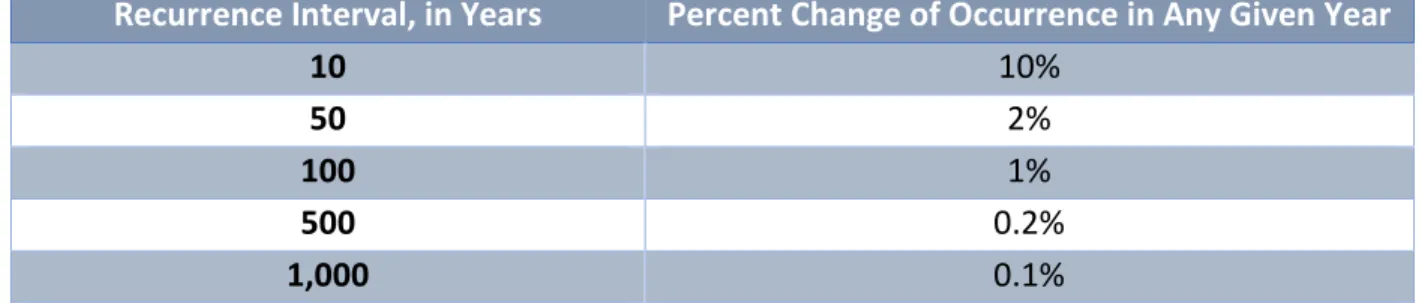
3.1 Storm RecurrenceBoth Hurricane Floyd and Hurricane Matthew caused 500-year flood events, meaning that the extent and intensity of the flooding is only projected to occur once in 500 years, or a 0.2 percent chance. Unlike the previous major storms, Hurricane Florence was a 1,000-year flood event, 0.1 percent chance of occurring in any given year
Table 1: Flood Recurrence Intervals. Data Source: Modified from USGS
Recurrence Interval, in Years Percent Change of Occurrence in Any Given Year
10 10%
50 2%
100 1%
500 0.2%
1,000 0.1%
Page | 14
4. Study Area
4.1 PrincevilleThe study will focus on the town of Princeville, North Carolina. Located in Edgecombe County, Princeville is just over 1.5 mi2. Princeville is adjacent to
the Tar River which has a drainage area of 2,283 (Walbert, n.d.). Princeville is separated from the nearby town of Tarboro by the Tar River which circles and gives shape to the town. The boundaries of the town are surrounded by vegetation and farmland.
4.2 Demographics
Princeville is a historically black community that was established by freed slaves after the civil war in 1865. The town is home to approximately 2,830 people as of 2017 according to the ACS 2017 5-Year Estimate. This is up from a population of 1,700 in 2000 and down from a population of almost 3,000
in 2010. 33% of the town is age 55 and over and 73.96% of the town is over the age of 18. Overall, the population of the town is aging, and majority female at 58.59%.
93.25% of the residents consider their race Black or African American followed by 6.75% of the residents who consider themselves white (American Community Survey, 2017). While 75.35% of the population graduated from High School, only 3.9% of the population over 25 has a Bachelor’s Degree or more. The median household income is $29,071. The poverty rate in Princeville is 37.2%, with an unemployment rate of 23.5%. Overall, Princeville is a “low-income, high-poverty town, adding significant burden to its recovery” (HMDRRI, 2017). This renders the town economically vulnerable to natural disasters (HMDRRI, 2017).
The central downtown census block is “over 50% renters who are more likely to be permanently displaced post-disaster. Housing values are low which decreases the amount of compensation residents can receive if they pursue the acquisition of their home through the Hazard Mitigation Grant Program” (HMDRRI, 2017).
Page | 15
4.3 Proposed Mitigation Measures
The town of Princeville has evaluated mitigation measures in the past after their various disasters. These include levee reconstruction, floodplain buyouts, town relocation, and raising houses. Those evaluations are included below.
4.3.1 Princeville’s Levee Reconstruction
The town is located in a natural flood zone, “characterized by its low-lying topography which includes both floodway and flood plain” (MacConnell, 2017). Between 1800 and 1958, the town had been overwhelmed by major floods seven times. After a major flood in 1958, with a peak stage of 29 feet, the town officials of Princeville approached the Army Corps of Engineers with a way to protect their city in the future (Chapman, 2002). In 1967 a 3-mile, $4 million earthen levee was built which could accommodate 37 feet of water. The levee stands approximately 34 feet taller than the river. President Clinton visited the Princeville after Hurricane Floyd and promised to rebuild Princeville and the levee was refortified with clay (Chapman, 2002). At that time, Princeville decided to repair the levee rather than taking a federal buyout that might have broken up the historic town (Bowman, 1999). The mayor supported the decision by stating that it would keep the tax base of the town together (Bowman, 1999). Since that time, there have been talks about adding to the levee and repairing it further, however, it currently stands no higher now than it was in 1967.
The Army Corps of Engineers conducted a study on Princeville in April of 2016, just six months before Hurricane Matthew stuck the area. The study found that several culverts along U.S. Highway 64 were not equipped with gates which could have been opened to help drain water during the flooding. The system that was designed to protect the town “may have brought damage to Princeville – first from Floyd and then from Matthew” (WRAL, 2017). Among the widest criticisms of flood control by levees is that “development in levee-enclosed areas promotes the false expectation that flood risk is reduced to zero” (Pinter, 2005). Along with the failure of the Princeville levee, other structural and manmade structures alone may not be adequate to accommodate heavy rains. Whenever the volume of water on land overcomes the “capacity of the natural and built drainage systems to carry it away, flooding can result” (Walsh, 2014). The breaches of the levee demonstrated a failure in the flood protection system.
Page | 16
The levee fix and extension will also place strain on the neighboring town of Tarboro that flooded during Hurricane Matthew due to the levee. The flooding that occurs to the Town of Tarboro will only “increase as the existing levee is fixed and extended” (MacConnell, 2017). This is an important factor to consider when deciding mitigation measures. Due to this, and the continued untimely inaction on this matter, this paper will not evaluate levee repair as one of its proposed mitigation measures.
Figure 9: Location of Princeville’s Levee and its Culverts. Image Source: US Army Corps of Engineers. (2014).
4.3.2 Floodplain Buyouts
Page | 17
Mississippi River flooding of 1993” (Tate, Strong, Kraus, & Xiong, 2016). There are 5 key steps in the HMGP Buyout Process. 1) Initiation, 2) Application, 3) Evaluation, 4) Distribution, 5) Implementation (James-Kavanaugh, Foster, Chalder, Anagnost, Salvesen, Lerner, & Kihslinger, 2017). This process is illustrated in Figure 10 in the appendix.
Once structures are removed, the space becomes dedicated to recreations, open space, or wetland management uses. These properties can “offer opportunities to restore and permanently protect natural habitats and help conserve biodiversity, while also improving community resilience and providing other community benefits” (James-Kavanaugh, 2017). Some parcels are converted into parks or restored to their natural habitats. Restoration of these lands to natural habitats can increase the quality and functionality of natural habits - in addition to various resiliency benefits. Once the building is demolished, it is considered complete; and from there the site becomes the responsibility of the local government – sometimes with little funding or guidance on post-acquisition restoration, long-term management, and maximization of community benefits. In such cases, “there is an untapped opportunity for communities to leverage the potential benefits of these properties. These benefits may be especially important for the residents of vulnerable and disadvantaged communities who remain in these locales” (James-Kavanaugh et al., 2017).
Since 1993, FEMA’s Hazard Mitigation Grant Program has funded the acquisition of over 37,000 flood-damaged properties and this number will continue to grow as extreme weather events become more common and costlier (James-Kavanaugh et al., 2017). In North Carolina today, more than 450,000 people, approximately 5% of the state’s population lives in flood prone areas, as defined by FEMA’s 100-year floodplain (PuroClean, 2017).
Some towns can be wary of offering buyouts fearful that it will “destroy established neighborhoods or strain municipal budgets” (WRAL, 2017). Communities are fearful that buyouts can “cut right into the heart of what makes a community work” (WRAL, 2017). These fears can contribute to a community’s hesitancy to offer buyouts to all of its residents, and these fears will need to be solved to have a successful program. Princeville was very wary of offering flood buyouts after Hurricane Matthew fearing it will have devastating effects on the town. Mayor Bobbie Jones believes buyouts would deplete the town’s already small tax base (WRAL, 2017). As MacConnell and associates note, buyouts were “turned down by the residents due to cultural, economic, and social reasons” (2017).
Page | 18
participate in a buyout and relocate within the community” (Salvesen, BenDor, Kamrath, & Ganser, 2018). “For a variety of reasons, (strong ties to the community, cost of replacement housing, length of the buyout process), some eligible homeowners choose not to participate in a buyout” which can create barriers for change and progress (Salvesen et al., 2018). These incentives would also benefit the community who might be wary of offering the program in fear of losing town residents and tax base revenue.
4.3.3 Town Relocation
After the recent flooding events, there have been recommendations and suggestions that the town of Princeville should be relocated. Currently, a 52-acre site, nearby the current town of Princeville, is being considered as a new location for the town. FEMA has offered to buy out the Town of Princeville. FEMA has agreed to “buy out each individual property. This could be a good option for those who are willing to move” (McConnell, 2017). It would be important to develop the new town with purposeful planning, and McConnell and Associates note,” This area could be developed with infrastructure and utilities to provide a sense of community” (2017).
4.3.4 Raising houses
Structural mitigation, such as raising homes is being considered in towns such as Princeville. Princeville town leaders have requested that all homeowners raise their homes 2 feet above the flood plain, as determined by the state. Homeowners will not be required to raise the elevations of their houses, but the mayor said “those who do not elevate their homes to meet the new standard could face higher insurance costs” (WRAL, 2017). This is a form of structural mitigation; however, many residents will not be able to afford this option, and many will likely face higher insurance costs as a result, which could drive even more people out of town. This option hopes to ensure that more structures are safe should flood waters come, but many are wary that this will not help the houses that are the most vulnerable.
4.4 Planning Workshop
Page | 19
express why places matter to them and designers being creative to adapt not just the physical place, but adapt in a way that fits the way people see their community” (Cohen 2017).
This paper will explore one of the challenges brought up by the design workshop: Prioritizing Historical Significance, Preservation, and Recovery. As noted from the workshop, “Because of Princeville’s unique history and significance there is an ardent desire to preserve the history of the Town, tied to the land where the Town was founded, as well as existing community social ties. The broad decision of whether to rebuild or relocate is complicated by this desire for preservation. Because of this context, the notion of annexing new land has been met with a full spectrum of positive and negative feedback from residents. This decision must be approached with care by state and federal agencies. The independence and self-determination of Princeville is a common theme important to residents who submit comments and feedback to planners. Interactions with other governmental bodies are often tinged by mistrust based on historical interactions with outside institutions. This history should be kept in mind as we work with Princeville to help them chart a path forward.” (2018).
Page | 20
5. Methods
In order to mitigate effectively and efficiently, studies need to be performed to identify the best solution for each area on a case by case basis. Based on hazard mitigation recommendations brought forth in the Tar River Basin Flood Analysis and Mitigation Strategies Study, various mitigation measures will be analyzed to best gauge the suitability of those measures to provide the best-case scenario for the future hazard resilience of the town. The report, prepared by North Carolina Emergency Management, in partnership with North Carolina Department of Transportation, aimed to identify possible mitigation strategies to prevent future flood damage. The study identified 12 strategies.
This study will look at three strategies: 1) Buyouts, 2) Town Relocation, and 3) Structural Elevation. These mitigation measures are also echoed in the Hurricane Matthew Flood Assessment Study on the Town of Princeville by the Engineering firm MacConnell & Associates, P.C. The recommendations suggested by the firm are: 1) Raising all structures in the town so that the lowest floor is 2-feet above base flood elevation, 2) Extend and Upgrade the levee, 3) Relocate the Town (MacConnell, 2017).
Each of the three chosen mitigation strategy scenarios will look at a case study town that has implemented the proposed mitigation. These cities will be analyzed to determine their mitigation measures and how and why they were implemented post-disaster. Special emphasis will be placed on cities that share cultural, historic, and/or spatial characteristics with Princeville.
This paper will analyze the various mitigation measures presented in these papers and how they were implemented in these case study cities. Finally, to determine the best fit mitigation strategy for Princeville, a policy evaluation framework will be used. The evaluation criterion has 5 parts: 1) Effectiveness, 2) Efficiency, 3) Flexibility, 4) Equity, and 5) feasibility. This will be used to try to reconcile mitigation strategies with the findings from the case study cities to find the best application of mitigation strategy for the future preservation of Princeville. Each evaluation criteria will be given a number rating on a scale from 0 to 5, with 5 being the best.
Page | 21
6. Case Studies
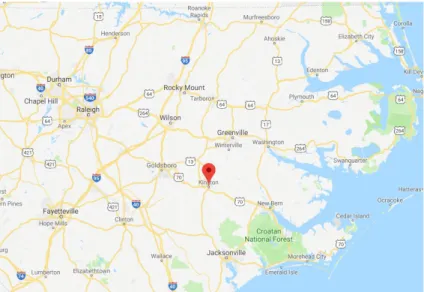
This paper will utilize three cities and their chosen mitigation strategies as case studies. The cities are Kinston, North Carolina, Valmeyer, Illinois, and Weymouth, Massachusetts. These cities were chosen due to their size, vulnerabilities to natural hazards, and based on the mitigation measures that they utilized in their various recoveries.
6.1 Kinston, North Carolina – Floodplain Buyouts
6.1.1 Background
Located in Lenoir County, the city of Kinston is home to about 20,000 residents. Located adjacent to the Neuse River, a portion of the city is susceptible to flooding. Kinston suffered repeated floods and flood losses during the 1990s. After Hurricanes Fran, Dennis, and Floyd damaged or flooded more than “75 percent of the county’s homes, the community embarked upon a comprehensive approach to improve resilience” (Short, n.d.).
6.1.2 Mitigation
To improve their resilience, “flood-prone properties were purchased, and whole neighborhoods were relocated to higher ground. As a result, natural floodplain functions were restored, and the purchase of the first 100 homes saved approximately $6 million in avoided flood losses during the next big storm” (Short, n.d.).
After Hurricane Fran in 1996, the city completed the acquisition program of 188 properties. Less than 10 months later, Hurricane Floyd struck the area. Several city officials indicated in interviews that they “drew upon the experience they gained from Hurricane Fran to help them navigate the buyout process in the aftermath of Hurricane Floyd” (UNC-CH, n.d.). According to the Institute for the Environment at UNC-CH, “For Kinston, eight years elapsed between the date of the flood and the approval of the last HMGP grant. In total, the city purchased over 1000 homes during
Page | 22
that period. It also purchased over 100 vacant lots, using funds from the State’s Clean Water Management Trust Fund, and purchased and removed several junkyards from the floodplain” (n.d.).
As of August 2018, Lenoir County was awarded $7,925,908 for assistance with Hurricane Matthew damage, almost 2 years after the storm hit and 1 month before Florence would hit and threaten this area once again. These funds will be used to buyout 83 more properties.
6.1.3 Lessons Learned
In 2005, the City of Kinston assembled an Open Space Committee and released its own study on using the land, entitled Retro-Green. The plan called for the “placement of greenway trails, urban forests, and a skeet range on the nearly 1,000 acres of public land”, however, little has been made of the plan (UNC-CH, n.d.). Progress has been limited by a lack of resources and political commitment as well as the inability to purchase the few remaining privately owned parcels distributed throughout the study area. One of the four primary goals of the plan was to develop a “strategy to acquire private properties in project area that are surrounded by previously acquired properties”. Local officials interviewed indicated that the failure to secure these properties is the “single greatest obstacle to using hundreds of acres of public land” (UNC-CH, n.d.). If the full potential of the buyouts cannot be realized, it may pose a risk to the success of the program for years to come. If the acquired properties are “sufficiently clustered or contiguous, the municipality could create an amenity, such as a park or greenway, that could add
value to surrounding properties, thus boosting the tax base. If, however, the pattern is random, a community’s options for using the acquired properties are limited” (Salvesen et al., 2018).
Other properties in Kinston have been left untouched for years, and others have become unofficial dumping grounds which can contradict the goal of the program to help the natural environment as seen in Figure 12.
However, some areas have been put to good use such as the Neuseway Nature Park that was created after the floods of the 1990s as seen in Figure 13 below. As seen in the image below, the land sits between two areas of the river, and is susceptible to flooding due to this and its lower elevation. The Figure 12: Sign in Kinston discouraging
people from dumping on a floodplain buyout property.
Page | 23
park includes trails, educational exhibits and programs, community pond for fishing and kayaking, a playground, campground, and a climbing wall (UNC-CH, n.d.). The land where the park sits has been flooded in every major storm since, though the park is built to withstand most flooding. This project shows the tremendous success that floodplain buyouts can have to the community as well as the reduced losses a property can have after it is converted to withstand flooding.
Figure 13: Location of the Neuseway Nature Park in Kinston, North Carolina Image Source: Google Images
One of the drawbacks to floodplain buyouts is the length of time that the process can take. In the case of Kinston, vulnerable residents had not fully recovered before there were faced with the prospect with one of the costliest storms in US history. Buyouts can take up to 18 months in some cases, and residents do not always have that time to wait before they will be threatened by another disaster (UNC-CH, n.d.).
Page | 24
6.1.4 Evaluation and Application to Princeville
Effectiveness: This policy will achieve the goal of hazard mitigation and is becoming more and more popular throughout the United States. As noted by Eric Tate in the Journal of the International Society for the Prevention and Mitigation of Natural Hazards, “voluntary property acquisitions are playing an increasingly prominent role in the aftermath of US flood disasters” (2016). Buyouts will remove the vulnerable populations from the inundated areas and move them into safer areas. This strategy is effective at removing the structures most at risk for future flooding. By assessing the most danger-prone areas, strategies can be developed to buyout and relocate residents to a safer area. In the case of buyouts, “recovery planning presents an opportunity to identify high-risk areas, begin a conversation with the community about buyouts as a possible mitigation measure, and evaluate the potential social, economic, and environmental impacts of a buyout program, before a crisis occurs” (Binder & Greer, 2016). Score: 4.5/5
Efficiency: This policy will be costly. However, the cost of moving houses now will be more cost effective than rebuilding after every disaster that continues to decimate the same area. In the long run, this solution will be more cost efficient than no strategy at all. Money spent on pre-disaster mitigation can save up to four times the cost in lower damages after a potential pre-disaster (Weiss, 2013). The fiscal impact of buyout programs is one of the “biggest factors weighed by local governments deciding whether to embrace or resist buyout programs. Incorporating financial considerations into the reuse of acquired properties and the relocation of residents is critical” (Freudenberg, Calvin, Tolkoff, & Brawley, 2016). Score 4/5
Flexibility: This policy could be applied relatively easily to Princeville, and to most anywhere around the county. Homeowners however would have to pay 25% of the cost, which may not be possible for all residents. Furthermore, the after-buyout process and decisions could be potentially burdensome for the local government as it currently stands. Score 3/5
Page | 25
Feasibility:
Legal: This process would be very easy to apply legally. It would, however, take some time to apply. This process averages about 2 years (James-Kavanaugh et al., 2017). Given the current trend for quick recurrence of storms, especially as seen in North Carolina in recent years, residents may not have the time required for this process as it currently stands.
Social: Town thought on this process is very important. Residents might not like the idea of moving from their family lands or fear social and neighborhood changes should they choose to move. This could create challenges for the town. History has shown that “past voluntary buyout programs have also generated resident feelings of coercion, degradation of trust, and loss of attachment to place” (Tate et al., 2016). A prevailing theory on buyouts currently holds that buyouts programs should be community-led as to try and best alleviate ill-will and ill-effects of buyouts on communities (Binder & Greer, 2016). Sherri Binder and Alex Greer of BrokoppBinder Research and Consulting and Oklahoma State University recommend that “implementing agencies prioritize the inclusion of community perspectives at all stages of the buyout process, including determining where buyouts are (and are not) implemented and developing viable alternatives with communities and households that reject buyouts” (Binder & Greer, 2016). Score 2.5/5
6.2 Valmeyer, Illinois – Town Relocation
6.2.1 Background
After weeks of incessant rain and heavy snowmelt, the Mississippi River began to overflow in the summer of 1993. During the
Great Flood of 1993, the town of Valmeyer, Illinois was completely inundated, not once, but twice in the span of a few weeks. As of 1996, it was the nation’s costliest flood ever, with 50 deaths and damage estimated at $12-$16 billion in the nine states that were affected.
Valmeyer, located in Monroe County, had a troubled history with flooding. The town flooded in 1910, 1943,
Page | 26
and in 1944. During the Great Flood, in Valmeyer 900 residents were flooded, under up to 20 feet of water when a series of levees upstream were overtopped and failed. Roughly “90 percent of Valmeyer's sturdy German farmhouses, modest bungalows and commercial buildings were deemed beyond repair by appraisers” (Brown, 1996). This damage can be seen in Figure 14. Some regard the magnitude of this flood as a 500-year event (Wiechert, 2018).
6.2.2 Mitigation
When approached for the first time by a regional planner Mayor Knobloch thought the idea of moving the town was a crazy idea. However, as damages from the disaster mounted, the idea was presented at a community meeting. After residents “overwhelmingly expressed their support for moving the town, the process began in haste” (Leonard, 2013). The town formed committees of residents to “tackle the logistics of building a new town” (Leonard, 2013). The residents involved in the planning process felt more connected to the project. Mayor Knobloch noted, “It kept them busy, and it gave them buy-in. This was their plan. They created it” (Leonard, 2013).
Rather than rebuilding the town in the same spot, the residents elected to move the town to higher ground. Valmeyer was “insuring the future in a different way, by moving residents out of harm's way – ‘changing the behavior of people instead of rivers,’ in the words of Bill Becker, an official with the Federal Department of Energy in Denver and adviser to Valmeyer” (Brown, 1996). The town also had the option to disperse or rebuild on 12-to 15-stilts, but the town voted to move to higher ground. The town was moved to a 500-acre site that at the time was home to a cornfield and farm animals located approximately two miles northeast of the old town (McCormick, 2003).
To afford the rebuilding process, Valmeyer families “relied on proceeds from the sale of their damaged homes to the Federal Emergency Management Agency, payments from national flood insurance -- if they had it -- Small Business Administration loans and their savings” (Brown, 1996). In 1996, it was reported that 15 families, whose homes were not completely destroyed, moved back into the floodplain determined to stay in the same area. The Chicago office of the Federal Emergency Management Agency referred to this as “flood amnesia” whereby people think they will never get flooded or wont flood again, but as FEMA notes, the floods will come again, because it is the cyclical nature of the river (McCormick, 2003). Residents who stayed believe a flood like the 1993 flood would not happen again for another 100 years. However, as past events have shown, this is not always the case.
Page | 27
Valmeyer’s heart” (Brown, 1996). Residents had been on this land for generations, and they intended to stay together. While they noted that buyout arrangements would have been cheaper, residents were not willing to put a price tag on their small town.
For two years following that event, the town residents lived in temporary housing and attending a temporary school while they built their new town, with the help of $35 million in Federal and state money. The town population dropped to about 600 in 2000, but was up to 800 in 2003, and 1,000 in 2008 (Horng, 2008). Today, the population of Valmeyer is over 1,200. The median household income is approximately $78,000 and the median resident age is 37.
6.2.3 Important Lessons
Valmeyer major at the time, Dennis Schreder, noted “the longer you wait to get people back in homes, the more likely they are to leave” (McCormick, 2003). This notion is important to understand in the rebuilding process, and raises questions about how quickly mitigation practices should be brought about. FEMA today includes Valmeyer in its “case studies of “best practices” and lauds the quick acquisition of flood-damaged properties” (Leonard, 2013). One of the things that contributed to the “successful relocation of Valmeyer was citizen involvement” (Knobloch, 2005).
As Valmeyer has shown, it is important for residents and the town to work together to accomplish mitigation quickly after a disaster. While it might have seemed daunting, the residents were able to work together, to express their ideas, and rebuild their town with their preferences in mind. For the residents of Valmeyer, moving the town gave them the opportunity to rebuild and spawned growth (Wiechert, 2018). Rebuilding gave them the opportunity to move on from the disaster, and to spawn new growth into the future.
Figure 15: Valmeyer Municipal Boundary Pre and Post-Relocation
Page | 28
6.2.4 Evaluation and Application to Princeville
Effectiveness: As stated by David King of the Centre for Disaster Studies at James Cook University, “mitigation out of hazard-prone areas presents significant opportunities for disaster risk reduction and climate change adaptation” (2014). Town relocation, away from the flood zones and the Tar River, would relocate the vulnerable populations into safer areas. Score: 4.5/5
Efficiency: This policy will be costly up front, but in the long run it will pay off to be in a safer, less flood prone area. Residents, the town, the state, and the federal government would not spend money year after year to rebuild the same town and the same repetitive loss properties. In Arnold, Missouri, also damaged during the 1993 flood, the town saw significantly lower costs a few years later when it was struck by a flood again, due to its decision to relocate as well. “The recognition of the problem and its extent, and development of plans to solve the problem, prepared the city to respond to the 1993 floods with a long-term solution for mitigating against future flood damages” (Laub, 1997). To give context to these statements, after the 1993 flood Arnold was granted over $2 million in Federal disaster resistance, but in 1995 (after their move), the required less than $40,000 (Laub, 1997). Score 4/5
Flexibility: The process of deciding to relocate is one of “weighing up the risks, costs and benefits, not only in an economic, but social and lifestyle senses as well. These are complex issues, which play out differently at different locations” (King, Haynes, Boon, Cottrell, Millar, & Thomas, 2014). In the context of Princeville, the residents would take up issue with leaving their historic, ancestral land. This would create tension with the relocation program, and could potentially prevent it from occurring at all. Score 3/5
Equity: All residents at risk in the town of Princeville would be eligible for the program, however, like the buyouts seen above, not all residents will be able to easily afford this option. However, with federal and state assistance, this may be a more economically sustainable project, as seen in the case of Valmeyer. Score 3/5
Feasibility:
Page | 29
impossible to complete this project, but these funds came wrapped in plenty of red tape” (Knobloch, 2005). Princeville would have to take this information into consideration should they chose this policy option.
Social: In the case of Valmeyer, the residents showed that if they came together to formulate and carried out a plan, they could put their goals together, and quickly. In the case of Princeville, which has been threatened and inundated with many storms throughout the past few decades, residents may be willing to adopt this policy to escape the relentless devastation they are fearful will come again. This would be hard for some members of the community; however, it may be their only remaining option. Score: 3/5
6.3 Weymouth, Massachusetts – Home Elevation
6.3.1 Background
Located in Norfolk County, Massachusetts, Weymouth has a population of approximately 55,000. However, the population of the effected and vulnerable area of town is just shy of 4,000. Located adjacent to Weymouth Fore River and Hingham Bay, Weymouth is susceptible to flood events, especially on its coast. In the past, parts of the coastal area have become inundated by water, most of these homes in the 100-year floodplain (Weymouth, 2018).
6.3.2 Mitigation
After flooding along the coast, the town developed a Home Elevation
Grant Program to assist residents in applying for Hazard Mitigation Grant Program (HMGP) funding. These grants are used to raise resident’s homes above the Base Flood Elevation in the 100-year floodplain to eliminate the risks of flooding. The HMPG “provides funding for cost-effective home elevations that are designed and constructed to meet or exceed the American
Page | 30
Society of Civil Engineers’ Standards for Flood Resistant Design and Construction” (Weymouth, 2018). The areas in this city that will need to be elevated are in Zone V and Zone A.
Figure 17: The study are of Weymouth, Massachusetts in 2013 before the elevation of homes Image Source: Google Maps
The program is a reimbursement grant program, with a reimbursement rate of 75%, meaning that the homeowner will have to pay at least 25% of the total project cost. Application for the program was strictly voluntary. Once the applicant applies, the town reviews the application, then the state reviews it, and then it undergoes federal review. As noted on the city of Weymouth’s website, FEMA is “under no statutory time limit to make a decision. It may be months or years before FEMA provides final approval for a HMGP application” (Weymouth, 2018).
Page | 31
Figure 18: Before and after elevating houses in Weymouth, Massachusetts. Image Source: Town of Weymouth. (n.d.)
Noted in 2018, if homeowners who did not live in the floodplain but suffered damage from the nor’easter needed assistance with the program, they were welcome to apply for a low interest local from the federal Small Business Administration (Baker, 2018). This program was first given in 2015, and opened again in 2018 after a nor’easter affected the area. During the course of this study, I could not find an accurate count of the homes that have taken advantage of this mitigation action. However, in total, there are approximately 40-50 homes that meet the criteria.
6.3.3 Lessons Learned
Page | 32
Home elevation projects also pose a number of challenges. One large challenge is the cost that citizens will have to pay to have their homes elevated, as 25% at least will have to be paid by them. Another challenge that homeowners face is the accessibility of these raised structures. Regarding natural disasters, the older the population of a town, the less likely they are to be able-bodied and therefore less able to navigate elevated housing (HMDRRI, 2017).
6.3.4 Application to Princeville
Effectiveness: While this strategy removes structures immediately from the path of danger, such as flood water, the structures still remain in the same location. If the storms were to produce enough rainfall or storm surge to elevate water drastically, these structures could theoretically no longer be safe. In the short run, this solution is very effective. However, due to climate change, this strategy too may need to be adapted in the future once again. On the other hand, some may regard this strategy as very attractive, “by individuals who place a considerable value on reducing risk to zero, which has been suggested by the certainty effect” (Botzen, Aerts, & Van den Bergh, 2013).
Efficiency: 75% of the funding can be provided by a grant program, however residents would have to pay 25% of expenses. The program would pay out in the long run; however, it will be net costly for residents in the beginning. This is especially troubling given the trend that homeowners rarely undertake damage mitigation voluntarily (Kunreuther & Michel-Kerjan, 2011). However, a comparable study conducted in the Netherlands found that “a comparison of an indicator of the willingness to pay (WTP) for elevation and WTP for flood insurance indicates that individuals place a considerable premium on eliminating the risk completely, instead of purchasing only financial protection against the risk or investing in measures that only partly reduce damage” (Botzen et al., 2013). Score 2.5/5
Flexibility: Given the river’s varying heights during the recent storms, and the unpredictability of water in the future, it would be hard to decide on a safe elevation for many structures that would be rebuilt in the floodplain. Score: 2/5
Page | 33
Feasibility:
Legal: With assistance from FEMA, this program is possible. As noted above, the process would be strictly voluntary. Town officials would be somewhat likely to support this proposal as it would keep the tax base of the town where it is currently, while also preserving culture. The decision to “invest in elevating homes is significantly correlated with the expected negative effects of climate change, perceptions of flood risks, individual risk attitudes, and living close to a main river” (Botzen et al., 2013).
Page | 34
7. Results
Based on the analysis above, this paper recommends that the town of Princeville be relocated to safer ground, as seen in the case study of Valmeyer. If full town relocation is not possible, the most vulnerable areas in the current town should be moved nearby. These areas would include those located in the current 100-year floodplain, followed by the structures in the 500-year floodplain. The old town would remain as dedicated open space, such as seen in Kinston with the Neuseway Nature Center.
The old town locations could be turned into a nature park, cultural center, or used for other purposes that help to further strengthen the resident’s connection with the old town. Overall, relocation of the most vulnerable structures would help the town of Princeville to expand their borders to “places less vulnerable, at the same time respecting the significant deep history of Princeville” (WRAL, 2017). After the most vulnerable are moved within the new town limits, focus can be placed on moving the other vulnerable areas to safer ground.
During the 5-day workshop in 2017, the town discussed the idea of utilizing a nearby 52-acre site. While this site could not contain the entire current town of Prineville as it currently is, it could start with the most vulnerable structures. After this step has begun, the town could look to expand, such as to the projected 100-acre expansion noted above (WRAL, 2017). Should the town want to move forward with this idea, there are next steps that they should take, and quickly.
First and foremost, the new
land will have to be annexed and purchased. Residents will then have to work with the Town to Figure 19: Proposed annex of the town
Page | 35
draft and agree on the design and vision for the new land. Raised in the previous workshop, prioritizing historical significance, preservation, and recovery needs to be prioritized. This could be done through community engagement meetings, design workshops, and other engagement tools that would take the residents and their voices into account. The last workshop included experts on African-American history and culture as well as the Environmental Protection Agency. It is important to hear from all of these sources, as “local cultural context is important”, especially when rebuilding a town like Princeville (Cohen, 2017). FEMA notes that, “Partnerships and collaboration across groups, sectors and governments promote a successful recovery process. Partnerships and inclusiveness are vital for ensuring that all voices are heard from all parties involved in disaster recovery and that all available resources are brought to the table” (FEMA, 2011).
Moving the town would separate the immediate land ties, however, steps can be taken to preserve community heritage, social ties, and Princeville’s history. If citizens so desired, they could create structurally mitigated museum(s) in the old town that residents and tourists to the area could visit in order to retain the history of the area and keep its legacy alive. These structures could be built to withstand flooding. Other uses could be converting the open spaces to dedicated town spaces for recreation and other like uses. These spaces could benefit the town both socially and financially.
In all of this, the element of time needs to be considered, “time is the number one problem encountered after following a flood disaster” (Knobloch, 2005). As seen in Valmeyer, citizens can come together to enact change, and quickly in the manner that they desire. Making the decision to move and rebuild Valmeyer gave the citizens the opportunity to rebuild and spawned growth for the town (Wiechert, 2018). It is imperative the Princeville begin the rebuilding process before the town is hit by potentially another disaster.
Page | 36
7.1 Assessment
To assess the buyout and movement process of the town, success markers can be adopted. Measuring and “communicating the progress of recovery increases public confidence in the recovery process by promoting transparency, accountability and efficiency” (FEMA, 2011). The “recovery progress serves as a tracking mechanism for improving and adjusting recovery strategies and activities and ensuring continuing improvement” (FEMA, 2011).
Citizens and the town of Princeville will have to work together with planners, hazard specialist, and other groups to come up with realistic, tangible goals of success for Princeville’s rebuilding process. A successful recovery is about the “ability of individuals and families to rebound from their losses in a manner that sustains their physical, emotional, social and economic well-being” (FEMA, 2011). However, each community defines “successful recovery outcomes differently based on its circumstances, challenges, recovery vision and priorities” (FEMA, 2011).
The success markers for Princeville could include things such as:
• 50% of structures moved out of the 100-year floodplain in 2 years
• 100% of structures moved out of the 100-year floodplain in 7 years
• 50% of the structures moved out of 500-year floodplain in 10 years.
• 80% resident retention 5 years.
• 2 cultural sites and centers built within 10 years
Strategies for success measures are good in so far as they are monitored and maintained. FEMA notes that successful recovery ensures “continuous improvement by evaluating the effectiveness of recovery activities” (FEMA, 2011). Committees should be established to assess recovery and the success markers at designated time intervals to try and ensure success and accountability.
Page | 37
8. Discussion
8.1 Data Limitations
In order to properly mitigate, planners need access to accurate data. Without this data, it will be very challenging to mitigate effectively against future storms. NCFIMAN, the North Carolina Flood Inundation Mapping and Alert Network provides real time views of river gauges as well as scenario forecasts. When the scenario is raised to 36.2 feet, the height of the river in 2016 during Hurricane Matthew when the town was inundated, and the scenario does not show the town as flooded. In fact, the scenario does not have the town completely flooded until just below 40 feet. This can be seen in the figures below. The historic crests of the gauge can be seen in the table below.
Table 2: Historic Crests of the Tar River at Tarboro. Data Source: NOAA
Crest Date Associated Storm
41.51 Feet 9/19/1999 Hurricane Floyd
36.29 Feet 10/13/2016 Hurricane Matthew
Page | 38
Figure 21: Scenario Inundation of the Tar River at approximately 39 feet. Source: NCFIMAN
The scenario inundation also considers buildings, and their associated damages, in the scenario calculations. When the scenario is brought to the height of Hurricane Matthew’s associated crest, the following table can be seen (Figure 22). Given the damaged experienced in Hurricane Matthew at this crest, this scenario data provided is wrong and misleading. After the 2016 events, more than 500 structures in the town were damaged, with estimated damage at $28,199,911 (ESP Associates, 2018). This figure is very different from the scenario prediction of $2,389,000 seen to the right.
Page | 39
8.2 Time Constraints
One of the core principles that guide recovery is timeliness and flexibility. As noted by FEMA, “A successful recovery process upholds the value of timeliness and flexibility in coordinating and efficiently conducting recovery activities and delivering assistance” (FEMA, 2011). The recovery process also “strategically sequences recovery decisions and promotes coordination; addresses potential conflicts; builds confidence and ownership of the recovery process among all
stakeholders; and ensures recovery plans, programs, policies and practices are adaptable to meet unforeseen, unmet and evolving recovery needs” (FEMA, 2011). The timeline for disaster recovery included in the National Disaster Recovery Framework is located in the appendix, in Figure 23.
The timeline for mitigation will be different depending on the risks associated in each community. As stated by the Union of Concerned Scientists, “For communities facing chronic flooding of properties in the near term, it is imperative to act quickly to phase out policies that perpetuate and increase risk, while considering options for retreat from the highest-risk places” (2018). In other areas, “a slightly longer time horizon might allow for more creative solutions and comprehensive policies and planning” (UCS, 2018). Together as a nation, we have a “narrowing window of opportunity to make better choices and ameliorate risks” (UCS, 2018).
Adequate time and consideration is not always given to post-disaster recovery. Often “time pressure to complete post-disaster housing projects in order to restore normalcy as soon as possible…Disaster victims may give less priority to participatory mechanisms in the immediate aftermath of disasters, when they are still focused on survival, post-disaster trauma, and grieving for their losses” (Ganapati & Ganapati, 2008). Towns should work together with residents to ensure participatory pre and post disaster mitigation strategies.
Valmeyer showed that it is possible to plan, develop, and execute mitigation measures in a relatively quick manner. Valmeyer is included in FEMA’s case studies of “best practices” and “lauds the quick acquisition of flood-damaged properties” and other towns should use it as a prime example of timely recovery (Leonard, 2013). Other mitigation strategies, such as buyouts, can take up to 18-months to complete. This is due to the process that each property must go through to complete the buyout (UNC-CH, n.d.).
Page | 40
9. Concluding Thoughts
Evidence suggests that as a whole, the climate is changing and weather is becoming more extreme. Hurricanes are becoming bigger, stronger, and overall pose a greater threat. Hurricanes, and other storms, are also posing threats to new areas, such as inland areas. Citizens, cities, and the Federal Government will face new challenges in the light of these changing storms. Together, we face challenges not only preparing for storms, but in also how we respond to them and recover from them.
The recovery process offers us a unique opportunity to better mitigate cities, towns, and even entire states to be better prepared for future events. In learning from the past, we can take that knowledge and use it to build a more resilient future. Communities are different in size, composition, cultural history, and other factors. Planners need to take that into account when planning for hazard mitigation. As seen in the case of Princeville, cultural history is very important, and that needs to be taken into account during the recovery process. Planning now, before another event, provides an opportunity for valued community involvement and feedback. Citizens can work together with planners, members of the town, and other group to create their ideal resilient community.
Page | 41
References
American Community Survey (2017). US Demography. Social Explorer.
Baker, E. (2018). Weymouth Homeowners Get FEMA Grant To Elevate Flood Prone Homes. Wicked Local – Weymouth. https://weymouth.wickedlocal.com/news/20180510/weymouth-homeowners-get-fema-grant-to-elevate-flood-prone-homes
Bales, J., Oblinger, C. J., & Sallenger, A. H. (2000). Two months of flooding in eastern North Carolina, September-October 1999: Hydrologic, water quality, and geologic effects of
hurricanes Dennis, Floyd, and Irene (No. 4093). US Department of the Interior, US Geological Survey.
Barnes, J. (2013). North Carolina's Hurricane History: Updated with a Decade of New Storms
from Isabel to Sandy. UNC Press Books.
Bidgood, Jess. (2017). North Carolina, Still Reeling From Hurricane Matthew, Stares at Irma. The New York Times.
Bin, O., & Polasky, S. (2004). Effects of flood hazards on property values: evidence before and after Hurricane Floyd. Land Economics, 80(4), 490-500.
Binder, S. B., & Greer, A. (2016). The devil is in the details: Linking home buyout policy, practice, and experience after hurricane Sandy. Politics and Governance, 4(4), 97-106.
Blythe, A. (2016). Princeville residents get first look at flooded homes. News Observer.
Botzen, W. J. W., Aerts, J. C. J. H., & Van den Bergh, J. C. J. M. (2013). Individual preferences for reducing flood risk to near zero through elevation. Mitigation and Adaptation Strategies for
Global Change, 18(2), 229-244.
Bowman, B. (1999). Princeville Opts to Rebuild Dike Instead of Federal Buyout. WRAL.
Brown, P. (1996). Higher and Drier, Illinois Town is Reborn. The New York Times.
Chapman, D. (2002). Flood-ravaged Princeville going it alone. Baltimore Sun.
Coastal Resilience Center. (2017). Princeville Design Workshop.
Cohen, J. (2017). In This N.C. Town, a Model for Rebuilding Is Taking Shape. Next City
Page | 42
C2ES. (2018). Hurricanes and Climate Change. Center for Climate and Energy Solutions.
Denchak, M. (2017). Global Climate Change: What you need to know. NRDC.
Douglas, I. (1988). Urban planning policies for physical constraints and environmental change. Geomorphology in Environmental Planning, 63-86.
Emanuel, K., Sundararajan, R., & Williams, J. (2008). Hurricanes and global warming: Results
from downscaling IPCC AR4 simulations. Bulletin of the American Meteorological Society, 89(3),
347-368.
ESP Associates Inc. (2018). Tar River Basin Flood Analysis and Mitigation Strategies Study. Emergency Management of North Carolina.
FEMA. (2000). FEMA and North Carolina Announce Historic Agreement to Reduce Damage from Future Floods.
FEMA. (2000). Innovative Floodplain Management. Learn NC
FEMA. (2002). After Floyd—North Carolina Progress. Washington, D.C.: Federal Emergency Management Agency
FEMA. (2011). National disaster recovery framework—Strengthening disaster recovery for the nation.
FEMA. (2018). What is mitigation?
FEMA. (n.d.) Phases of Emergency Management. Washington, D.C.: Federal Emergency Management Agency
Freudenberg, R., Calvin, E., Tolkoff, L., & Brawley, D. (2016). Buy-in for buyouts: The case for
managed retreat from flood zones. Lincoln Institute of Land Policy.
Ganapati, N. E., & Ganapati, S. (2008). Enabling participatory planning after disasters: A case study of the World Bank's housing reconstruction in Turkey. Journal of the American Planning
Association, 75(1), 41-59.
Godschalk, D. R. (2003). Urban hazard mitigation: creating resilient cities. Natural hazards
review, 4(3), 136-143.
Herring, D. (2000). Hurricane Floyd's Lasting Legacy. NASA.