RESEARCH PAPER
S t r u c t u r e - B a s e d P r e d i c t i o n o f A n t i - i n f e c t i v e D r u g
Concentrations in the Human Lung Epithelial Lining Fluid
Pyry A. J. Välitalo1& Koen Griffioen1& Matthew L. Rizk2& Sandra A. G. Visser2& Meindert Danhof1& Gaori Rao3&
Piet H. van der Graaf1& J. G. Coen van Hasselt1
Received: 26 March 2015 / Accepted: 18 November 2015 / Published online: 1 December 2015 #The Author(s) 2015This article is published with open access at SpringerLink.com
ABSTRACT
Purpose Obtaining pharmacologically relevant exposure levels of antibiotics in the epithelial lining fluid (ELF) is of critical importance to ensure optimal treatment of lung infec-tions. Our objectives were to develop a model for the predic-tion of the ELF-plasma concentrapredic-tion ratio (EPR) of antibi-otics based on their chemical structure descriptors (CSDs). Methods EPR data was obtained by aggregating ELF and plas-ma concentrations from historical clinical studies investigating antibiotics and associated agents. An elastic net regularized re-gression model was used to predict EPRs based on a large num-ber of CSDs. The model was tuned using leave-one-drug-out cross validation, and the predictions were further evaluated using a test dataset.
Results EPR data of 56 unique compounds was included. A high degree of variability in EPRs both between- and within drugs was apparent. No trends related to study design or pharmacokinetic factors could be identified. The model pre-dicted 80% of the within-drug variability (R2WDV) and 78.6% of drugs were within 3-fold difference from the observations. Key CSDs were related to molecular size and lipophilicity. When predicting EPRs for a test dataset the R2WDVwas 75%. ConclusionsThis model is of relevance to inform dose selec-tion and optimizaselec-tion during antibiotic drug development of agents targeting lung infections.
KEY WORDS
antibiotics . elastic net . epithelial lining fluid . lung infection . machine learning . modeling . pharmacokinetics . pneumoniaABBREVIATIONS
ELF Epithelial lining fluidEPR ELF/plasma concentration ratio LOOCV Leave-one-drug-out cross validation WDV Within-drug variability
INTRODUCTION
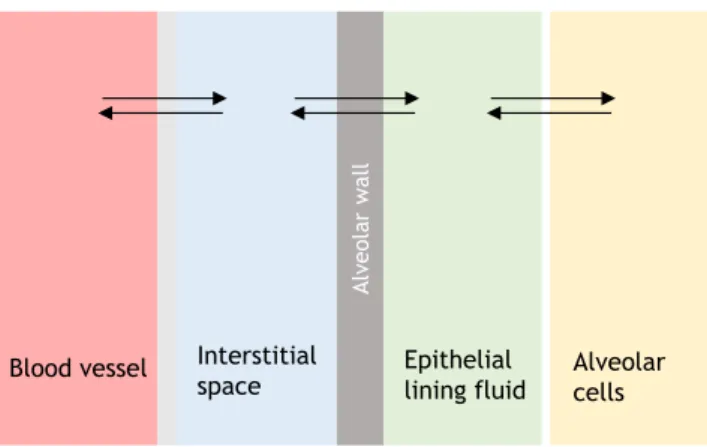
Hospital- or ventilator acquired pneumonia (HAP, VAP) is associated with a high mortality (1). Therefore, reaching effi-cacious effect-site concentrations of antibiotics is essential for successful treatment (2) and to suppress the emergence of re-sistance (3,4). For the majority of lung infections, the site of infection is the epithelial lining fluid (ELF). In order to reach the ELF, antibiotics needs to pass from the lung capillary into the interstitial space and subsequently move across the alveo-lar wall epithelium (Fig.1). The alveolar membrane acts as a semi-permeable barrier due to the presence of tight junctions (5) and the presence of drug transporter proteins (6). This results in ELF concentrations that may be several folds lower or higher than the corresponding plasma concentration, as was nicely summarized by Kiemet al.(7) and Rodvoldet al. (8). Therefore, the consideration of ELF concentrations dur-ing development of antibiotic agents for lung infections is of considerable importance.
The quantification of antibiotic concentrations in ELF is challenging. Bronchoalveolar lavage (BAL) is currently the most frequently used procedure (9) for such measurements. Limitations of this procedure include the indirect method of quantifying drug concentrations, the burden for volunteers due to its invasive nature, and the possibility of obtaining only single time-point samples among additional methodological
Electronic supplementary material The online version of this article (doi:10.1007/s11095-015-1832-x) contains supplementary material, which is available to authorized users.
* J. G. Coen van Hasselt [email protected]
1
Division of Pharmacology, Cluster Systems Pharmacology, Leiden Academic Centre for Drug Research (LACDR), Faculty of Science, Leiden University, Einsteinweg 55, 2333 CC Leiden, Netherlands
2
Merck & Co. Inc., Kenilworth, New Jersey, USA
limitations (10). A more recent and promising technique for m e a s u r i n g E L F c o n c e n t r a t i o n s i s b r o n c h o s c o p i c microsampling (BMS), which allows for repeated measure-ment of concentrations over time (11). Considerable variabil-ity has been reported for ELF concentrations not only be-tween subjects but also within subjects (7,8). Such variation can be related to the aforementioned methodological issues, the drug-distribution related pharmacokinetics (PK), and po-tentially other physiological disease related factors such as edema and potential effects of inflammation on membrane permeability.
Although conducting lung PK studies is currently the stan-dard for evaluating pulmonary exposure of antibiotics,in silico approaches to predict partitioning of antibiotics into the ELF space based on chemical structure properties would be of considerable relevance. Such predictive models could either inform or replace the design of complex and burdensome clinical lung PK studies. As such, predictive models can sup-port clinical dose selection studies.
The prediction of various PK properties including the pre-diction of partition coefficients into various tissues is an important and widely explored field. Indeed, previously developed models allow prediction of such partition coefficients in various tissues (12,13) based on both drug-specific physico-chemical properties, and system-drug-specific properties related to, for instance, tissue composition (14,15). However, when there is a gap in knowledge of active transport processes, such as for the alveolar barrier or the blood-brain barrier, these approaches provide poor predictions. In such cases, data-driven approaches can be useful, because strong mechanistic understanding is not required for these ap-proaches. The relevance of such empirical, data-driven modeling for predicting partitioning into the blood-brain bar-rier has already been widely demonstrated (13,16–19).
Data-driven models for drug distribution aim to relate drug-specific chemical properties derived from their structure to the PK property of interest, and may be referred to as
quantitative structure-property relationship (QSPR) models. These chemical descriptors are either properties directly de-rived from the molecular structure, e.g. number of nitrogen atoms, or, properties like log P that can be predicted using well-established equations. Subsequently, statistical modelling approaches can be applied to construct predictive models that associate these chemical descriptors to the PK property of interest.
Predictive QSPR models have often been based on ordinary least squares based linear regression modeling. However, such approaches deal poorly with the large number of highly correlated chemical descriptors. More-over, in many cases, the predictors outnumber the ob-servations, which leads to over-fitting and poor general-izability. One important statistical modeling approach that addresses this limitation by imposing a penalty on the size of coefficients is the penalized regularized gression modelling approach implemented by ridge re-gression and lasso rere-gression, which use the λ1 and λ2 penalties, respectively. Both λ1 and λ2 are shrinkage methods that aim to prevent over-parametrization due to correlations of predictors by shrinking regression co-efficients to zero. While the λ1 penalty encourages re-gression coefficients becoming zero (i.e. variable selec-tion), the λ2 penalty encourages highly correlated vari-ables to have similar regression coefficients (i.e. group-ing), resulting in small but non-zero coefficients. Anoth-er regression method is the partial least squares regres-sion (20). Partial least squares regresregres-sion and ridge re-gression behave similarly, except that ridge rere-gression can be considered slightly more flexible, and therefore more powerful (20). More recently, elastic net regression has been proposed as a linear combination of the λ1 and λ2 penalties, as such combining lasso and ridge regression, Here, the total amount of shrinkage is deter-mined by both, λ1 and λ2. Their values can be tuned using various methods such the bootstrap or cross vali-dation methods. Often, the lasso regression penalty λ1 is parameterized by swhich is the fraction of the L1-norm of the penalized coefficient vector over the unpenalized coefficient vector, bounded between 0 and 1. A higher value of s reflects a lower λ1 penalty, since the sum of t h e a b s o l u t e c o e f f i c i e n t v a l u e s i s c l o s e r t o i t s unpenalized maximum. Setting λ2 to 0 performs lasso regression whereas setting s to 1 performs ridge regression.
The objective of this paper is to develop a QSPR model for structure-based prediction of elastic net EPRs of anti-infective agents and associated agents (e.g. β-lactamase inhibitors) based on literature reported values for lung and plasma drug concentrations. The developed model can be used to provide quantitative understanding of effective site concentrations for antibiotic drug development targeting lung infections.
MATERIALS AND METHODS
This analysis was performed as follows: i) original publications reporting ELF concentrations were collected and relevant da-ta was extracted; ii) an exploratory analysis of the EPRs was performed evaluating the effect of various factors not related to chemical descriptors; iii) an elastic net model was trained based on the chemical descriptors of identified antibiotics and associated drugs; iv) the optimal model was evaluated using a test dataset not used for model development.
Data Collection, Extraction and Curation Procedure
The model training dataset was based on two previously re-ported systematic reviews of clinical studies quantifying con-centrations of anti-infective agents (antibiotics, antifungals and associated agents such asβ-lactamase inhibitors) in plasma and ELF (7,8). The original publications included in these two systematic reviews were considered to represent a com-plete overview of available literature on ELF lung concentra-tions reported for anti-infective agents up to 2011. Potentially the training dataset could have been extended slightly further by searching for studies of drugs that were not used for the treatment of lung infections. However, we had some concerns about including compounds that are structurally completely different as this could introduce bias to the predictions of EPRs of anti-infective agents; the primary application area of the model. Therefore no other unrelated agents were in-cluded in the model training dataset.
The external model evaluation dataset was based on: i) the results of a lung PK study for imipenem and MK-7655 that included contributions from some of the co-authors contrib-uted (21) and ii) additional lung PK studies of anti-infective agents identified in the literature for the period between 2011 and 2014 and which were not already included in the training dataset. The following PubMed search query was used to identify additional relevant studies: (ELF orBepithelial lining fluid^) and antibiotic and (B2011/10/08^[PDat] :B2015/01/ 01^[PDat]) NOT (murine or mice) NOT Review[ptyp] NOT
Bin vitro^.
The extraction of data from the original publications (7,8) proceeded as follows. First, all individual publications from literature were systematically retrieved. Subsequently, we col-lected the following data for each paper: i) individual or mean paired concentrations or AUC values for plasma and ELF; ii) the method of measurement of lung concentrations (e.g. BAL or BMS); iii) details of the study design (dose, time of measure-ment, route of administration); iv) measurement of either total or unbound drug concentration; v) disease state of the subject (healthy volunteer, patient with lung-disease, patient without lung-disease); vi) the number of subjects on which the ELF/ plasma observations were based. In all cases, individual obser-vations were used if available.
The plasma and ELF concentration data included concen-trations that were below the lower limit of quantification (LLOQ). Different scenarios were identified for either the plasma or the ELF observations, or both, being below LLOQ. First, if both the plasma and ELF concentrations were below LLOQ, then the observations were omitted from the analysis. Second, if only either the plasma or the ELF concentration was below the LLOQ, then LLOQ/4 was imputed for the missing concentration, because LLOQ/4 was chosen as con-servative estimate of the concentration which was expected to be closer to zero than to LLOQ. Third, if only either the plasma or the ELF concentration was below the LLOQ and the LLOQ was unknown for that study, then an LLOQ of 0.1 mg/L was assumed and LLOQ/4 was imputed for the missing concentration. The value of 0.1 mg/L was considered as a realistically low value based on the observed distribution of concentrations. We evaluated the impact of this imputation strategy by training models based on the data without LLOQ and with LLOQ imputation and using both models for pre-diction within the same dataset, which featured only above-LLOQ data. The impact of above-LLOQ imputation was quantified in terms of RMSE. If the RMSE would be significantly higher for the model with LLOQ imputation than for the model with LLOQ exclusion, it would be an indication that LLOQ im-putation biases the above-LLOQ predictions.
Plasma concentrations that were reported as total concen-trations were converted to the unbound concentration by mul-tiplication with their fraction unbound, which was obtained for the majority of drugs from the DrugBank database (22). For the ELF concentrations we assumed that protein binding plays a negligible role since protein concentrations in the ELF are much lower than in plasma (23). an assumption also made by other investigators (7).
After this curation procedure we calculated the EPRs, which were subsequently transformed using the natural loga-rithm in order to obtain a more symmetric distribution of the ratios suitable for regression analysis.
Generation of Chemical Descriptors
Exploratory Analysis of Lung Concentrations
Visualizations were generated to assess the change in EPRs in relation to disease state (healthy, patient with lung disease, patient without lung disease), steady state PK, and in relation with the time after dose.
Development and Evaluation of Elastic Net Model
R (version 3.1.2) was used to perform all data manipulations and visualization. The R package elasticnet (27) together with the machine learning wrapper package caret were used to fit the elastic net models (28).
The dataset included both individual measurements and mean values. If individual values were reported we included these in the dataset. If however only mean values were report-ed, i.e. based on data obtained from several patients at one time point, we included these values instead. To account for the difference between either single individual observations or single mean observations, weighting based on the number of observations available was implemented.
The optimal tuning parameters of the elastic net model (s andλ) were determined using an adapted version of the leave-one-out cross validation (LOOCV). In this adapted version of LOOCV, all data for one drug are iteratively removed from the dataset and subsequently an elastic net model is fit on the remaining data and subsequently the ELF/plasma ratio was predicted for the left-out drug. This process was repeated for all combinations ofλ2={0, 1e-04, 1e-03, 5e-03, 1e-02, 5e-02, 1e-01, 2.5e-01, 5e-01} ands={1e-04, 1e-03, 1e-02, 0.0001, 0.001, 0.01, 0.05, 0.10, 0.15, (..), 1.00}. The RMSE of the individually observedversustypical predicted ELF/plasma ra-tios obtained after cross-validation for each set of tuning pa-rameters was computed. The set of tuning papa-rameters with the lowest RMSE was selected to fit the full dataset using the elastic net model.
Since the elastic net model only considered chemical de-scriptors, within-drug variability (WDV) related to other fac-tors cannot be predicted. Thus, a theoretical upper limit (low-er than 1) for the R2, i.e. the R2limcan be defined as follows:
R2lim¼cor Cobs;mean;a;Cobs;i;a
2
whereCobs,i,ais theith observation of theath drug andCobs,mean,a
is the mean observation forath drug. Subsequently the WDV corrected R2(R2WDV) was defined as follows:
R2W DV ¼cor mean Cobs;i;a
;Cpred;a
2
R2lim
whereCpred,ais the prediction of theath drug. Here, R2WDV thus represents the proportion of between-drug variability that can be predicted.
Using the trained elastic net model we predicted the EPRs for the test dataset and computed the RMSE and R2values of the obtained predictions. The relative importance of the de-scriptors was calculated by sequentially fitting a linear model to the observed EPR data, for each of the predictors. From these models, the statistical significances of the slopes being different from zero were calculated for each of the predictors, and scaled between 0 and 100 so that the maximum value of 100 signifies the strongest statistical significance between the descriptor and EPR.
Finally, to assess the appropriateness of the rcdk descrip-tors, we repeated this modeling procedure for another set of descriptors computed by the open source software PaDEL-descriptor (29). Descriptors that had equal values, a correla-tion of 1, or had only 2 unique values were removed from the descriptor dataset. Descriptors with only 2 unique values were removed to support the leave-one-drug out cross validation. Additionally, any descriptors that were included in the final list of rcdk descriptors were removed from the PaDEL set of de-scriptors, so that the PaDEL descriptor set would be maximal-ly different from the rcdk descriptor set.
RESULTS
Data Collection, Extraction and Curation
Briefly, for EPRs, the dataset included 56 unique antibi-otics or related drugs (e.g. β-lactamase inhibitors) with 672 actual observations (639 excluding LLOQ observations). These observations were associated with 1981 underlying paired observations, i.e. when considering mean values based on several individual observations. A total of 97 different studies were included. A more detailed overview of dataset composition and original references is provided in Table S1 and a table of the raw log-transformed EPR values is provided as Table S2. For the test dataset which was used for model evaluation we identified 5 drugs not included in the training dataset including imipenem (21). MK-7655, a beta-lactamase inhibitor (21). arbekacin (30). GSK2251052 (31) and tedizolid (32).
Of all concentrations in the training dataset, 4 and 13.5% of respectively plasma and ELF concentrations were either not measured or were LLOQ values. For missing ELF concentra-tions, 34% of the data also had missing plasma concentrations and were therefore not included in the analysis. There were no instances of plasma concentrations and ELF concentra-tions at the same time being above LLOQ. For the test dataset there were no missing or LLOQ observations.
correlated descriptors. An overview of the chemical structures of the 56 antibiotics for which these descriptors were derived is provided in FigureS1. For the set of PaDEL descriptors, 919 descriptors were used, none of which were included in the aforementioned 145 rcdk descriptors.
Exploratory Analysis
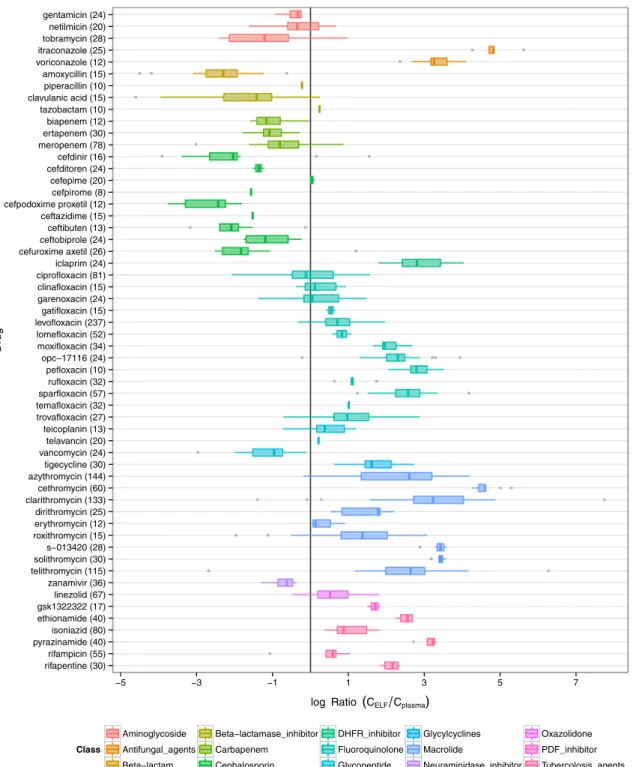
First we evaluated the distribution of observed EPRs in the training dataset as depicted in Fig.3, stratifying by antibiotic class. From this figure the large within and between antibiotic variability in EPR ratios becomes clear. Some grouping ac-cording to class (in color) was observed.
The effect of disease state on EPRs was explored for a subset of antibiotics (n=11) where ratios in more than one disease states was available (Fig.4, top). Although differences between disease states for different antibiotics are apparent, no clear consistent trend was found.
Regarding pharmacokinetic factors affecting EPR, we re-corded the steady state situation. Here, we distinguished be-tween studies involving a single administration (i.e. not reaching steady state), or, if repeated dosing or a prolonged infusion was used (i.e. steady state can be assumed). In this case the EPRs are expected to have reached a state of equilibration and hence closer to their true partition coefficient. Again for 11 antibiotics we identified studies where both steady state and non-steady state studies were available. Although for a few cases, as may be expected, an increased EPR was found for
steady state (rifampicin, clarithromycin), this trend was not consistent across the different antibiotics. (Fig.4, bottom).
Finally we explored the effect of time of measurement after dosing while stratifying across steady state or non-steady state conditions, if available (FigureS2). Also here, theoretically, trends were expected of increasing ratio’s over time, but were not clearly observed.
Model Development
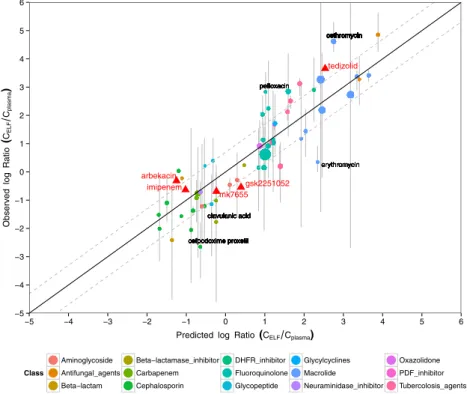
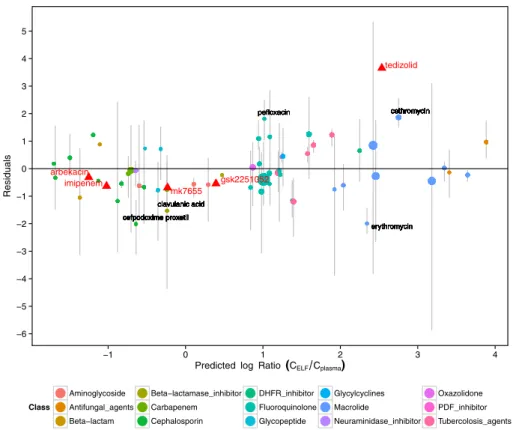
First the optimal set of tuning parameters for the elastic net model was identified based on the lowest RMSE value iden-tified after leave-one-drug-out cross validation (LOOCV) (Fig. 5). The optimal LOOCV metrics were RMSE 1.36 and R2WDVwas 0.54 (TableII). The numbers are more prone to fluctuation in the test dataset because of the small number of compounds in that dataset (n=5). Nevertheless, the R2WDV was 75% for the test dataset. The final model (available as supplementary Rdata file) with the tuned parameters resulted in a R2WDVof 0.80, e.g. explained 80% of the predictable variability, and the RMSE was 1.08 (TableII). The observed and predicted EPRs are depicted in Fig.6. Here, the vertical grey lines indicate the observed range of EPRs. Figure7 out-lines the model residuals (difference in observedversus predict-ed) as a function of the predicted EPR. No bias can be seen in the residuals for very low or very high EPR values. The per-centage of drugs within a 2- and 3-fold difference from the observations was 57.1 and 78.6%, respectively (TableII).
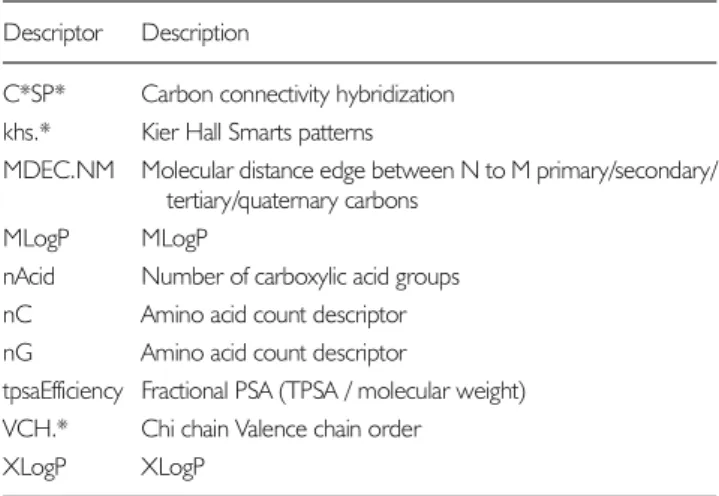
The variable importance plot (Fig. 8) shows the rela-tive importance of different chemical descriptors for the prediction of the EPR, for the 20 most important de-scriptors. The meaning of these descriptors is described in Table I. Most important were descriptors related to molecular size (MDEC) (33). which concerns molecular distances between carbons. Other important descriptors were related to lipophilicity (XlogP, MlogP), or carbon connectivity in molecules (khs and C3SP3).
Although ionizability is a potential relevant descriptor from a mechanistic point of view it was not included in our model because i) it was not included in the CDK package thereby complicating the application by our model by others and ii) its inclusion was not expected to substantially improve model performance due to the inclusion of already a large number of descriptors.
We imputed concentrations of 0.1 mg/L for ELF and plas-ma observations that were below LLOQ. The purpose was to avoid biasing the model towards only higher concentration range, which could impair the ability to predict low EPR values well. However, a downside of this approach is that the choice of imputation value can bias the above LLOQ predictions. To investigate the extent of this bias, we com-pared the predictions with two models: one model was fitted to a dataset with below-LLOQ-imputed observations, a
−1 −0.8 −0.6 −0.4 −0.2 0 0.2 0.4 0.6 0.8 1
second model was fitted to dataset with below-LLOQ-excluded observations. Both of these models were used to predict EPR values in a dataset with only above-LLOQ data. The model fitted with imputed values had an RMSE of 0.97 while the model with only above LLOQ data had an RMSE of 1.01, indicating that the imputation of 0.1 mg/L for below LLOQ values does not bias the predictions for the rest of the data to any relevant extent.
Finally, as an additional sanity check, we fitted an elastic net model with the optimal tuning parameters to an alterna-tive dataset in which mean EPR values were substituted for the individual EPR values, with mean values still weighted by the number of observations. The results from this model were identical to the final model, and thus our choice of retaining individual EPR values, when available, does not seem to affect the modeling results.
rifapentine (30) rifampicin (55) pyrazinamide (40) isoniazid (80) ethionamide (40) gsk1322322 (17) linezolid (67) zanamivir (36) telithromycin (115) solithromycin (30) s−013420 (28) roxithromycin (15) erythromycin (12) dirithromycin (25) clarithromycin (133) cethromycin (60) azythromycin (144) tigecycline (30) vancomycin (24) telavancin (20) teicoplanin (13) trovafloxacin (27) temafloxacin (32) sparfloxacin (57) rufloxacin (32) pefloxacin (10) opc−17116 (24) moxifloxacin (34) lomefloxacin (52) levofloxacin (237) gatifloxacin (15) garenoxacin (24) clinafloxacin (15) ciprofloxacin (81) iclaprim (24) cefuroxime axetil (26) ceftobiprole (24) ceftibuten (13) ceftazidime (15) cefpodoxime proxetil (12) cefpirome (8) cefepime (20) cefditoren (24) cefdinir (16) meropenem (78) ertapenem (30) biapenem (12) tazobactam (10) clavulanic acid (15) piperacillin (10) amoxycillin (15) voriconazole (12) itraconazole (25) tobramycin (28) netilmicin (20) gentamicin (24)
−5 −3 −1 1 3 5 7
log Ratio(CELF Cplasma)
Dr
ug
Class
Aminoglycoside Antifungal_agents Beta−lactam
Beta−lactamase_inhibitor Carbapenem Cephalosporin
DHFR_inhibitor Fluoroquinolone Glycopeptide
Glycylcyclines Macrolide
Neuraminidase_inhibitor
Oxazolidone PDF_inhibitor Tubercolosis_agents
Model Validation
The final elastic net model was used to generate predictions for 5 antibiotics not included in the training dataset (Fig.6). These predictions had an R2WDVof 0.75 and RMSE of 0.70 (TableII), which indicates quite reasonable predictive perfor-mance, and which is consistent with the R2WDVobtained from the LOOCV. The separately trained model with PaDEL-derived set of descriptors had a slightly higher R2WDV for the full dataset, when compared to the R2WDVof the rcdk-derived descriptor set (TableII). However, the R2WDV obtain-ed from the LOOCV was identical between the models trained on the two sets of descriptors (TableII), highlighting that the two descriptor sets are equally good in predicting the EPR of a new compound not included in the training data. The percentage of drugs within a 2- and 3-fold difference
from the observations was 40 and 80%, respectively. Of note, no significance should be attributed to the 2-fold and 3-fold change for train and test datasets because the test dataset only contains 5 compounds making these values sensitive to ran-dom variation.
DISCUSSION
We provide the firstin silicoprediction model for EPRs based on chemical descriptors from a relatively large dataset of an-tibiotics with potentially a variety of mechanisms (e.g. passive diffusion and active transport). The predictions obtained for both training and test datasets indicate that a considerable amount of between-antibiotic EPR variability could be ex-plained by the use of this chemical descriptor-based model.
rifampicin pyrazinamide isoniazid ethionamide linezolid telithromycin clarithromycin azythromycin levofloxacin ciprofloxacin meropenem
rifampicin zanamivir telithromycin clarithromycin azythromycin sparfloxacin moxifloxacin levofloxacin ciprofloxacin meropenem ertapenem
−3 0 3 6
Health
y volunteers
Patient [lung inf]Patient [other]
Health
y volunteers
Patient [lung inf]Patient [other]
Health
y volunteers
Patient [lung inf]Pa
tient [other]
Health
y volunteers
Patient [lung inf]Pa
tient [other]
Health
y vo
lunteer s
Patient [lung inf]Pa
tient [other]
Health
y vo
lunteer s
Patient [lung inf]Pa
tient [other]
Health
y volunteer
s
Patient [lung inf]Pa
tient [other]
Health
y volunteer
s
Patient [lung inf]Patient [other
]
Health
y volunteers
Patient [lung inf]Pa
tient [other]
Health
y volunteers
Patient [lung inf]Pa
tient [other ]
Health
y volunteer
s
Patient [lung inf]Pa
tient [other]
log
Ratio
(
CELF Cplasma
)
State Healthy volunteers Patient [lung inf] Patient [other]
−3 0 3 6
No steady state Steady state
No steady state Steady state
No steady state Steady state
No steady stat e
Steady stat e
No steady state Steady stat
e
No steady state Steady state
No steady stat e
Steady stat e
No steady state Steady state
No steady state Steady stat
e
No steady stat e
Steady state No steady state
Steady stat e
log
Ratio
(
CELF Cplasma
)
SS No steady state Steady state
Previous reviews on ELF concentrations (7,8) were focused on a more qualitative evaluation, outlining EPR trends be-tween different antibiotic classes. Indeed, such class-based comparisons are relevant based on the visualizations in this article. However, in order to make an impact in antibiotic drug development, there is a significant need for more quan-titative models that can predict tissue site concentrations more accurately and in such a way to further support and inform the development of novel antibiotics.
Given the retrospective nature of the dataset analyzed, there exist a multitude of factors that may potentially influence
observed EPRs. Firstly, no clear effects of within-antibiotic variability related to factors such as disease state or phar-macokinetic properties could be identified, i.e. no clear and consistent trends were observed. While we certainly expect that such factors may influence within-antibiotic variability, their contribution was limited based on the observed data. Other factors that differ both between-and within different antibiotics are: i) errors in the applied scaling to unbound plasma concentrations of part of the data, ii) differences in alveolar and bronchial ELF concen-trations, iii) various study design related factors such as the
1.2 1.4 1.6 1.8 2.0
0.25 0.50 0.75 1.00
RMSE 0.0 0.1 0.2 0.3 0.4
0.25 0.50 0.75 1.00
s
R
2
λ2 0 1e−04 0.001 0.005 0.01 0.05 0.1 0.25 0.5
Fig. 5 Tuning of the elastic net model depicting the root mean squared error (RMSE) and R2for
different values for the tuning parameters s andλin the elastic net model, obtained during leave one antibiotic out cross-validation (LOOCV). Thered circleshows the optimum set of tuning parameters which results in the lowest RMSE.
cefpodoxime proxetil cefpodoxime proxetil cefpodoxime proxetil cefpodoxime proxetil cefpodoxime proxetil cefpodoxime proxetil cefpodoxime proxetil cefpodoxime proxetil cefpodoxime proxetil cefpodoxime proxetil cefpodoxime proxetil cefpodoxime proxetil cethromycin cethromycin cethromycin cethromycin cethromycin cethromycin cethromycin cethromycin cethromycin cethromycin cethromycin cethromycin cethromycin cethromycin cethromycin cethromycin cethromycin cethromycin cethromycin cethromycin cethromycin cethromycin cethromycin cethromycin cethromycin cethromycin cethromycin cethromycin cethromycin cethromycin cethromycin cethromycin cethromycin cethromycin cethromycin cethromycin cethromycin cethromycin cethromycin cethromycin cethromycin cethromycin cethromycin cethromycin cethromycin cethromycin cethromycin cethromycin cethromycin cethromycin cethromycin cethromycin cethromycin cethromycin cethromycin clavulanic acid clavulanic acid clavulanic acid clavulanic acid clavulanic acid clavulanic acid clavulanic acid clavulanic acid clavulanic acid clavulanic acid clavulanic acid clavulanic acid clavulanic acid clavulanic acid erythromycin erythromycin erythromycin erythromycin erythromycin erythromycin erythromycin erythromycin erythromycin erythromycin erythromycin erythromycin pefloxacin pefloxacin pefloxacin pefloxacin pefloxacin pefloxacin pefloxacin pefloxacin pefloxacin peflo arbekacin gsk2251052 imipenem mk7655 tedizolid −5 −4 −3 −2 −1 0 1 2 3 4 5 6
−5 −4 −3 −2 −1 0 1 2 3 4 5 6
Predicted log Ratio (CELFCplasma)
Observed log Ratio ( CELF Cplasma ) Class Aminoglycoside Antifungal_agents Beta−lactam Beta−lactamase_inhibitor Carbapenem Cephalosporin DHFR_inhibitor Fluoroquinolone Glycopeptide Glycylcyclines Macrolide Neuraminidase_inhibitor Oxazolidone PDF_inhibitor Tubercolosis_agents
Fig. 6 Observed (mean as
coloured circleand range asgray lines)versuspredicted (single typical values) epithelial lining fluid (ELF)/ plasma concentration ratios for the training dataset (n=56) and the test dataset (n=5,red triangles). The size of thecircleindicates the amount of available data depicted in the mean value. Thefill colors
wide variation in time of measurement and dosing strate-gy, and finally iv) inherent differences between BAL and BMS assays. Nonetheless, for the various antibiotics mul-tiple studies were pooled, allowing for potentially more unbiased estimates of typical lung exposures while fitting the elastic net models.
The ten most important descriptors were molecular size, as described by molecular distance edge descriptors between car-bon primary, secondary, tertiary and quaternary carcar-bons (MDEC24, MDEC12, MDEC34), carbon binding connectiv-ity (khs.ssssC, C3SP3), sulfur atom binding (khs.ssS), lipophi-licity descriptors (MLogP, XLogP), and number of carboxylic
cefpodoxime proxetil cefpodoxime proxetil cefpodoxime proxetil cefpodoxime proxetil cefpodoxime proxetil cefpodoxime proxetil cefpodoxime proxetil cefpodoxime proxetil cefpodoxime proxetil cefpodoxime proxetil cefpodoxime proxetil cefpodoxime proxetil cethromycin cethromycin cethromycin cethromycin cethromycin cethromycin cethromycin cethromycin cethromycin cethromycin cethromycin cethromycin cethromycin cethromycin cethromycin cethromycin cethromycin cethromycin cethromycin cethromycin cethromycin cethromycin cethromycin cethromycin cethromycin cethromycin cethromycin cethromycin cethromycin cethromycin cethromycin cethromycin cethromycin cethromycin cethromycin cethromycin cethromycin cethromycin cethromycin cethromycin cethromycin cethromycin cethromycin cethromycin cethromycin cethromycin cethromycin cethromycin cethromycin cethromycin cethromycin cethromycin cethromycin cethromycin cethromycin clavulanic acid clavulanic acid clavulanic acid clavulanic acid clavulanic acid clavulanic acid clavulanic acid clavulanic acid clavulanic acid clavulanic acid clavulanic acid clavulanic acid clavulanic acid clavulanic acid erythromycin erythromycin erythromycin erythromycin erythromycin erythromycin erythromycin erythromycin erythromycin erythromycin erythromycin erythromycin pefloxacin pefloxacin pefloxacin pefloxacin pefloxacin pefloxacin pefloxacin pefloxacin pefloxacin pefloxacin arbekacin gsk2251052 imipenem mk7655 tedizolid −6 −5 −4 −3 −2 −1 0 1 2 3 4 5
−1 0 1 2 3 4
Predicted log Ratio (CELFCplasma)
Residuals Class Aminoglycoside Antifungal_agents Beta−lactam Beta−lactamase_inhibitor Carbapenem Cephalosporin DHFR_inhibitor Fluoroquinolone Glycopeptide Glycylcyclines Macrolide Neuraminidase_inhibitor Oxazolidone PDF_inhibitor Tubercolosis_agents
Fig. 7 Model residuals (observed-predicted)versuspredicted (single typical values) epithelial lining fluid (ELF)/plasma concentration ratios for the training dataset (n=56) and the test dataset (n=5,red triangles). The size of thecircleindicates the amount depicted in the mean value. Thefill colorsindicate the different antibiotic classes present in the training dataset. nC nG tpsaEfficiency VCH.5 VCH.7 MDEC.13 khs.sCH3 MDEC.44 VCH.6 MDEC.14 MDEC.11 C3SP3 khs.ssssC MLogP nAcid MDEC.34 khs.ssS XLogP MDEC.12 MDEC.24 25
0 50 75 100
Relative importance (%)
Descr
iptor
type Constitutional Electric Geometrical
Fig. 8 Variable importance plots for the final elastic net model fit for prediction of epithelial lining fluid (ELF) concentrations showing the relative importance (RI) for the 20 most important descriptors stratified by descriptor type. TableIprovides an overview to support
acid groups (nAcid). The descriptors like molecular size, lipo-philicity and acidity are expected to be related to the passive diffusion process. However, a large number of other descrip-tors were also seen to have a relevant (>20%) relative impor-tance (Fig. 8). Potentially such descriptors may have also helped in explaining the active transport process.
We imputed LLOQ values at a value of 0.1 mg/L, mainly for ELF concentrations, as this was the commonly observed threshold across ELF studies. We aimed to include these LLOQ values in order to prevent bias towards predicting higher EPRs, for drugs that actually resulted in low EPR values below the LLOQ. However, a further decrease in im-putation led to further decreases in R2for the above LLOQ values, e.g. a bias towards predicting the higher
concentrations. As such the choice of 0.1 appeared to result in the best balance between bias towards either lower- or higher EPR values.
Given that current mechanistic understanding of alveolar membrane transport is limited, we aimed at developing a statistical model for structure-based prediction of EPRs with good predictive properties, but at its core still remains empir-ical. Nonetheless, the identified predictors provide insights into the relative importance of various physico-chemical prop-erties on a global level. The use of a regularized regression modelling approach allowed the evaluation of a large set of chemical descriptors while appropriately managing the risks of model over-fitting that is a major concern in such modelling exercises. However, interpreting the model may be challeng-ing because of the large number of regression coefficients, which may be considered a limitation of this model.
From Fig.6few of the antibiotics exhibit substantial devi-ations from the mean observed EPRs. Nonetheless, similarly, experimental BAL studies are associated with considerable uncertainties as shown in our analysis. Therefore, this may provide some justification for the use of our in silicomodel, or may be an inherent variability arising in the data from these BAL studies, rather than solely attributable to model misspecification. Moreover, when performing dose selection studies, only very large deviations from plasma concentrations are of relevance, i.e. minor deviations will not negatively im-pact the design of these studies or the selection of optimal dose levels.
For development of the QSPR model we have chosen to include a major part of the collected compounds for model development and only a limited set of compounds for an ex-ternal evaluation, where we observed reasonable predictive
Table I Overview of Descriptors Used in Analysis as Part of the CDK Package, with depicted descriptors correspond to the 20 most important descriptors
Descriptor Description
C*SP* Carbon connectivity hybridization khs.* Kier Hall Smarts patterns
MDEC.NM Molecular distance edge between N to M primary/secondary/ tertiary/quaternary carbons
MLogP MLogP
nAcid Number of carboxylic acid groups nC Amino acid count descriptor nG Amino acid count descriptor
tpsaEfficiency Fractional PSA (TPSA / molecular weight) VCH.* Chi chain Valence chain order
XLogP XLogP
Table II Root Mean Squared Error (RMSE) and R2Values of the Final Elastic Net Model Using rcdk Descriptor (s=0.2,λ=0.05) for Prediction of log(ELF/ plasma) Concentration Ratios, Depicted for the Full Training Dataset, the Leave-one-antibiotic-out Cross Validation (LOOCV), for the Test Dataset, and also using an alternate set of descriptors obtained from PaDeL (s = 0.2,λ= 0.05)
Final elastic net model Comparison model with alternative descriptors External evaluation
Dataset Train dataset Train dataset Test dataset
Descriptors Rcdk PaDeL Rcdk
R2 Full data LOOCV Full data LOOCV
Theoretical upper limit 0.83 0.83 0.83 0.83 0.94
Uncorrected 0.66 0.45 0.75 0.45 0.71
Within-drug variability correcteda 0.80 0.54 0.91 0.54 0.75
RMSE
Theoretical lower limit 0.76 0.76 0.76 0.76 0.31
Uncorrected 1.08 1.36 0.92 1.36 0.70
Drugs within fold-change of predictions from observation
Drugs within 2-fold change 57.1% 35.7% 75.0% 35.7% 40%
Drugs within 3-fold change 78.6% 60.7% 91.0% 60.7% 80%
a
performance. How well will this model perform when used to predict the EPR for a new antibiotic? Based on the model evaluation performed we expect reasonable performance for compounds with some similarity in the structural scaffolds of various drug classes included in the model development. However, for compounds with radically different structural features, our model may not yield informative predictions. However even in the case of such compounds our model can be beneficial and confirmatoryin vitroorin vivoexperiments may be warranted.
How can this model now be used in the drug development process of anti-infective agents for lung infections? Practically, our model can be applied in a straightforward fashion for prediction of EPRs of new anti-infective agents. First, the de-scriptor values can be computed using the Rcdk R package, and subsequently the predictions can be generated using our final model included as Rdata file asElectronic supplementary materialto this paper. An example script is also included as Electronic supplementary materialto demonstrate the appli-cation of the QSPR model.
Conceptually, the model developed in this study could be of considerable relevance to inform and optimize the design of lung PK studies (34). since such studies are methodologically complex and burdensome with respect to the obtaining samples. Secondly, in combination with a straightforward population PK model (35) accounting for plasma PK and its inter-individual variability, clinical study designs can be simulated in order to identify optimal probability of target attainment based on the ELF concentration rath-er than the plasma concentration. Finally, again in com-bination with a population PK model, our model may be of relevance for screening or generating confirmatory evidence for antibiotics currently already used to treat lung infections off label, but for which no formal lung PK studies have been conducted.
ACKNOWLEDGMENTS AND DISCLOSURES
This study was performed within the framework of Dutch Top Institute Pharma, PKPD PLATFORM 2.0 (project number D2-501). This work was carried out on the Dutch national e-infrastructure with the support of SURF Foundation. The authors do not have any con-flict of interest to report.
Open AccessThis article is distributed under the terms of the Creative Commons Attribution 4.0 International License (http://creativecommons.org/licenses/by/4.0/), which per-mits unrestricted use, distribution, and reproduction in any medium, provided you give appropriate credit to the original author(s) and the source, provide a link to the Creative Com-mons license, and indicate if changes were made.
REFERENCES
1. Melsen WG, Rovers MM, Koeman M, Bonten MJM. Estimating the attributable mortality of ventilator-associated pneumonia from randomized prevention studies. Crit. Care Med. 2011. p. 1.
2. Mouton JW, Theuretzbacher U, Craig WA, Tulkens PM,
Derendorf H, Cars O. Tissue concentrations: do we ever learn? J Antimicrob Chemother. 2008;61:235–7.
3. Dagan R. Evidence to support the rationale that bacterial eradica-tion in respiratory tract infeceradica-tion is an important aim of antimicro-bial therapy. J Antimicrob Chemother. 2001;47:129–40. 4. Liu P, Derendorf H. Antimicrobial tissue concentrations. Infect Dis
Clin North Am. 2003;17:599–613.
5. Cheek JM, Kim KJ, Crandall ED. Tight monolayers of rat alveolar epithelial cells: bioelectric properties and active sodium transport. Am J Physiol. 1989;256:C688–93.
6. Forbes B, Ehrhardt C. Human respiratory epithelial cell culture for drug delivery applications. Eur J Pharm Biopharm. 2005;60:193– 205.
7. Kiem S, Schentag JJ. Interpretation of antibiotic concentration ra-tios measured in epithelial lining fluid. Antimicrob Agents Chemother. 2008;52:24–36.
8. Rodvold KA, George JM, Yoo L. Penetration of anti-infective agents into pulmonary epithelial lining fluid: focus on antibacterial agents. Clin Pharmacokinet. 2011;50:637–64.
9. Rennard SI, Basset G, Lecossier D, O’Donnell KM, Pinkston P, Martin PG,et al. Estimation of volume of epithelial lining fluid recovered by lavage using urea as marker of dilution. J Appl Physiol. 1986;60:532–8.
10. Boselli E, Breilh D, Djabarouti S, Guillaume C, Rimmelé T, Gordien J-B,et al. Reliability of mini-bronchoalveolar lavage for the measurement of epithelial lining fluid concentrations of tobramycin in critically ill patients. Intensive Care Med. 2007;33: 1519–23.
11. Yamazaki K, Ogura S, Ishizaka A, Oh-hara T, Nishimura M. Bronchoscopic microsampling method for measuring drug concen-tration in epithelial lining fluid. Am J Respir Crit Care Med. 2003;168:1304–7.
12. Poulin P, Theil FP. A priori prediction of tissue:plasma partition coefficients of drugs to facilitate the use of physiologically-based pharmacokinetic models in drug discovery. J Pharm Sci. 2000;89: 16–35.
13. Zhao YH, Abraham MH, Ibrahim A, Fish PV, Cole S, Lewis ML,
et al. Predicting penetration across the blood-brain barrier from simple descriptors and fragmentation schemes. J Chem Inf Model. 2007;47:170–5.
14. Rodgers T, Leahy D, Rowland M. Physiologically based pharma-cokinetic modeling 1: predicting the tissue distribution of moderate-to-strong bases. J Pharm Sci. 2005;94:1259–76.
15. Rodgers T, Rowland M. Physiologically based pharmacokinetic modelling 2: predicting the tissue distribution of acids, very weak bases, neutrals and zwitterions. J Pharm Sci. 2006;95:1238–57. 16. Luco JM. Prediction of the brain-blood distribution of a large set of
drugs from structurally derived descriptors using partial least-squares (PLS) modeling. J Chem Inf Comput Sci. 1999;39:396– 404.
17. Golmohammadi H, Dashtbozorgi Z, Acree WE. Quantitative structure-activity relationship prediction of blood-to-brain partitioning behavior using support vector machine. Eur J Pharm Sci. 2012;47:421–9.
18. Bujak R, Struck-Lewicka W, Kaliszan M, Kaliszan R,
19. Wang W, Kim MT, Sedykh A, Zhu H. Developing enhanced blood-brain barrier permeability models: integrating external bio-assay data in QSAR modeling. Pharm Res. 2015.
20. Hastie T, Tibshirani R, Friedman J. The elements of statistical learning the elements of statistical learningdata mining, inference, and prediction, Second Edition. Springer Ser Stat. 2009. 21. Rhee E, Jumes P, Rizk M, Gotfried M, Mangin E, Bi S, et al.
Intrapulmonary pharmacokinetics of MK-7655, a novel β -lactamase inhibitor, dosed in combination with imipenem/ cilastatin in healthy subjects. Intersci Conf Antimicrob Agents Chemother. 2013. p. A–1028.
22. DrugBank [Internet]. Available from:http://www.drugbank.ca. 23. Grigg J, Kleinert S, Woods RL, Thomas CJ, Vervaart P, Wilkinson
JL,et al. Alveolar epithelial lining fluid cellularity, protein and endothelin-1 in children with congenital heart disease. Eur Respir J. 1996;9:1381–8.
24. Guha R, Rojas-Chertó M. rcdk : integrating the CDK with R. Chem. Informatics Funct. R [Internet]. 2010;1–17. Available from:
http://cran.r-project.org/web/packages/rcdk/vignettes/rcdk.pdf. 25. Guha R. Chemical Informatics Functionality in R. J. Stat. Softw. [Internet]. 2007;18:1–16. Available from:http://www.jstatsoft. org/v18/i05.
26. Steinbeck C, Han Y, Kuhn S, Horlacher O, Luttmann E, Willighagen E. The Chemistry Development Kit (CDK): an open-source Java library for chemo- and bioinformatics. J Chem Inf Comput Sci. 2003. p. 493–500.
27. Zou H, Hastie T. elasticnet: elastic-net for sparse estimation and sparse PCA [Internet]. 2012 [cited 2014 Dec 30]. p. Version 1.1. Available from: http://cran.r-project.org/web/packages/ elasticnet/index.html.
28. Kuhn M. Building predictive models in R using the caret package. J Stat Softw. [Internet]. 2008;28:1–26. Available from:http://www. jstatsoft.org/v28/i05/.
29. Yap CW. PaDEL-descriptor: an open source software to calculate molecular descriptors and fingerprints. J Comput Chem. [Internet]. 2011 [cited 2015 Oct 26];32:1466–74. Available from:http:// www.ncbi.nlm.nih.gov/pubmed/21425294.
30. Funatsu Y, Hasegawa N, Fujiwara H, Namkoong H, Asami T, Tasaka S,et al. Pharmacokinetics of arbekacin in bronchial epithe-lial lining fluid of healthy volunteers. J Infect Chemother. 2014;20: 607–11.
31. Tenero D, Bowers G, Rodvold KA, Patel A, Kurtinecz M, Dumont E,et al. Intrapulmonary pharmacokinetics of GSK2251052 in healthy volunteers. Antimicrob Agents Chemother. 2013;57: 3334–9.
32. Housman ST, Pope JS, Russomanno J, Salerno E, Shore E, Kuti JL,et al. Pulmonary disposition of tedizolid following administration of once-daily oral 200-milligram tedizolid phosphate in healthy adult volunteers. Antimicrob Agents Chemother. 2012;56:2627– 34.
33. Estrada E, Ramirez A. Edge adjacency relationships and molecular topographic descriptors. Definition and QSAR applications. J Chem Inf Comput Sci. 1996;36:837–43.
34. Clewe O, Karlsson MO, Simonsson USH. Evaluation of optimized bronchoalveolar lavage sampling designs for characterization of pulmonary drug distribution. J Pharmacokinet Pharmacodyn. 2015.