Zhaohui Man. Comparative Study of Machine Learning Models To Predict PPH. A Master’s Paper for the M.S. in I.S. degree. November, 2019. 44 pages. Advisor: Jaime Arguello
PPH (Postpartum Hemorrhage) is defined as blood loss greater than or equal to 1000 ml following delivery. PPH is among the leading causes of maternal death; however, the existing predictive mechanism used by UNC-CH hospital is oversensitive by flagging too many patients as high risk and is generally abandoned by medical providers. This study is aimed to applying the trending machine learning classifying models to better predict the risk of PPH. Actual dataset was extracted and integrated from EHRS (Electronic Health Record System) with 12 variables considered to be highly relevant to PPH occurrence. Six machine learning models including Logistic Regression, Decision Trees, Random Forest, KNN, SVM and ANN (a deep learning model) were tried and compared in terms of their predicting accuracy and other metrics such as precision and recall. Random Forest stood out as the best model with the accuracy being 89%.
Headings:
Machine Learning
Predictive Model Building
COMPARATIVE STUDY OF MACHINE LEARNING MODELS TO PREDICT PPH
by Zhaohui Man
A Master’s paper submitted to the faculty of the School of Information and Library Science of the University of North Carolina at Chapel Hill
in partial fulfillment of the requirements for the degree of Master of Science in
Information Science.
Chapel Hill, North Carolina November 2019
Approved by
Table of Contents
BACKGROUND ... 2
MOTIVATION ... 4
METHOD ... 5
Data Collection ... 5
Machine Learning ... 6
EDA(Exploratory Data Analysis) ... 7
Data preprocessing ... 15
Model building ... 17
Statistical analysis ... 18
Model evaluation ... 18
RESULTS ... 20
DISCUSSION ... 23
LIMITATIONS ... 25
PPH Measurement ... 25
Data Quality ... 26
CONCLUSION: ... 26
2
BACKGROUND
Blood loss in the immediate postpartum period is expected for all women; however, an excessive amount can have serious consequences and is among the leading causes of maternal mortality globally (Say L et al., 2014). There is no consensus regarding what constitutes excessive blood loss. The most cited definition is specified by the World
Health Organization (WHO), defining PPH as ≥500 ml blood loss within 24 hours of a
vaginal birth and ≥1000 ml blood loss following a cesarean birth (WHO, 2012;
Arulkumaran, Mavrides and Penney, 2009). The criteria of PPH was formed in the 1950s and 1960s, when articles provided rationale for the 500 ml threshold (De Boer, 1955; Newton, Egli, Gifford and Hull, 1961; Pritchard, 1965; Theobald, 1950). However, there is little published evidence indicating that this amount can result in PPH-related
morbidity (Kerr, 2017) and evidence from studies that treated women at later thresholds of bleeding (e.g. 700 ml) suggests that many women who bleed 500 ml may be fine without intervention (Blum et al., 2010; Winikoff et al., 2010). Notably, in many scenarios all over the world, the 500 ml definition continues to be a guiding norm that is used in clinical practice guidelines, program evaluation approaches and research studies. Nonetheless, the American College of Obstetricians and Gynecologists (ACOG)
Thanks to advances in the management of postpartum bleeding (e,g, uterotonic medications and transfusion medicine), maternal death from PPH trended downward between 1994 and 2006 (Callaghan, Kuklina and Berg, 2008). Despite the lives saved, PPH remains a major contributor to maternal morbidity (Callaghan, Kuklina and Berg, 2010), but there is evidence this tragedy can be prevented. In case reviews of near-miss and severe maternal morbidity within one perinatal network of U.S. hospitals, experts concluded that 54% of cases were potentially preventable. In particular, the panel pointed out that 43% of the preventable cases involved a ‘delay in diagnosis.’ (Berg et al., 2005) Another review of pregnancy-related deaths conducted by an expert panel showed that maternal deaths involving hemorrhage were mostly preventable (Glover 2003).
On Jul. 26 2018, an investigative series titled “Deadly Deliveries” was published by USA Today (https://www.usatoday.com/deadly-deliveries/interactive/how-hospitals-are-failing-new-moms-in-graphics/). One article in the series highlighted several NC
4
increased nursing workload), insertion of second large bore IV, and preparing the OR team.
MOTIVATION
Having a reliable PPH risk assessment tool is the first step in decreasing rate of maternal deaths from hemorrhage, as well as reducing blood transfusions, length of stay, and ICU admissions.
Nevertheless, providers perceive the AWHONN Method to be doubtful because it is oversensitive, flagging too many of the patients as high risk; they assert that overreacting to false positives leads to overutilization of resources, since implementing ‘anticipatory interventions’ for patients who are improperly flagged as high risk leads to tremendous waste (blood bank time and cost, nursing time, etc.) and causes ‘alarm fatigue,’ as
Machine learning (ML) based prediction of clinical outcomes can be used for appropriate decision making and can lead to better patient care. Machine learning prediction model can accurately predict the risk of PPH as categorized into three classes, namely, ‘no’, ‘low risk’ and ‘high risk’. ML also has advantages compared with traditional statistical models in terms of high power and accuracy to predict disease. However, there is no specific algorithm that performs better for the prediction model. We, therefore, conducted most commonly used algorithms and compared their performance in the prediction of PPH.
METHOD
Data Collection
Data was collected from EPIC Clarity, Epic’s relational database for analytical reports that was created via ETL(Extract, Transform and Load) from EPIC Chronicles (Epic’s LIVE hierarchical database). Records of patients who delivered their babies from “NC Women’s Hospital” at UNC-CH Medical Center in Chapel Hill, NC during Dec. 2018 to May 2019 inclusive was extracted and de-identified. As to which variables should be queried and retrieved from the database, professional opinions from medical providers from UNC-CH Women’s Hospital were consulted and published papers in this regard were reviewed (Kramer et al., 2013; Oyelese and Ananth, 2010; Briley et al., 2014; Stones, Paterson and Saunders, 1993; Tessier and Pierre, 2004). The following variables are included in the dataset thus retrieved:
• Mom_ID: masked ID for Mom
• race: mom’s race( Latino, NL White, NL Black, NL Asian, NL Other)
6
• gravida: the total number of confirmed pregnancies that a woman has had, regardless of the outcome.
• para: the number of births that a woman has had after 20 weeks gestation.
• PUS(prior_uterine_surgery): 1 (=yes) or 0 (=no) [obtained if CS_Indications includes “Prior Uterine Surgery”]
• multiple: 0 (=no, or singlenton) or 1 (=yes to multiple, twins or triplets or more)
• MBP(mom_bmi_pg): mom’s BMI pre-gravida
• prev_cs: 0 (=no previous Section) or 1 (=yes, mom had at least one previous C-Section)
• DSLC(days_since_last_cs): days since last C-Section
• GA: gestational age (if multiples, is max ga) – it has a couple of NULLs
• deltype: delivery type (if multiples, Section if one of the deliveries was a C-Section, Vaginal otherwise)
• induction: 0 (=no induction was performed on delivery) or 1 (=yes for induction)
• BL_total= Blood Loss Total – it is the sum of BL_surgery and BL_flowsheet_EBL
Machine Learning
I identified the most relevant variables which can augment the effectiveness of the predictive model. Third, the models were built. Finally, the classification models were evaluated using confusion matrices, ROC, precision, recall, f1 score, and cross validation score.
EDA(Exploratory Data Analysis)
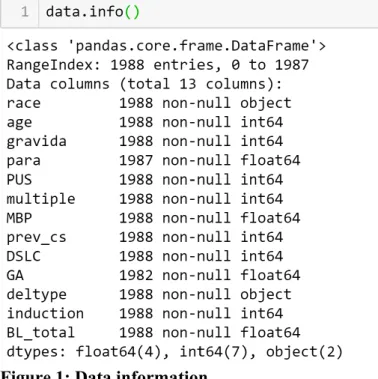
As is demonstrated by Figure 1, there are 1988 instances in the dataset, which means that it is fairly small by Machine Learning standards, but it’s perfect to get started. More datapoints will be available along with the progress of ETL effort and this study is meant to test the performance of various machine learning classifying algorithms in preparation for the final model building that can make prediction of PPH risks against streamlined dataset. Notice that the para and ga attributes have null values, which necessitates dropping null values.
All attributes are numerical, except the race and deltype fields. Their type is object, so it could hold any kind of Python object, but since they are loaded from a CSV file
8
Figure 1: Data information
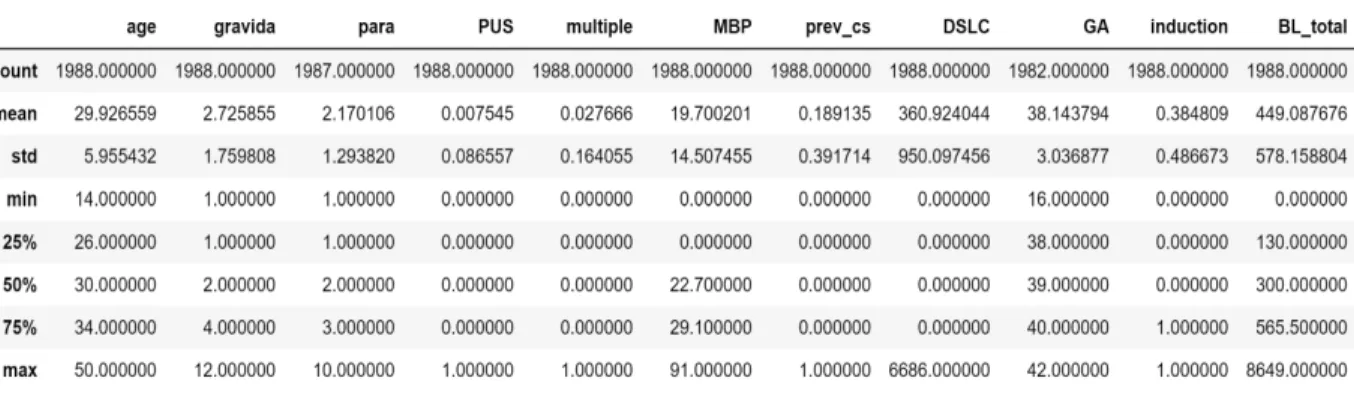
Figure 2 illustrates the summary of the numeric attributes. The count, mean, min, and max rows are self-explanatory. Note that the null values are ignored. The std row shows the standard deviation, which measures how dispersed the values are. The 25%, 50%, and 75% rows show the corresponding percentiles: a percentile indicates the value below which a given percentage of observations in a group of observations falls.
this variable, since those who have never had C-Section should be considered the sturdiest ones, thus assigned the largest number.
The target variable is BL_total, which is originally a continuous number recording the actual amount of PPH. According to the definition of PPH published by the ACOG, we split the cases of this field into two classes, namely, PPH (1) with values greater than or equal to 1000 ml and none-PPH (0) with values less than 1000 ml.
Figure 2: Summary of each numeric attribute
10
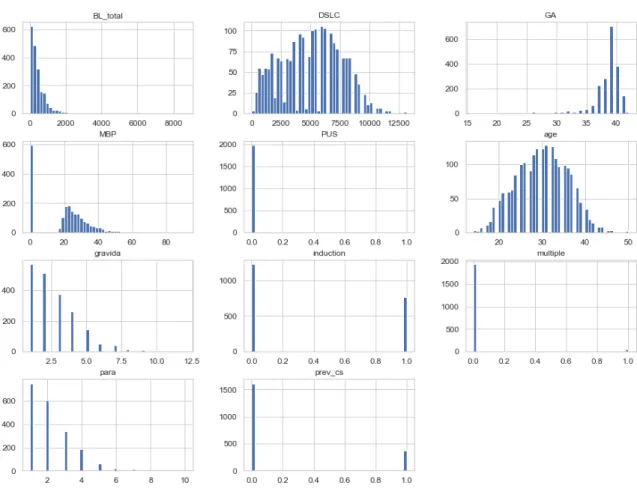
Figure 3: The histogram of each numeric attribute
From Figure 3, we can see that these attributes have very different scales. With few exceptions, Machine Learning algorithms don’t perform well when the input numerical attributes have very different scales. This is the case for the PPH data: the total number of DSLC ranges from about 312 to 6687, while the age only range from 14 to 50. Note that scaling the target values is generally not required.
There are two common ways to get all attributes to have the same scale: min-max scaling and standardization.
Min-max scaling (many people call this normalization) is quite simple: values are shifted
value and dividing by the max minus the min. Scikit-Learn provides a transformer called MinMaxScaler for this. It has a feature_range hyperparameter that lets you change the range if you don’t want 0–1 for some reason.
Standardization is quite different: first it subtracts the mean value (so standardized values
always have a zero mean), and then it divides by the standard deviation so that the
resulting distribution has unit variance. Unlike min-max scaling, standardization does not bound values to a specific range, which may be a problem for some algorithms (e.g., neural networks often expect an input value ranging from 0 to 1). However,
standardization is much less affected by outliers. Scikit-Learn provides a transformer called StandardScaler for standardization.
Standardization is employed in our study to normalize the data in light of the fact that for
some variables such as DSLC, a majority of values are of great difference with the other values.
12
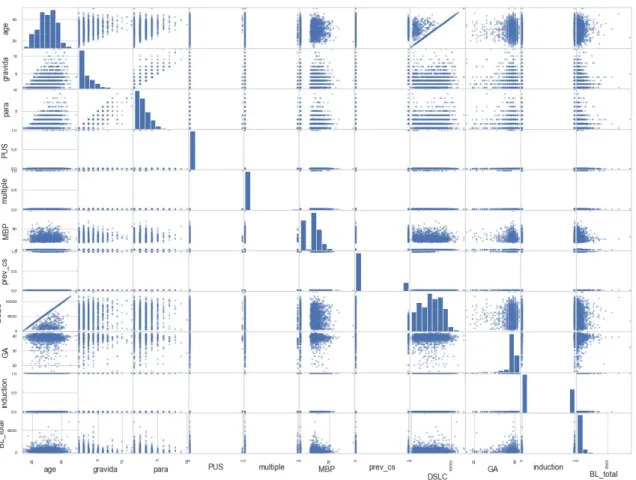
Figure 4: Scatter matrix of correlation among attributes
One essential task of EDA is to explore the correlation of each attribute to others. The main diagonal (top left to bottom right) would be full of straight lines if Pandas plotted each variable against itself, which would not be very useful. So instead Pandas displays a histogram of each attribute, as is shown in Figure 4. The less dispersed the points are, the more corelated the two variables are. From this figure, we can see that the most
However, categorical features are not included in this figure, so the next step is to convert the categorical variables into numeric using get_dummies function from python. After the dummification, more in-depth analysis can be conducted.
14
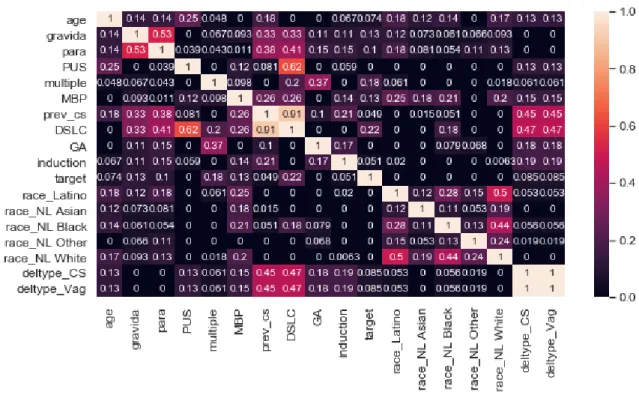
Figure 6: Correlation between each attribute based on chi-square/chi-contingency
Figure 5 depicts the correlation based on the standard correlation coefficient (also called Pearson’s r) between every pair of attributes using the corr( ) method. The correlation
coefficient ranges from –1 to 1. When it is close to 1, it means that there is a strong positive correlation. When the coefficient is close to –1, it means that there is a strong negative correlation. Finally, coefficients close to zero mean that there is no linear correlation. The attribute target is transformed from BL_total, splitting the continuous values into two classes based on the definition of PPH stipulated by ACOG.
To plot Figure 6, I have created a function that returns correlation value based on chi-square/chi-contingency, this ranges from 0 to 1. Generally, chi-square is a
deltype and race) ; while correlation (Pearson’s r) is used to test the correlation between two real-valued variables (like BMI and age).
It can be clearly seen from the two heat maps that variables generally have low correlation scores with the target variable, with the highest ones being 0.19 and 0.22, which doesn’t bode well for the later machine learning results. Nonetheless, it has to be pointed out that the above correlation coefficients only measure linear correlations (“if x goes up, then y generally goes up/down”). It may completely miss out on nonlinear relationships (e.g., “if x is close to zero then y generally goes up”).
Data preprocessing
Data cleaning: All variables will be removed that contained missing values accounting
for more than 50% of the entire data points. If the variable contains missing values, occupying less than 5% of the number of datapoints, we will fill it up with median value - this is used as a common approach when dealing with missing data in machine learning (Peng and Lei, 2005). Scikit-Learn provides a handy class to take care of missing values: SimpleImputer. We can fit the imputer instance to the dataset using the fit() method. The
imputer has simply computed the median of each attribute and stored the result in its statistics_ instance variable. Then, we can use this “trained” imputer to transform the dataset by replacing missing values by the learned medians.
16
Figure 7: Unbalanced target attribute
As is illustrated by Figure 7, the target variable is imbalanced, which could affect the correlation between variables and affect the result. We can balance the data through undersampling or oversampling.
Undersampling is reducing the larger class (target=0) and bring it equal to smaller class ( target=1). Oversampling is randomly generating samples of minority class(1 here) and bring it equal to majority class (0 in our dataset). This can be achieved through SMOTE (Synthetic Minority Over-sampling Technique).
Now we have a perfect balanced data. I over-sampled only on the training data, because by oversampling only on the training data, none of the information in the test data is being used to create synthetic observations, therefore, no information will bleed from test data into the model training.
Recursive Feature Elimination (RFE): Recursive Feature Elimination (RFE) is based
on the idea to repeatedly construct a model and choose either the best or worst
performing feature, setting the feature aside and then repeating the process with the rest of the features. This process is applied until all features in the dataset are exhausted. The goal of RFE is to select features by recursively considering smaller and smaller sets of features. It is worth mentioning that REF was only applied to measuring the performance of features from the training data, not the test data,
Dummification: For better visualization and more in depth analysis, we need to convert
these categorical variables into numeric using get_dummies function. This function create different columns for each category and mark the category used to create column as 1 and rest other as 0.
Model building
Six classification models, namely, Random forest (RF), artificial neural network (ANN), Decision tree (DT), support vector machine (SVM), logistic regression (LR), and K-nearest neighbors (KNN) were used to predict PPH risks. These models are commonly used to conduct classifications for supervised machine learning.
18
The model validation technique, 10-fold cross-validation was used assessed models performance and estimation of general error during the whole machine process. In this process, entire dataset was divided into equal 10 folds which are approximately the same number of events. Nine-folds was used as the training set, and the remaining 1 fold as the test set. It continued until each fold was used once for evaluation. The results from 10 times validation models were then combined to provide a measure of the overall performance.
Statistical analysis
Descriptive characteristics of the study population were provided including continuous variables as a mean ± standard deviation. The ROC (Receiver-Operating Curve) was used to assess the performance of these models. Python software (version 3.6) was used to analyze the basic statistical problem and to construct the ANN prediction model. All statistical tests were two-tailed and p<0.05 will be considered significant.
Model evaluation
Confusion matrix: the confusion matrix has been widely used for summarizing the
performance of the classification model.
Accuracy: Accuracy of a model is defined as the total positive instances of the model are
divided by the total number of instances. Accuracy parameter provides the percentage of correctly classified instances. The accuracy of model is defined as
Accuracy = TP+TN/ TP+FP+TN+FN
Precision: This parameter is used to determine the degree of the attribute to correctly
Recall: This parameter is used to determine the degree of the attribute to correctly
classify the person with non-PPH and is defined as Recall = TN/TN+FP
F-measure (F1 score): Since we have two measures (Precision and Recall) it helps to
have a measurement that represents both of them. We calculate an F-measure which uses Harmonic Mean in place of Arithmetic Mean as it punishes the extreme values more. The
F-Measure will always be nearer to the smaller value of Precision or Recall. F1 score = 2*(Precision_/*Recall)/(Precision+Recall)
20
RESULTS
Figure 10: Results from ANN model
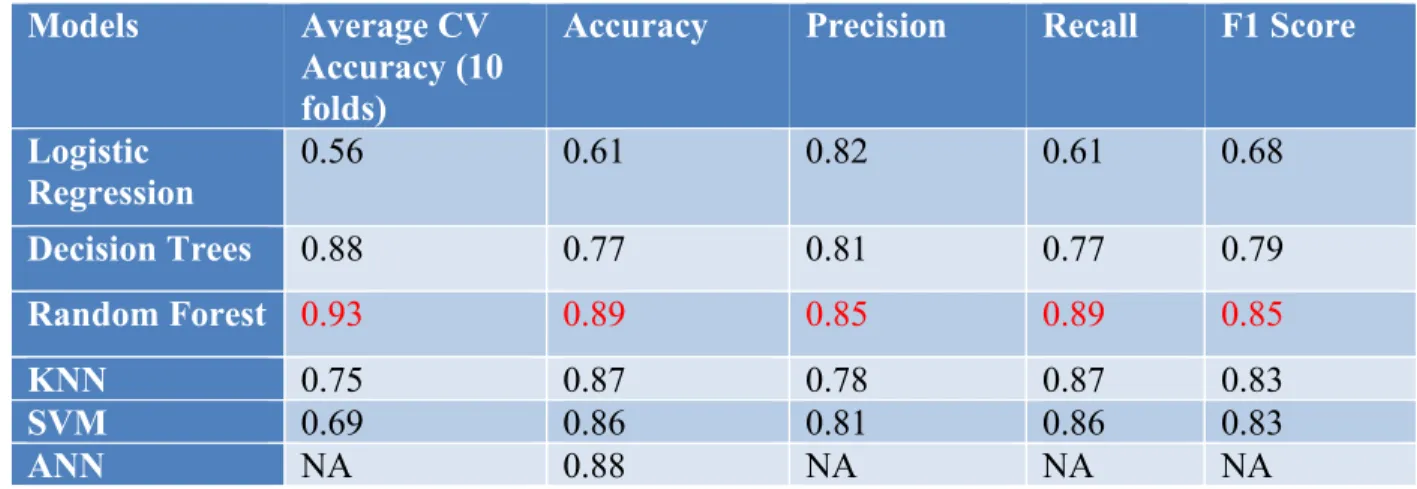
Based on Figure 9 and Figure 10, Table 1 and Figure 11 summarize the metrics of the performance of the six models.
Models Average CV
Accuracy (10 folds)
Accuracy Precision Recall F1 Score
Logistic
Regression 0.56 0.61 0.82 0.61 0.68
Decision Trees 0.88 0.77 0.81 0.77 0.79
Random Forest 0.93 0.89 0.85 0.89 0.85
KNN 0.75 0.87 0.78 0.87 0.83
SVM 0.69 0.86 0.81 0.86 0.83
ANN NA 0.88 NA NA NA
Table 1: Metrics of each model
Given that the data is skewed towards non-PPH, the accuracy of a degenerate baseline that always predicts non-PPH is calculated as 0.88 by assuming all the predictions are zeros.
High recall, low precision: This means that most of the positive examples are correctly recognized (low FN) but there are a lot of false positives.
22
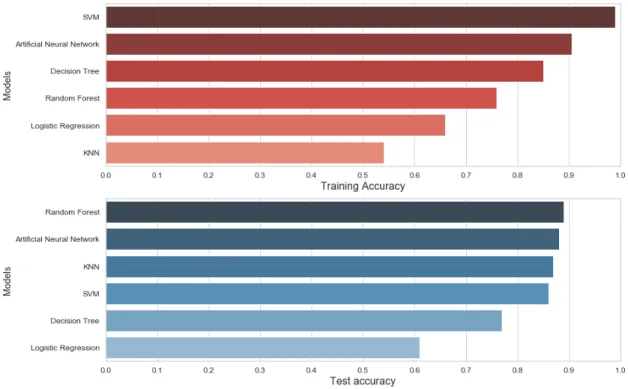
Figure 11: Comparison of the accuracy of each model
ROC is plot of True positive Rate (Recall) vs False Positive Rate. The farther the line is above the red dotted line the better is our prediction. The more area we have under ROC curve, the better the fit.
DISCUSSION
24
Random forest won for the following reasons. First, it reduces overfitting problem in decision trees and also reduces the variance and therefore improves the accuracy by creating as many trees on the subset of the data and combining the output of all the trees. Besides, it handles non-linear variables better than other algorithms and is robust to outliers. In our case, the variables are mostly not linearly corelated, as is shown by Figure 4 and Figure 3 demonstrates that values of most variables are immensely unbalanced.
ANN churned out the second best result also because, as Random Forest, it is more capable of exploiting interactions between features, as is described by Figure 13 and Figure 14.
Figure 13: Artificial Neural Network Figure 14: ANN flow chart
compare the models in predicting PPH against the currently available data, this accuracy carries information in this respect and will definitely be more able to differentiate the models when more datapoints are available.
LIMITATIONS
PPH Measurement
After a vaginal delivery, the patient’s blood loss is routinely assessed and recorded as part of the medical record. In the delivery room, the patient’s blood often saturates medical supplies like laparotomy sponges (“laps”), pads, and sheets. Spills on the floor are also normal. The standard practice for determining the volume of blood loss is a provider’s subjective visual estimate. Visual estimation of blood loss (VEBL) is widely known to be inaccurate, with several studies finding a 30-50% underestimation of blood losses, especially at higher volumes. Another quantification tool is the calibrated collector bag, which can be placed under the patient’s buttocks to collect lost fluid. The bags are calibrated and marked with volume lines that serve as an objective guide for the provider. Measurement via calibrated collector bags can be falsely elevated when
amniotic fluid, urine, or sponges fall into the collector bag during delivery (Shields et al., 2011).
26
delivery: (1) estimated blood loss of greater than 500 mL, (2) significant vital sign changes (includes HR>110, BP<90/60, O2 saturation < 95%), or (3) three uterotonic medications given. When one of these is met, the provider initiates Stage 1 of the OB hemorrhage protocol, which requires quantification of blood loss every 5-10 minutes with gravimetric measurement of blood-soaked supplies (“UNC”, 2017). However, this portion of the current protocol is not uniformly applied by all providers, partly due to the subjectivity of blood loss estimation. In light of this, the target value of the dataset that feeds the machine learning models is intrinsically inaccurate.
Data Quality
Only 1988 datapoints from the time range of half an year were collected. The size of dataset is far from ideal to feed machine learning models, especially for ANN, a deep learning model which favors large datasets. That is also one of the major reasons behind the fact that the accuracy of all the models tested are not far beyond the accuracy of the degenerate baseline. Another limitation is that there are many missing values for the variable DSLC (Days Since Last C-Section) and BMI, which are among the most important risk factors contributing to PPH. Again, more datapoints will solve the this problem, making the proportion of missing values insignificant.
CONCLUSION:
28
Bibliography
A Complete Machine Learning Project Walk-Through in Python: Part One. (n.d.). Retrieved August 2, 2019, from https://towardsdatascience.com/a-complete-machine-learning-walk-through-in-python-part-one-c62152f39420
Agrawal, S., & Agrawal, J. (2015). Neural network techniques for cancer prediction: A survey. Procedia Computer Science, 60, 769–774.
https://doi.org/10.1016/j.procs.2015.08.234
Ali-Saleh, M., Lavie, O., & Abramov, Y. (2019). Evaluation of blood type as a potential risk factor for early postpartum hemorrhage. Plos One, 14(4), e0214840.
https://doi.org/10.1371/journal.pone.0214840
Álvarez Menéndez, L., de Cos Juez, F. J., Sánchez Lasheras, F., & Álvarez Riesgo, J. A. (2010). Artificial neural networks applied to cancer detection in a breast screening programme. Mathematical and Computer Modelling, 52(7–8), 983–991.
https://doi.org/10.1016/j.mcm.2010.03.019
American College of Obstetricians and Gynecologists. ACOG practice bulletin number 183 – postpartum hemorrhage. Obstetrics & Gynecology. 2017;130(4):e168-186. Anger, H., Durocher, J., Dabash, R., & Winikoff, B. (2019). How well do postpartum blood loss and common definitions of postpartum hemorrhage correlate with postpartum anemia and fall in hemoglobin? Plos One, 14(8), e0221216.
Arulkumaran S, Mavrides E, Penney GC. Prevention and management of postpartum haemorrhage. Guideline. London, UK: Royal College of Obstetricians and
Gynaecologists, 2009 11 May 2009. Report No.: 52.
Asri, H., Mousannif, H., Moatassime, H. A., & Noel, T. (2016). Using machine learning algorithms for breast cancer risk prediction and diagnosis. Procedia Computer Science, 83, 1064–1069. https://doi.org/10.1016/j.procs.2016.04.224
Atukunda, E. C., Siedner, M. J., Obua, C., Mugyenyi, G. R., Twagirumukiza, M., & Agaba, A. G. (2014). Sublingual misoprostol versus intramuscular oxytocin for prevention of postpartum hemorrhage in Uganda: a double-blind randomized non-inferiority trial. PLoS Medicine, 11(11), e1001752.
https://doi.org/10.1371/journal.pmed.1001752
Berg, CJ, Haper, MA, Atkinson, SM, et al. Preventability of pregnancy-related deaths: Results of a statewide review. Obstet Gynecol 2005;106(6):1228-1234.
Blum J, Winikoff B, Raghavan S, Dabash R, Ramadan MC, Dilbaz B, et al. Treatment of post-partum haemorrhage with sublingual misoprostol versus oxytocin in women
receiving prophylactic oxytocin: a double-blind, randomised, non-inferiority trial. Lancet. 2010;375(9710):217–23. Epub 6 Jan 2010. pmid:20060162.
Bonnet, M.-P., Basso, O., Bouvier-Colle, M.-H., Dupont, C., Rudigoz, R.-C., Fuhrer, R., & Deneux-Tharaux, C. (2013). Postpartum haemorrhage in Canada and France: a
population-based comparison. Plos One, 8(6), e66882. https://doi.org/10.1371/journal.pone.0066882
Boruta进行特征选择—python | eamlife’s blog. (n.d.). Retrieved September 12, 2019,
30
Briley, A., Seed, P. T., Tydeman, G., Ballard, H., Waterstone, M., Sandall, J., … Bewley, S. (2014). Reporting errors, incidence and risk factors for postpartum haemorrhage and progression to severe PPH: a prospective observational study. BJOG: An International Journal of Obstetrics and Gynaecology, 121(7), 876–888. https://doi.org/10.1111/1471-0528.12588
Briley, A., Seed, P. T., Tydeman, G., Ballard, H., Waterstone, M., Sandall, J., ... & Bewley, S. (2014). Reporting errors, incidence and risk factors for postpartum
haemorrhage and progression to severe PPH: a prospective observational study. BJOG: An International Journal of Obstetrics & Gynaecology, 121(7), 876-888.
Butwick, A. J., Ramachandran, B., Hegde, P., Riley, E. T., El-Sayed, Y. Y., & Nelson, L. M. (2017). Risk Factors for Severe Postpartum Hemorrhage After Cesarean Delivery: Case-Control Studies. Anesthesia and Analgesia, 125(2), 523–532.
https://doi.org/10.1213/ANE.0000000000001962
California Maternal Quality Care Collaborative. OB hemorrhage toolkit v2.0. 2015 [cited 2018 Apr 9] Available from: https://www.cmqcc.org/resources-tool-kits/toolkits/ob-hemorrhage-toolkit
Callaghan WM, Kuklina EV, Berg CJ. Trends in postpartum hemorrhage: United States, 1994-2006. Obstet Gynecol. 2010;202:353.e351-356
systematic review and meta-analysis. Plos One, 7(7), e41114. https://doi.org/10.1371/journal.pone.0041114
Catanzaro, D., Labbé, M., & Porretta, L. (2011). A class representative model for Pure Parsimony Haplotyping under uncertain data. Plos One, 6(3), e17937.
https://doi.org/10.1371/journal.pone.0017937
Choi, S., Shim, S., & Shin, Y. (2019). Neural Network Classifier-Based OPC With Imbalanced Training Data. IEEE Transactions on Computer-Aided Design of Integrated Circuits and Systems, 38(5), 938–948. https://doi.org/10.1109/TCAD.2018.2824255 Cleaning a messy dataset using Python - Well Red - Medium. (n.d.). Retrieved August 2, 2019, from
https://medium.com/well-red/cleaning-a-messy-dataset-using-python-7d7ab0bf199b
Creanga AA, Syverson C, Reed K, Callaghan WM. Pregnancy-related mortality in the United States, 2011-2013. Obstet Gynecol. 2017;130(2):366-373.
De Boer CN. The Aetiology of Post-partum Haemorrhage. BMJ. 1955;2:1187. pmid:13269828
Deffieux, X., Vinchant, M., Wigniolle, I., Goffinet, F., & Sentilhes, L. (2017). Maternal outcome after abdominal packing for uncontrolled postpartum hemorrhage despite peripartum hysterectomy. Plos One, 12(6), e0177092.
https://doi.org/10.1371/journal.pone.0177092
Della Torre M, Kilpatrick SJ, Hibbard JU, et al. Assessing preventability for obstetric hemorrhage. American journal of perinatology. Dec 2011;28(10):753-760.
32
visual perception in postpartum hemorrhage high fidelity simulation. Plos One, 14(8), e0221515. https://doi.org/10.1371/journal.pone.0221515
Dimension Reduction Techniques with Python - Towards Data Science. (n.d.). Retrieved August 2, 2019, from https://towardsdatascience.com/dimension-reduction-techniques-with-python-f36ca7009e5c
Dionne, M.-D., Deneux-Tharaux, C., Dupont, C., Basso, O., Rudigoz, R.-C., Bouvier-Colle, M.-H., & Le Ray, C. (2015). Duration of Expulsive Efforts and Risk of Postpartum Hemorrhage in Nulliparous Women: A Population-Based Study. Plos One, 10(11),
e0142171. https://doi.org/10.1371/journal.pone.0142171
Driessen, M., Bouvier-Colle, M.-H., Dupont, C., Khoshnood, B., Rudigoz, R.-C., Deneux-Tharaux, C., & Pithagore6 Group. (2011). Postpartum hemorrhage resulting from uterine atony after vaginal delivery: factors associated with severity. Obstetrics and Gynecology, 117(1), 21–31. https://doi.org/10.1097/AOG.0b013e318202c845
Exploratory Data Analysis: - Towards Data Science. (n.d.). Retrieved August 2, 2019, from https://towardsdatascience.com/exploratory-data-analysis-an-illustration-in-python-9926816d2556
Fan, D., Xia, Q., Liu, L., Wu, S., Tian, G., Wang, W., … Liu, Z. (2017). The Incidence of Postpartum Hemorrhage in Pregnant Women with Placenta Previa: A Systematic Review and Meta-Analysis. Plos One, 12(1), e0170194.
https://doi.org/10.1371/journal.pone.0170194
haemorrhage: A qualitative systematic review. Plos One, 14(5), e0215919. https://doi.org/10.1371/journal.pone.0215919
Fukami, T., Koga, H., Goto, M., Ando, M., Matsuoka, S., Tohyama, A., … Tsujioka, H. (2019). Incidence and risk factors for postpartum hemorrhage among transvaginal deliveries at a tertiary perinatal medical facility in Japan. Plos One, 14(1), e0208873. https://doi.org/10.1371/journal.pone.0208873
Ghosh, R., Spindler, H., Morgan, M. C., Cohen, S. R., Begum, N., Gore, A., … Walker, D. M. (2019). Diagnosis and management of postpartum hemorrhage and intrapartum asphyxia in a quality improvement initiative using nurse-mentoring and simulation in Bihar, India. Plos One, 14(7), e0216654. https://doi.org/10.1371/journal.pone.0216654 Gil-Rojas, Y., Lasalvia, P., Hernández, F., Castañeda-Cardona, C., & Rosselli, D. (2018). Cost-effectiveness of Carbetocin versus Oxytocin for Prevention of Postpartum
Hemorrhage Resulting from Uterine Atony in Women at high-risk for bleeding in Colombia. Revista Brasileira de Ginecologia e Obstetricia : Revista Da Federacao
Brasileira Das Sociedades de Ginecologia e Obstetricia, 40(5), 242–250. https://doi.org/10.1055/s-0038-1655747
Girault, A., Deneux-Tharaux, C., Sentilhes, L., Maillard, F., & Goffinet, F. (2018). Undiagnosed abnormal postpartum blood loss: Incidence and risk factors. Plos One, 13(1), e0190845. https://doi.org/10.1371/journal.pone.0190845
34
Grange, J., Chatellier, M., Chevé, M.-T., Paumier, A., Launay-Bourillon, C., Legendre, G., … Ducarme, G. (2018). Predictors of failed intrauterine balloon tamponade for persistent postpartum hemorrhage after vaginal delivery. Plos One, 13(10), e0206663. https://doi.org/10.1371/journal.pone.0206663
Having an Imbalanced Dataset? Here Is How You Can Fix It. (n.d.). Retrieved November 19, 2019, from https://towardsdatascience.com/having-an-imbalanced-dataset-here-is-how-you-can-solve-it-1640568947eb
How do you check the quality of your regression model in Python? (n.d.). Retrieved August 2, 2019, from https://towardsdatascience.com/how-do-you-check-the-quality-of-your-regression-model-in-python-fa61759ff685
Islam, Md. M., & Poly, T. N. (2019). Machine learning models of breast cancer risk prediction. BioRxiv. https://doi.org/10.1101/723304
Kalafat, E., Gokce, A., O’Brien, P., Benlioglu, C., Koc, A., Karaaslan, O., & Khalil, A. (2019). Efficacy of carbetocin in the prevention of postpartum hemorrhage: a systematic review and Bayesian meta-analysis of randomized trials. The Journal of Maternal-Fetal & Neonatal Medicine, 1–14. https://doi.org/10.1080/14767058.2019.1664463
Kavakiotis, I., Tsave, O., Salifoglou, A., Maglaveras, N., Vlahavas, I., & Chouvarda, I. (2017). Machine learning and data mining methods in diabetes research. Computational and Structural Biotechnology Journal, 15, 104–116.
https://doi.org/10.1016/j.csbj.2016.12.005
intervention at selected hospitals, Southern Ethiopia. Plos One, 14(10), e0224579. https://doi.org/10.1371/journal.pone.0224579
Kerr RS, Weeks AD. Postpartum haemorrhage: a single definition is no longer enough. BJOG. 2017;124(5):723–6. Epub 2016/11/26. pmid:27885797.
Khireddine, I., Le Ray, C., Dupont, C., Rudigoz, R.-C., Bouvier-Colle, M.-H., &
Deneux-Tharaux, C. (2013). Induction of labor and risk of postpartum hemorrhage in low risk parturients. Plos One, 8(1), e54858. https://doi.org/10.1371/journal.pone.0054858 Kramer, M. S., Berg, C., Abenhaim, H., Dahhou, M., Rouleau, J., Mehrabadi, A., & Joseph, K. S. (2013). Incidence, risk factors, and temporal trends in severe postpartum hemorrhage. American Journal of Obstetrics and Gynecology, 209(5), 449.e1-7. https://doi.org/10.1016/j.ajog.2013.07.007
Kramer, M. S., Berg, C., Abenhaim, H., Dahhou, M., Rouleau, J., Mehrabadi, A., & Joseph, K. S. (2013). Incidence, risk factors, and temporal trends in severe postpartum hemorrhage. American journal of obstetrics and gynecology, 209(5), 449-e1.
Learning Feature Selection for Building and Improving your Machine Learning Model. (n.d.). Retrieved August 2, 2019, from https://medium.com/analytics-vidhya/feature-selection-for-building-and-improving-your-machine-learning-model-e3a81b79487
Li, J., Wang, L., Zhang, X., Liu, L., Li, J., Chan, M. F., … Yang, R. (2019). Machine Learning for Patient-Specific Quality Assurance of VMAT: Prediction and Classification Accuracy. International Journal of Radiation Oncology, Biology, Physics.
https://doi.org/10.1016/j.ijrobp.2019.07.049
36
Postpartum Hemorrhage in Uganda. Plos One, 10(11), e0142550. https://doi.org/10.1371/journal.pone.0142550
Lyndon A, McNulty J, VanderWal B, et al. OB hemorrhage toolkit v2.0.: cumulative quantitative assessment of blood loss. California Maternal Quality Care Collaborative 2015 [cited 2018 Jun 4] Available from: https://www.cmqcc.org/resource/ob-hem-cumulative-quantitative-assessment-blood-loss
Machine Learning Algorithms Comparison - FinTechExplained - Medium. (n.d.). Retrieved August 2, 2019, from https://medium.com/fintechexplained/machine-learning-algorithm-comparison-f14ce372b855
Magann, E. F., Evans, S., Hutchinson, M., Collins, R., Howard, B. C., & Morrison, J. C. (2005). Postpartum hemorrhage after vaginal birth: an analysis of risk factors. Southern Medical Journal, 98(4), 419–422. https://doi.org/10.1097/01.SMJ.0000152760.34443.86 Mambou, S., Krejcar, O., Maresova, P., Selamat, A., & Kuca, K. (2019). Novel four stages classification of breast cancer using infrared thermal imaging and a deep learning model. In I. Rojas, O. Valenzuela, F. Rojas, & F. Ortuño (Eds.), Bioinformatics and Biomedical Engineering: 7th International Work-Conference, IWBBIO 2019, Granada, Spain, May 8-10, 2019, Proceedings, Part II (pp. 63–74). https://doi.org/10.1007/978-3-030-17935-9_7
Mani, S., Chen, Y., Elasy, T., Clayton, W., & Denny, J. (2012). Type 2 diabetes risk forecasting from EMR data using machine learning. AMIA Annual Symposium Proceedings, 2012, 606–615.
National Initiative to reduce postpartum hemorrhage. BMC Pregnancy and Childbirth, 19(1), 379. https://doi.org/10.1186/s12884-019-2502-5
Menard MK, Main EK, Currigan SM. Executive summary of the reVITALize initiative: standardizing obstetric data definitions. Obstet Gynecol. 2014;124(1):150–3. Epub 2014/06/06. pmid:24901267.
Miller, C. M., Cohn, S., Akdagli, S., Carvalho, B., Blumenfeld, Y. J., & Butwick, A. J. (2017). Postpartum hemorrhage following vaginal delivery: risk factors and maternal outcomes. Journal of Perinatology, 37(3), 243–248. https://doi.org/10.1038/jp.2016.225 Monticelli, L. S., Nguyen, L. T. H., Amiens-Desneux, E., Luo, C., Lavoir, A.-V., Gatti, J.-L., & Desneux, N. (2019). The preference-performance relationship as a means of classifying parasitoids according to their specialization degree. Evolutionary
Applications, 12(8), 1626–1640. https://doi.org/10.1111/eva.12822
Multi-Class classification with Sci-kit learn & XGBoost: A case study using Brainwave data. (n.d.). Retrieved August 2, 2019, from https://medium.com/free-code-camp/multi-
class-classification-with-sci-kit-learn-xgboost-a-case-study-using-brainwave-data-363d7fca5f69
My Compilation of Simple Yet Practical Data Cleaning Codes. (n.d.). Retrieved August 2, 2019, from https://towardsdatascience.com/my-compilation-of-simple-yet-practical-data-cleaning-codes-d692ec20dca8
38
Ngwenya, S. (2016). Postpartum hemorrhage: incidence, risk factors, and outcomes in a low-resource setting. International Journal of Women’s Health, 8, 647–650.
https://doi.org/10.2147/IJWH.S119232
Nyfløt, L. (2016). Risk factors for severe PPH. Figshare. https://doi.org/10.6084/m9.figshare.4042839.v1
Nyfløt, L. T., Sandven, I., Stray-Pedersen, B., Pettersen, S., Al-Zirqi, I., Rosenberg, M., … Vangen, S. (2017). Risk factors for severe postpartum hemorrhage: a case-control study. BMC Pregnancy and Childbirth, 17(1), 17. https://doi.org/10.1186/s12884-016-1217-0
OB Hemorrhage Toolkit V 2.0 | California Maternal Quality Care Collaborative. (n.d.). Retrieved October 21, 2019, from https://www.cmqcc.org/resources-tool-kits/toolkits/ob-hemorrhage-toolkit
Oyelese, Y., & Ananth, C. V. (2010). Postpartum hemorrhage: epidemiology, risk factors, and causes. Clinical obstetrics and gynecology, 53(1), 147-156.
Palm C, Rydhstroem H. Association of blood loss during delivery to B-hemoglobin. Gynecol Obstet Invest. 1997;44(3):163–8. Epub 1997/01/01. pmid:9359641.
Peng, L., & Lei, L. (2005). A review of missing data treatment methods. Intelligent Information Management Systems and Technologies, 1(3), 412-419.
Prata, N., Hamza, S., Bell, S., Karasek, D., Vahidnia, F., & Holston, M. (2011). Inability to predict postpartum hemorrhage: insights from Egyptian intervention data. BMC Pregnancy and Childbirth, 11, 97. https://doi.org/10.1186/1471-2393-11-97
Prayogo, D., Cheng, M.-Y., Wu, Y.-W., & Tran, D.-H. (2019). Combining machine learning models via adaptive ensemble weighting for prediction of shear capacity of reinforced-concrete deep beams. Engineering with Computers, 1–19.
https://doi.org/10.1007/s00366-019-00753-w
Predicting bike sharing trends with Python - Wilame Lima Vallantin - Medium. (n.d.). Retrieved August 2, 2019, from https://medium.com/@wilamelima/analysing-bike-sharing-trends-with-python-a9f574c596b9
Principal Component Analysis for Dimensionality Reduction. (n.d.). Retrieved August 2, 2019, from
https://towardsdatascience.com/principal-component-analysis-for-dimensionality-reduction-115a3d157bad
Pritchard JA. Changes in the Blood Volume during Pregnancy and Delivery. Anesthesiology. 1965;26:393–9. Epub 1965/07/01. pmid:14313451.
Rousseau, A., Rozenberg, P., Perrodeau, E., & Ravaud, P. (2018). Variation in severe postpartum hemorrhage management: A national vignette-based study. Plos One, 13(12), e0209074. https://doi.org/10.1371/journal.pone.0209074
40
Postpartum Hemorrhage. Plos One, 11(3), e0151998. https://doi.org/10.1371/journal.pone.0151998
Rousseau, A., Rozenberg, P., Perrodeau, E., Deneux-Tharaux, C., & Ravaud, P. (2016b). Variations in Postpartum Hemorrhage Management among Midwives: A National Vignette-Based Study. Plos One, 11(4), e0152863.
https://doi.org/10.1371/journal.pone.0152863
Say L, Chou D, Gemmill A, Tuncalp O, Moller AB, Daniels J, et al. Global causes of maternal death: a WHO systematic analysis. Lancet Glob Health. 2014;2(6):e323–33. Epub 5 May 2014. pmid:25103301.
scikit-learn-contrib/boruta_py: Python implementations of the Boruta all-relevant feature selection method. (n.d.). Retrieved September 12, 2019, from https://github.com/scikit-learn-contrib/boruta_py
Sheiner, E., Sarid, L., Levy, A., Seidman, D. S., & Hallak, M. (2005). Obstetric risk factors and outcome of pregnancies complicated with early postpartum hemorrhage: a population-based study. The Journal of Maternal-Fetal & Neonatal Medicine, 18(3), 149– 154. https://doi.org/10.1080/14767050500170088
Sorichetta, A., Hornby, G. M., Stevens, F. R., Gaughan, A. E., Linard, C., & Tatem, A. J. (2015). High-resolution gridded population datasets for Latin America and the Caribbean in 2010, 2015, and 2020. Scientific Data, 2, 150045.
https://doi.org/10.1038/sdata.2015.45
Stanton, C. K., Newton, S., Mullany, L. C., Cofie, P., Tawiah Agyemang, C., Adiibokah, E., … Owusu-Agyei, S. (2013). Effect on postpartum hemorrhage of prophylactic
community-based, cluster-randomized trial. PLoS Medicine, 10(10), e1001524. https://doi.org/10.1371/journal.pmed.1001524
Stevens, F. R., Gaughan, A. E., Linard, C., & Tatem, A. J. (2015). Disaggregating census data for population mapping using random forests with remotely-sensed and ancillary data. Plos One, 10(2), e0107042. https://doi.org/10.1371/journal.pone.0107042 Stones, R. W., Paterson, C. M., & Saunders, N. J. S. (1993). Risk factors for major obstetric haemorrhage. European Journal of Obstetrics & Gynecology and Reproductive Biology, 48(1), 15-18.
Takamatsu, M., Yamamoto, N., Kawachi, H., Chino, A., Saito, S., Ueno, M., …
Takeuchi, K. (2019). Prediction of early colorectal cancer metastasis by machine learning using digital slide images. Computer Methods and Programs in Biomedicine, 178, 155– 161. https://doi.org/10.1016/j.cmpb.2019.06.022
Tessier, V., & Pierre, F. (2004). Risk factors of postpartum hemorrhage during labor and clinical and pharmacological prevention. Journal de gynecologie, obstetrique et biologie de la reproduction, 33(8 Suppl), 4S29-4S56.
The Hitchhiker’s Guide to Feature Extraction – Towards Data Science. (n.d.). Retrieved June 7, 2019, from https://towardsdatascience.com/the-hitchhikers-guide-to-feature-
extraction-b4c157e96631?source=bookmarks---0---&gi=f2450c6c3b8b
Theobald GW. Post-partum Haemorrhage. Br Med J. 1950;1(4654):659–61. Epub 1950/03/18. pmid:20787812; PubMed Central PMCID: PMC2037136.
42
Computational and Mathematical Methods in Medicine, 2019, 6915850. https://doi.org/10.1155/2019/6915850
Turki, T., & Taguchi, Y. (2019). Machine learning algorithms for predicting drugs– tissues relationships. Expert Systems with Applications, 127, 167–186.
https://doi.org/10.1016/j.eswa.2019.02.013
UNC Chapel Hill School of Medicine. Peripartum hemorrhage protocol. 2017 Jun [cited 2018 Jul 3]. Available from:
https://www.mombaby.org/wpcontent/uploads/2017/03/Peripartum-Hemorrhage-Protocol.pdf
What Steps should one take while doing Data Preprocessing? - By Mohit Sharma. (n.d.). Retrieved August 16, 2019, from https://hackernoon.com/what-steps-should-one-take-while-doing-data-preprocessing-502c993e1caa
WHO. WHO recommendations for the prevention and treatment of postpartum
haemorrhage. Geneva: Dept. of Reproductive Health and Research, WHO, 2012 ISBN: 978 92 4 154850 2.
Winikoff B, Dabash R, Durocher J, Darwish E, Nguyen TN, Leon W, et al. Treatment of post-partum haemorrhage with sublingual misoprostol versus oxytocin in women not exposed to oxytocin during labour: a double-blind, randomised, non-inferiority trial. Lancet. 2010;375(9710):210–6. Epub 6 Jan 2010. pmid:20060161.