A S S O C I A T I O N S T U D I E S A R T I C L E
Transancestral
fi
ne-mapping of four type 2 diabetes
susceptibility loci highlights potential causal regulatory
mechanisms
Momoko Horikoshi
1,2
, Lorenzo Pasquali
3,4,5
, Steven Wiltshire
1,2,
†
, Jeroen R.
Huyghe
6
, Anubha Mahajan
1
, Jennifer L. Asimit
7
, Teresa Ferreira
1
, Adam E.
Locke
6
, Neil R. Robertson
1,2
, Xu Wang
8
, Xueling Sim
6,8
, Hayato Fujita
10
, Kazuo
Hara
11
, Robin Young
13
, Weihua Zhang
14,15
, Sungkyoung Choi
20
, Han Chen
22,23
,
Ismeet Kaur
24
, Fumihiko Takeuchi
25
, Pierre Fontanillas
26
, Dorothée Thuillier
27
,
Loic Yengo
27
, Jennifer E. Below
28
, Claudia H.T. Tam
29
, Ying Wu
32
, T2D-GENES
Consortium, Gonçalo Abecasis
6
, David Altshuler
26,33,34,35,36,37
, Graeme I. Bell
40
,
John Blangero
41
, Noél P. Burtt
26
, Ravindranath Duggirala
41
, Jose C.
Florez
26,37,35,38
, Craig L. Hanis
28
, Mark Seielstad
42,43
, Gil Atzmon
44,45
, Juliana C.
N. Chan
29,30,31
, Ronald C.W. Ma
29,30,31
, Philippe Froguel
16,27
, James G. Wilson
46
,
Dwaipayan Bharadwaj
24,47
, Josee Dupuis
23,48
, James B. Meigs
35,39
, Yoon Shin
Cho
49
, Taesung Park
20,21
, Jaspal S. Kooner
14,17,18
, John C. Chambers
14,15,18
,
Danish Saleheen
50
, Takashi Kadowaki
11,12
, E. Shyong Tai
8,9,51
, Karen L.
Mohlke
32
, Nancy J. Cox
52
, Jorge Ferrer
5,53,19
, Eleftheria Zeggini
7
, Norihiro Kato
25
,
Yik Ying Teo
8,54,55
, Michael Boehnke
6,
‡
, Mark I. McCarthy
1,2,56,
‡
and Andrew
P. Morris
1,57,
‡
,
*
1
Wellcome Trust Centre for Human Genetics, Nuf
fi
eld Department of Medicine, University of Oxford, Oxford, UK,
2Oxford Centre for Diabetes, Endocrinology and Metabolism, Radcliffe Department of Medicine, University of
Oxford, Oxford, UK,
3Program of Predictive and Personalized Medicine of Cancer (PMPPC), Germans Trias i Pujol
University Hospital and Research Institute, Badalona, Spain,
4Josep Carreras Leukaemia Research Institute,
Badalona, Spain,
5CIBER de Diabetes y Enfermedades Metabólicas Asociadas (CIBERDEM), Barcelona, Spain,
6Department of Biostatistics and Center for Statistical Genetics, University of Michigan, Ann Arbor, MI, USA,
7
Department of Human Genetics, Wellcome Trust Sanger Institute, Hinxton, Cambridgeshire, UK,
8Saw Swee
†Deceased.
‡These authors jointly supervised this work.
Received:October 13, 2015.Revised:January 29, 2016.Accepted:February 15, 2016 © The Author 2016. Published by Oxford University Press.
This is an Open Access article distributed under the terms of the Creative Commons Attribution License (http://creativecommons.org/licenses/by/4.0/), which permits unrestricted reuse, distribution, and reproduction in any medium, provided the original work is properly cited.
doi: 10.1093/hmg/ddw048
Advance Access Publication Date: 23 February 2016 Association Studies Article
Human Molecular Genetics, 2016, Vol. 25, No. 10 2070–2081
Hock School of Public Health,
9Department of Medicine, Yong Loo Lin School of Medicine, National University of
Singapore, National University Health System, Singapore, Singapore,
10Department of Diabetes and
Endocrinology, JR Tokyo General Hospital, Tokyo, Japan,
11Department of Diabetes and Metabolic Diseases,
Graduate School of Medicine and
12Department of Integrated Molecular Science on Metabolic Diseases, 22nd
Century Medical and Research Center, The University of Tokyo, Tokyo, Japan,
13Department of Public Health and
Primary Care, Institute of Public Health, University of Cambridge, Cambridge, UK,
14Department of Cardiology,
Ealing Hospital NHS Trust, Southall, Middlesex, UK,
15Department of Epidemiology and Biostatistics,
16
Department of Genomics of Common Disease, School of Public Health,
17National Heart and Lung Institute,
Cardiovascular Sciences, Hammersmith Campus,
18Imperial College Healthcare NHS Trust, and
19Department of
Medicine, Imperial College London, London, UK,
20Interdisciplinary Program in Bioinformatics and
21Department
of Statistics, Seoul National University, Seoul, Republic of Korea,
22Department of Biostatistics, Harvard School of
Public Health, Boston, MA, USA,
23Department of Biostatistics, Boston University School of Public Health, Boston,
MA, USA,
24Genomics and Molecular Medicine, CSIR-Institute of Genomics & Integrative Biology, New Delhi,
India,
25Department of Gene Diagnostics and Therapeutics, Research Institute, National Center for Global Health
and Medicine, Tokyo, Japan,
26Program in Medical and Population Genetics, Broad Institute, Cambridge, MA, USA,
27Integrative Genomics and Modelization of Metabolic Diseases CNRS UMR8199, Lille Institute of Biology, E.G.I.D
–
FR3508 European Genomics Institute of Diabetes, Lille, France,
28Human Genetics Center, School of Public Health,
University of Texas Health Science Center at Houston, Houston, TX, USA,
29Department of Medicine and
Therapeutics,
30Hong Kong Institute of Diabetes and Obesity, and
31Li Ka Shing Institute of Health Sciences,
Chinese University of Hong Kong, Hong Kong, China,
32Department of Genetics, University of North Carolina,
Chapel Hill, NC, USA,
33Department of Biology, Massachusetts Institute of Technology, Cambridge, MA, USA,
34Department of Genetics and
35Department of Medicine, Harvard Medical School, Boston, MA, USA,
36Department of Molecular Biology,
37Diabetes Research Center (Diabetes Unit), Department of Medicine,
38Center
for Human Genetic Research, Department of Medicine, and
39General Medicine Division, Massachusetts General
Hospital, Boston, MA, USA,
40Departments of Medicine and Human Genetics, University of Chicago, Chicago, IL,
USA,
41Department of Genetics, Texas Biomedical Research Institute, Houston, TX, USA,
42Blood Systems
Research Institute, San Francisco, CA, USA,
43Department of Laboratory Medicine and Institute for Human
Genetics, University of California, San Francisco, San Francisco, CA, USA,
44Department of Natural Science,
University of Haifa, Haifa, Israel,
45Departments of Medicine and Genetics, Albert Einstein College of Medicine,
New York, USA,
46Department of Physiology and Biophysics, University of Mississippi Medical Center, Jackson,
MS, USA,
47School of Biotechnology, Jawaharlal Nehru University, New Delhi, India,
48National Heart, Lung, and
Blood Institute
’
s Framingham Heart Study, Framingham, MA, USA,
49Department of Biomedical Science, Hallym
University, Chuncheon, Republic of Korea,
50Department of Biostatistics and Epidemiology, Center for
Non-Communicable Diseases, University of Pennsylvania, Philadelphia, PA, USA,
51Cardiovascular & Metabolic
Disorders Program, Duke-NUS Graduate Medical School Singapore, Singapore,
52School of Medicine, Vanderbilt
University, Nashville, TN, USA,
53Genomic Programming of Beta-cells Laboratory, Institut d
’
Investigacions
August Pi i Sunyer (IDIBAPS), Barcelona, Spain,
54Life Sciences Institute and
55Department of Statistics and
Applied Probability, National University of Singapore, Singapore,
56Oxford NIHR Biomedical Research Centre,
Oxford University Hospitals Trust, Oxford, UK and
57Department of Biostatistics, University of Liverpool,
Liverpool, UK
*To whom correspondence should be addressed at: Department of Biostatistics, University of Liverpool, Block F, Waterhouse Building, 1-5 Brownlow Street, Liverpool L69 3GL, UK. Tel: +44(0) 1517949756; Fax: +44(0)1517065932; Email [email protected]
Abstract
genomic annotation can highlight potential causal regulatory elements in T2D-relevant tissues. These analyses provide insight into the mechanisms through which T2D association signals are mediated, and suggest future routes to understanding the biology of specific disease susceptibility loci.
Introduction
Genome-wide association studies (GWAS) of type 2 diabetes (T2D) have been extremely successful in identifying loci contrib-uting genetic effects to disease susceptibility in multiple ancestry groups (1–5). These loci are typically characterized by common variant association signals, defined by a lead single-nucleotide polymorphism (SNP) with minor allele frequency (MAF) of at least 5%, in the ancestry group in which it was discovered. The as-sociation signals often map to large genomic intervals because of extensive linkage disequilibrium (LD) between common variants within populations from the same ancestry group, making local-ization and identification of causal alleles at T2D susceptibility loci extremely challenging. Consequently, there has been limited progress in defining the molecular mechanisms through which the effects of GWAS loci on disease are mediated.
There is increasing evidence, however, that T2D association signals discovered in one ancestry group are transferrable across diverse populations (6–9). For the majority of established T2D susceptibility loci, common variant association signals are shared across ancestries. Furthermore, there is limited evidence across populations of heterogeneity in the allelic effects of lead SNPs identified through transancestral meta-analysis (10). This observation is consistent with a model in which the underlying causal variants are shared across ancestry groups, and thus arose prior to human population migration out of Africa. Under this assertion, we expect to enhance thefine-mapping resolution of causal alleles by combining GWAS across ancestry groups be-cause of the increased sample size and as a result of differences in the structure of LD between diverse populations (11–13).
To harness the power of transancestralfine-mapping for lo-calizing potential causal variants for T2D susceptibility, we have undertaken meta-analysis of GWAS in 22 086 cases and 42 539 controls fromfive ancestry groups: East Asian, European, South Asian, African American and Mexican American (Supple-mentary Material, Table S1). We focussed on four loci, mapping to/nearCDKAL1,CDKN2A-B,IGF2BP2andKCNQ1, because they harbour the strongest signals of association across diverse ances-tries, with no evidence of heterogeneity in allelic effects between populations (10). Previous ancestry-specific meta-analyses have reported lead SNPs attaining genome-wide significance (P< 5 × 10⁻⁸) at all four loci in European and East Asian descent popula-tions (3,4), and atKCNQ1, also in African Americans (5). All four of the loci have a primary physiological impact on T2D susceptibil-ity viaβ-cell dysfunction (4), and thus might be expected, a priori, to share similar mechanisms through which the GWAS signals are mediated.
Previous transancestral GWAS meta-analyses for T2D suscep-tibility (10) have been limited by imputation up to the relatively sparse reference panels from the International HapMap Consor-tium (14), which provides limited coverage of variation with MAF <5% across diverse populations. To improvefine-mapping reso-lution, we have undertaken imputation of each study up to the ‘all ancestries’reference panel from the 1000 Genomes Project Consortium (15) (Phase 1 integrated release, March 2012) across the four loci. With these data, we aimed to: (i) statistically delin-eate distinct association signals arising from multiple causal var-iants in each locus through conditional analyses; (ii) re-evaluate
the evidence for heterogeneity in allelic effects between ancestry groups for each distinct association signal; (iii) construct credible sets of variants that are most likely to drive each distinct associ-ation signal and thus most likely to incorporate causal alleles; and (iv) interrogate credible set variants for predicted functional annotation and regulatory sites in relevant tissues ( primarily pancreatic isletβ-cells) to provide insight into the potential cau-sal mechanisms through which the effects of each distinct asso-ciation signal on T2D susceptibility are mediated.
Results
Study overview
We considered a total of 18 studies, genotyped with a range of GWAS arrays, in 22 086 T2D cases and 42 539 controls (Supple-mentary Material, Table S1): seven of East Asian ancestry (9867 cases and 12 870 controls),five of European ancestry (4555 cases and 12 932 controls), four of South Asian ancestry (6196 cases and 13 775 controls), one of African American ancestry (631 cases and 2526 controls) and one of Mexican American ancestry (837 cases and 436 controls). At each of the four loci, the GWAS scaffold in each study was imputed up to the‘all ancestries’Phase 1 inte-grated reference panel (March 2012 release) from the 1000 Gen-omes Project Consortium (15) using IMPUTEv2 (16) or minimac (17). We excluded variants with MAF <1% from each study, after imputation, because our focus was on common and low-fre-quency association signals that are shared across diverse popula-tions, and thus amenable to transancestralfine-mapping to improve localization of causal variants. We then retained ‘well-imputed’variants, defined as attaining widely used thresholds (18) of IMPUTEv2 info≥0.4 or minimacr2≥0.3, for downstream association analyses.
We began, in each study, by testing for association of T2D with each variant (MAF≥1% and passing imputation quality control) across the four loci (Materials and Methods, Supplementary Material, Table S2). Variants passing quality control in <80% of the total sample size (i.e. in <51 700 individuals) were excluded from the transancestral meta-analysis. Our primary analysis combined association summary statistics across studies using MANTRA (19). This Bayesian method has been designed for transancestral meta-analysis andfine-mapping by allowing for heterogeneity in allelic odds ratios (ORs) between studies. Such heterogeneity can arise as a result of differential patterns of LD with a shared causal variant between diverse populations from distinct ancestry groups. However MANTRA can also allow for heterogeneity in allelic ORs arising from genuine effect size dif-ferences between ancestry groups, including the possibility of interaction with environmental risk factors that differ in expos-ure between diverse populations, or variable phenotype defi n-ition or ascertainment strategies across studies.
mean allele frequency across variants at the four loci, and high-lighted three distinct ancestral clades (Supplementary Material, Fig. S1): (i) a single African American study (AfAm); (ii) a cluster of studies of East Asian ancestry (EAsia) and (iii) a cluster of stud-ies of European, Mexican American and South Asian ancestry (Eur-MexAm-SAsia). The evidence in favour of association from MANTRA is measured by means of a Bayes’factor (BF). For com-pleteness, we also combined association summary statistics across studies through traditionalfixed-effects meta-analysis, which makes the limiting assumption of no heterogeneity in allelic ORs between studies (Materials and Methods).
Identification of distinct association signals
There is increasing evidence of multiple‘distinct’association sig-nals at established T2D susceptibility loci, each arising as a result of different causal variants acting independently or,in cis, on the same haplotype (4). Thefirst stage in comprehensivefi ne-mapping of GWAS loci is thus to disentangle, statistically, these distinct association signals, and to localize the causal variants for each, in turn, on the basis of conditional analyses. In this framework, each distinct association signal can be represented by an‘index variant’, here required to attain genome-wide sig-nificant evidence of association (MANTRA log10BF≥6 andfi xed-effectsP< 5 × 10⁻⁸) in conditional transancestral meta-analysis (Materials and Methods). Across the four loci, we identified a total of seven distinct signals of association, three mapping to
KCNQ1, two toCDKN2A-Band one each atIGF2BP2andCDKAL1
(Table1).
The association of variants mapping to theKCNQ1locus with T2D susceptibility was initially established in GWAS of East Asian ancestry, and was localized to a <50 kb intronic region of the gene (21,22). Association of variants in this interval have been widely replicated, at genome-wide significance, across GWAS from mul-tiple populations (3,4,5,10). However, the lead SNPs from East Asian and European ancestry meta-analyses are in only weak LD with each other (rs2237896 and rs163184, respectively; CEU
r2= 0.027, CHB + JPTr2= 0.395). Meta-analyses of European ances-try GWAS (4,23) have also identified an additional association sig-nal at this locus,∼150 kb upstream of the recombination interval described above, and mapping to theKCNQ1-OT1transcript that controls regional imprinting (24). Through exact conditioning, our transancestral meta-analysis has formally demonstrated that the association at this locus can be delineated by three distinct signals (Supplementary Material, Fig. S2), two localized to the <50 kbKCNQ1intronic recombination interval (rs2237897, MANTRA log10BF = 9.79, P= 7.7 × 10⁻¹²; rs233448, MANTRA log10BF = 9.65, P= 9.5 × 10⁻¹²) and one mapping toKCNQ1-OT1
(rs231353, MANTRA log10BF = 9.29,P= 1.7 × 10⁻¹¹). After account-ing for these three index variants in conditional analyses, no re-sidual association signal attains genome-wide significance (maximum MANTRA log10BF = 3.38,P= 2.1 × 10⁻⁵, rs223448).
At theCDKN2A-Blocus, association of T2D susceptibility with variants localized to a 12 kb intergenic recombination interval wasfirst reported in GWAS of European descent (25), and then widely replicated across ancestry groups (3,4,5,10). Haplotype analyses have revealed that the association signal can best be explained by two partially correlated SNPs (rs10811661 and rs10757282, CEUr2= 0.360) in the recombination interval, acting together,in cis, to impact disease risk (25–27). European ancestry GWAS have also previously hinted at a distinct association signal at this locus, mapping to the non-codingCDKN2B-AS1(ANRIL) transcript (4). Through exact conditioning, our transancestral meta-analysis has demonstrated that the association at this locus can be delineated by two distinct signals (Supplementary Material, Fig. S3), both of which map to the 12 kb intergenic re-combination interval described above (rs10965246, MANTRA log10BF = 37.45, P= 8.4 × 10−40; rs10757282, MANTRA log10BF = 10.31,P= 2.0 × 10⁻¹²). Furthermore, our results highlight that these two index variants are sufficient to fully explain the association across the locus, including that previously localized to CDKN2B-AS1 (maximum MANTRA log10BF = 1.88, P= 0.21, rs10811649).
Evaluation of heterogeneity in association signals between ancestry groups
We next sought to evaluate the evidence for heterogeneity in al-lelic effects between studies for the index variants for the seven distinct association signals across the four loci on the basis of the transancestral meta-analysis (Materials and Methods). We ob-served no substantial differences in allelic OR, within or between ancestry groups, for any association signal (assessed by MANTRA log10BF of heterogeneity or Cochran’sQstatistic from thefi xed-effects meta-analysis). Any apparent differences in the magni-tude of an association signal between ancestral clades, as mea-sured by means of the log10BF orP-value, can be explained by differences in the allele frequency of the index variant between the diverse populations contributing to the meta-analysis (Sup-plementary Material, Table S3). For example, the index variant rs2237897, mapping to theKCNQ1locus, demonstrates a stronger signal of association after conditional analysis in the EAsia clade (MANTRA log10BF = 5.55,fixed-effectsP= 2.0 × 10⁻⁷) than the Eur-MexAm-SAsia clade (MANTRA log10BF = 4.04,fixed-effectsP= 4.4 × 10⁻⁶), despite much smaller total sample size. However, the minor allele is at much lower frequency in European, Mexican
Table 1.Summary statistics from the conditional transancestral meta-analysis (22 086 cases and 42 539 controls) for distinct T2D association
signals at each locus
Locus Index SNP Chr Position (b37)
Alleles Mean (range)r2 or info
MANTRA Fixed-effects meta-analysis Risk Other Log10BF Log10BF
heterogeneity
OR (95% CI) P-value Cochran’sQ P-value
IGF2BP2 rs11705729 3 185 507 299 T C 0.96 (0.74–1.00) 19.35 −0.05 1.14 (1.11–1.17) 1.3 × 10⁻²¹ 0.49
CDKAL1 rs9368222 6 20 686 996 A C 0.97 (0.74–1.00) 28.84 0.99 1.17 (1.14–1.21) 4.1 × 10⁻³⁰ 0.0058
CDKN2A-B rs10965246 9 22 132 698 T C 0.94 (0.79–1.00) 37.45 −0.03 1.31 (1.26–1.36) 8.4 × 10−40 0.0029 rs10757282 9 22 133 984 C T 0.92 (0.32–1.00) 10.31 0.01 1.12 (1.09–1.16) 2.0 × 10⁻¹² 0.17
KCNQ1 rs231353 11 2 709 019 G A 0.93 (0.68–0.99) 9.29 −0.13 1.11 (1.07–1.14) 1.7 × 10⁻¹¹ 0.79 rs233448 11 2 840 424 C T 0.94 (0.84–1.00) 9.65 0.14 1.12 (1.09–1.16) 9.5 × 10⁻¹² 0.18 rs2237897 11 2 858 546 C T 0.75 (0.35–0.97) 9.79 0.17 1.19 (1.14–1.26) 7.7 × 10⁻¹² 0.35
American and South Asian ancestry populations (MAF = 0.05) than in those of East Asian descent (MAF = 0.35), resulting in re-duced power to detect association for the same allelic effect size.
Localization of variants driving T2D association signals
We next constructed‘credible sets’of SNPs (27) that are most like-ly to drive each of the seven distinct signals at the four loci on the basis of their posterior probability of driving the association (πC) from the MANTRA transancestral meta-analysis (Materials and Methods, Table2, Supplementary Material, Table S4). Assuming that the variant driving the association signal has been imputed from the 1000G reference panel, the probability that it will be con-tained in the 99% credible set is 0.99. Smaller credible sets, in terms of the number of SNPs they contain, or the genomic inter-val that they cover, thus correspond tofine-mapping at higher resolution. To assess the improvements in the resolution of fine-mapping offered by transancestral meta-analysis, we com-pared the properties of the 99% credible set for each of the seven distinct association signals obtained from: (i) studies in the EAsia clade only; (ii) studies in the Eur-MexAm-SAsia clade only and (iii) studies from all populations, combining the two clades with the single African American study. Note that we have not reported summary statistics for the 99% credible sets for the African American study alone because the small sam-ple size makes comparison offine-mapping intervals with the EAsia and Eur-MexAm-SAsia clades meaningless.
For each of the seven distinct association signals,fi ne-map-ping resolution was improved after transancestral meta-analysis when compared with either ancestral clade, in terms of the number of SNPs reported in the credible set and/or the genomic interval that they cover (Table2). These improvements in reso-lution could occur as a result of increased sample size, or because of differences in the structure of LD between diverse populations, but distinguishing between these possibilities is not straightfor-ward. One approach is to quantify the extent of LD variation at a locus between pairs of populations by means of the varLD statis-tic (28). Using CEU, YRI and CHB + JPT reference haplotypes from the International HapMap Consortium (14) as representative of populations of European, African and East Asian ancestry, respectively, theCDKAL1locus has the greatest extent of LD vari-ation among those investigated here, and thus would be ex-pected to be most amenable to transancestralfine-mapping (28). At this locus, the 99% credible set for the association signal after transancestral meta-analysis included justfive SNPs map-ping to 12.3 kb, compared with 15 SNPs mapmap-ping to 34.4 kb in the EAsia clade, and eight SNPs mapping to 40.4 kb in the Eur-MexAm-SAsia clade (Fig.1). The transancestral credible set corresponds to the overlap of SNPs from the two ancestral clades,
and represents those that are in strong LD with the index variant (rs9368222) in East Asian and European descent populations. In contrast, the extent of variation in LD between CEU, YRI and CHB + JPT reference haplotypes from Phase II HapMap is lower at the
IGF2BP2locus (28), where the improvement in the resolution of fine-mapping after transancestral meta-analysis is less apparent (Table2). Variants in the 99% credible set for this association sig-nal after transancestral meta-asig-nalysis are in strong LD with the lead SNP in both East Asian and European descent populations (CEU and CHB + JPTr2> 0.7), so there is less gain forfine-mapping over the EAsia and Eur-MexAm-SAsia clades.
After transancestral meta-analysis, the most precise localiza-tion was observed for two of the associalocaliza-tion signals at theKCNQ1
locus, indexed by rs2237897 (3 SNPs mapping to 197 bp of the nar-row intronic recombination interval) and rs231353 (3 SNPs map-ping to 17.5 kb ofKCNQ1-OT1). The 99% credible sets for both association signals at theCDKN2A-Blocus include a total of 12 non-overlapping SNPs mapping to the same <5 kb interval. We interrogated the 99% credible sets for all seven distinct associ-ation signals at the four loci for functional annotassoci-ation. Despite the high-resolution of fine-mapping for all but the IGF2BP2
association signal, the credible sets do not include any coding variants. These data are thus consistent with previous genome-wide reports that association signals for complex human traits at GWAS loci are most likely to be mediated through gene regula-tion (29,30).
Regulatory mechanisms through which credible set variants influence T2D susceptibility
Recent reports have demonstrated a relationship between T2D-associated variants, genome-wide, and transcriptional enhancer activity, particularly in human pancreatic islets, liver cells, adi-pose tissue and muscle (29–32). However, the precise biological processes by which these variants impact on disease susceptibil-ity at most GWAS loci remain obscure. Given the primary physio-logical impact on T2D susceptibility of the four loci considered here viaβ-cell dysfunction (4), we explored potential mechan-isms through which the effects of the seven distinct association signals are mediated by overlapping 99% credible set variants with regions of predicted regulatory function in human pancreat-ic islets (32) (Materials and Methods). We observed that credible set variants for four association signals (three atKCNQ1and one atCDKAL1) map to predicted tissue-specific enhancers in human pancreatic islets, suggesting that they may play a role in gene regulation (Fig.2, Supplementary Material, Figs. S4–S6). These variants included: rs231362 and rs231361 (at theKCNQ1
association signal indexed by rs231353, total πC= 0.359); rs234866 (at theKCNQ1association signal indexed by rs233448,
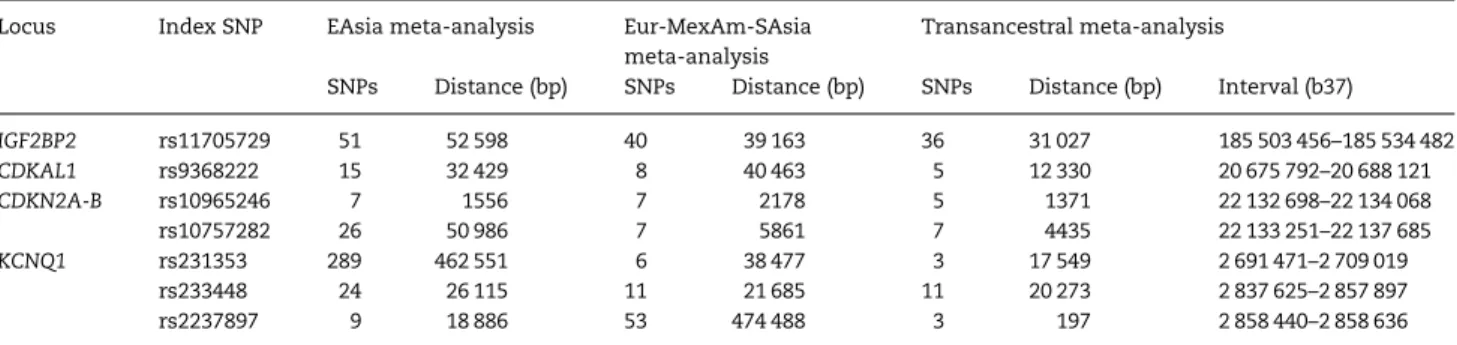
Table 2.Properties of the 99% credible sets of SNPs underlying each distinct association signal on the basis of meta-analyses of: (i) GWAS in the
EAsia clade only; (ii) GWAS in the Eur-MexAm-SAsia clade only and (iii) GWAS from all ancestry groups
Locus Index SNP EAsia meta-analysis Eur-MexAm-SAsia meta-analysis
Transancestral meta-analysis
SNPs Distance (bp) SNPs Distance (bp) SNPs Distance (bp) Interval (b37)
IGF2BP2 rs11705729 51 52 598 40 39 163 36 31 027 185 503 456–185 534 482
CDKAL1 rs9368222 15 32 429 8 40 463 5 12 330 20 675 792–20 688 121
CDKN2A-B rs10965246 7 1556 7 2178 5 1371 22 132 698–22 134 068
rs10757282 26 50 986 7 5861 7 4435 22 133 251–22 137 685
KCNQ1 rs231353 289 462 551 6 38 477 3 17 549 2 691 471–2 709 019
rs233448 24 26 115 11 21 685 11 20 273 2 837 625–2 857 897
πC= 0.048); rs2237897, rs2237896 and rs74046911 (the entire cred-ible set at theKCNQ1association signal indexed by rs2237897, totalπC= 0.990); and rs9348441 (at the loneCDKAL1association signal indexed by rs9368222,πC= 0.120).
To test a potential regulatory role of these variants, we first scanned the enhancer region for potential transcription fac-tor binding sequences (Materials and Methods). We determined
that rs231362, at the KCNQ1 association signal indexed by rs231353, disrupts a bHLH-like motif. Within the large super-fam-ily of bHLH transcription factors, the best aligned score was found for the recognition site of BHLHE40. However, we cannot exclude the possibility ofin vivobinding of other proteins from the same family at this site. Electrophoretic mobility shift assay (EMSA), performed using nuclear extracts obtained from the insulinoma
mouseβcell line MIN6 (Materials and Methods), confirmed that rs231362 alters the binding of a protein complexin vitro(Fig.2). We next created allele-specific luciferase reporter constructs of the predicted regulatory region overlapped by this association signal, and measured enhancer activity in MIN6 cells (Materials and Methods). This experiment confirmed the enhancer po-tential of the genomic site, and revealed higher activity of the haplotype of T2D-risk alleles,in cis, at rs231362 and rs231361 (Fig.2). At the remaining association signals, allele-specific episo-mal reporter assays tested in mouse MIN6 cells failed to demon-strate enhancer activity at overlapping sites (Supplementary Material, Figs. S4–S6). Taken together, these observations high-light rs231362 as a potential functional variant, and point to the alteration of pancreatic islet genome regulation as a possible mechanism through which the association signal indexed by rs231353 at theKCNQ1locus is mediated.
Discussion
We have undertaken comprehensive transancestralfi ne-map-ping of four established T2D susceptibility loci to localize poten-tial causal variants for association signals in 22 086 cases and
42 539 controls from diverse populations. Our study has extended previous transancestral T2D GWAS meta-analyses (10) through 1000G imputation and conditional analyses to improvefi ne-map-ping resolution of distinct association signals in these loci. We have confirmed previous reports of multiple distinct association signals mapping to/nearKCNQ1andCDKN2A-B, which may re-flect multiple causal variants acting in isolation or through their joint effects,in cis, on the same haplotype. However, for thefirst time, we have demonstrated that these distinct associ-ation signals are shared across ancestry groups, with no evidence of heterogeneity in allelic effects on T2D risk between popula-tions for index SNPs, despite substantial variability in allele frequencies.
The utility of transancestral fine-mapping relies on the assumption that causal variants are shared across diverse popu-lations. The lack of heterogeneity in allelic effects on T2D suscep-tibility between populations for distinct association signals at the four loci considered in this study is consistent with this assump-tion. Previous evidence of the transferability of T2D association signals across diverse populations (6–10) suggests that many es-tablished common variant loci for the disease will also be amen-able to transancestralfine-mapping. Future discovery efforts,
with imputation up to larger, higher-density reference panels with improved coverage across the MAF spectrum, would be ex-pected to identify lower frequency association signals that are more likely to be ancestry- or population-specific, and thus un-likely to benefit fromfine-mapping across diverse populations.
The resolution of fine-mapping (assessed by credible set size) will depend, crucially, on the extent of differences in the structure of LD between populations contributing to the transan-cestral meta-analysis (12). We observed the most precise localiza-tion of causal variants for the T2D associalocaliza-tion signal mapping nearCDKAL1, which has the greatest difference in LD structure between populations of European, East Asian and African ances-try among those loci considered in our study (28). However, even at theIGF2BP2locus, where differences in LD between popula-tions are less well defined, increased sample size in the transan-cestral meta-analysis offered improved resolution over ancestry-specificfine-mapping by magnifying even small deviations in the correlation of SNPs with the causal variant. We would expect, therefore, that transancestralfine-mapping would enable im-proved localization of T2D association signals across common variant GWAS loci, with further enhancements obtained through inclusion of additional African (American) descent populations, where the extent of LD is minimized.
Ourfine-mapping experiment provided no evidence that as-sociation signals at the four susceptibility loci are driven by cod-ing variants. Our data are thus consistent with previous genome-wide reports that association signals for T2D susceptibility are most likely to act via gene regulation (29,30). Here, usingKCNQ1
as an exemplar, we have demonstrated how geneticfi ne-map-ping and genomic annotation can be used to highlight potential causal regulatory elements in disease-relevant tissues, thereby providing insight into the mechanisms through which asso-ciation signals are mediated, and routes to understand the underlying biology of specific loci through directed functional ex-perimentation. At this locus, our results highlight rs231362 as having a gain-of-function effect on a pancreatic islet enhancer element residing in intron 11 of theKCNQ1gene and overlapping theKCNQ1-OT1non-coding transcript, a region previously de-monstrated to harbour tissue-specific active enhancers in mouse (33). While more experiments are needed to characterize the protein complex binding this regulatory element, we deter-mined that rs231362 alters a bHLH-like motif. Several bHLH tran-scription factors are expressed in human pancreatic islets, including key islet regulators such as NEUROD1 (34). The best alignment score was found for the recognition site of the bHLH transcription factor BHLHE40, a protein expressed in human pan-creatic islets and shown to play a role during the specification of pancreatic endocrine progenitor cells (35). However, the biologic-al role of BHLHE40 in adult pancreatic islets remains unclear.
KCNQ1encodes for the voltage-gated K+ channel Kv7.1 in pancreaticβ-cells. Over-expression ofKCNQ1in cultured MIN6 cells has been shown to decrease glucose induced insulin secre-tion (36), and is thus in keeping with a gain-of-function regula-tory mechanism in T2D susceptibility. Moreover, inhibition of Kv7.1 inβ-cells has been previously demonstrated to increase exocytosis and secretion of insulin (37), and patients with loss-of-function mutations inKCNQ1exhibit increased insulin secre-tion (38). Although further functional experimentation, beyond the scope of this study, will be required to definitively establish the gene target of the regulatory element overlapping variants driving theKCNQ1-OT1association signal, these data point to
KCNQ1as a possible candidate.
At the remaining association signals, episomal reporter assays performed in mouse MIN6 cells failed to demonstrate
enhancer activity at sites overlapping credible set variants. While episomal assays cannot recapitulate the natural genomic and chromatin context, approaches such as genome-editing (39) could unmask a possible effect of these variants in their
cis-regulatory milieu and enable isolation of their impact onβ -cell gene expression and function.
In conclusion, we have demonstrated that transancestral meta-analysis of GWAS from diverse populations can be used to localize variants most likely to drive distinct association sig-nals at T2D susceptibility loci. By integrating geneticfi ne-map-ping with genomic information from diabetes-relevant tissues, we have demonstrated the utility of this approach for elucidating the mechanisms through which the effects of T2D association signals at GWAS loci on disease susceptibility are mediated. Our study and analytical protocols provide a prototype for future transancestralfine-mapping of T2D susceptibility loci, genome-wide. These efforts will be further enhanced by the release of larger, ancestry-specific imputation reference panels that in-corporate reference haplotypes from a wider spectrum of global populations, and improved functional and regulatory genomic annotation, thus promising an exciting opportunity to explicate the, as yet, poorly understood pathophysiology of the disease.
Materials and Methods
Ethics statementAll human research was approved by the relevant institutional review boards, and conducted according to the Declaration of Helsinki. All participants provided written informed consent.
Study-level analysis
Sample and SNP quality control was undertaken in each study (Supplementary Material, Table S1). In each of the four loci, the clean GWAS scaffold was then imputed up to the 1000 Genomes Project (Phase 1 integrated, all ancestries, March 2012 release) ref-erence panel (15). Well-imputed variants, defined by IMPUTEv2 (16) info >0.4 or minimac (17)r2> 0.3, were tested for association with T2D in a logistic regression framework under an additive model after adjustment for study-specific covariates (Supple-mentary Material, Table S2), including principal components to adjust for population structure. Under the assumption that the underlying causal variants for association signals at these loci are common and shared across ancestry groups, SNPs with MAF <1% were excluded from downstream analyses.
Transancestral meta-analysis
Association summary statistics for each SNP were combined across studies using two complementary approaches: (i) a fixed-effects meta-analysis implemented in GWAMA (40) and (ii) a Bayesian hybrid offixed- and random-effects meta-analysis, as implemented in MANTRA (19). Meta-analyses were performed first across studies within each of the EAsia and Eur-MexAm-SAsia ancestral clades (Supplementary Material, Fig. S1). Subse-quently, meta-analyses were performed across all populations, bringing together the AfAm study with those from the EAsia and Eur-MexAm-SAsia ancestral clades. SNPs passing quality control in <80% of the total sample size (N≥51 700) were excluded from the transancestral meta-analysis.
by the standard threshold ofP< 5 × 10⁻⁸. Heterogeneity in allelic effects was assessed by means of Cochran’sQstatistic (41).
MANTRA was developed specifically for the purposes of trans-ancestralfine-mapping, and allows for heterogeneity in allelic ef-fects between ancestry groups arising as a result of differences in the structure of LD with the causal variant between diverse popu-lations. MANTRA assigns studies to clusters according to a Bayes-ian partition model of relatedness between them, defined by pair-wise genome-wide mean allele frequency differences (Sup-plementary Material, Fig. S1). Genome-wide significance was de-fined by a threshold of log10BF≥6, which has been demonstrated, by simulation, to be approximately equivalent toP< 5 × 10⁻⁸ under afixed-effects model (19,20). MANTRA also provides an as-sessment of the evidence of heterogeneity in allelic effects by means of a BF, calculated by comparing a model where all studies are assigned to the same cluster, with one where the number of clusters is unconstrained.
Identification of distinct association signals
We identified‘index SNPs’to represent distinct signals of associ-ation attaining genome-wide significance (MANTRA log10BF≥6 andP< 5 × 10⁻⁸) at each locus through a series of conditional ana-lyses, described below. Conditional analyses were performed in each study, testing for T2D association with well-imputed var-iants in a logistic regression framework under an additive model after adjustment for study-specific covariates (Supplementary Material, Table S2), and inclusion of genotypes at other index var-iants at the locus as additional covariates. Association summary statistics for each SNP were then combined across studies by means of afixed-effects meta-analysis and MANTRA.
At theIGF2BP2locus, we included genotypes at the lead SNP (rs11705729) from the transancestral meta-analysis as an add-itional covariate in the logistic regression model, and no variants attained at the locus genome-wide significance after condition-ing. The strongest residual association signal in conditional ana-lysis was achieved by rs1540390 (log10BF = 0.98,P= 0.012). We concluded that there is one common variant association signal mapping to theIGF2BP2locus, indexed by rs11705729. Subse-quentfine-mapping analyses were undertaken on the basis of the unconditional transancestral meta-analysis at this locus.
At theCDKAL1locus, we included genotypes at the lead SNP (rs9368222) from the transancestral meta-analysis as an add-itional covariate in the logistic regression model, and no variants at the locus attained genome-wide significance after condition-ing. The strongest residual association signal was achieved by rs2328574 (log10BF = 1.76,P= 0.027). We concluded that there is one common variant association signal mapping to theCDKAL1
locus, indexed by rs936822. Subsequentfine-mapping analyses were undertaken on the basis of the unconditional transancestral meta-analysis at this locus.
At theCDKN2A-Blocus, wefirst included genotypes at the lead SNP (rs10965248) from the transancestral meta-analysis as an additional covariate in the logistic regression model, and mul-tiple variants at the locus attained genome-wide significance (Supplementary Material, Fig. S3). The strongest residual associ-ation signal was attained by rs10757282 (log10BF = 10.31,P= 2.0 × 10⁻¹²). We next included genotypes at both rs10965248 and rs10757282 as additional covariates in the logistic regression model, and no variants at the locus attained genome-wide sig-nificance after this second round of conditioning. The strongest residual association signal was attained by rs10811649 (log10BF = 1.88,P= 0.21). We concluded that there are two distinct signals of association mapping to theCDKN2A-Blocus. Subsequentfi
ne-mapping analyses for distinct common variant association sig-nals at this locus were thus based on: (i) conditional analysis after adjustment for genotypes at rs10757282 as an additional covariate (index variant rs10965246) and (ii) conditional analysis after adjustment for genotypes at rs10965248 as an additional covariate (index variant rs10757282).
At theKCNQ1locus, visual inspection of the signal plot for the transancestral meta-analysis revealed three SNPs that were not in LD with each other in any ancestry group (r2< 0.04), but all attaining genome-wide significance: rs2237896, rs231353 and rs234864 (Supplementary Material, Fig. S2). We thus included genotypes at all three of these SNPs as additional covariates in the logistic regression model, and no variants at the locus at-tained genome-wide significance after conditioning. The stron-gest residual association signal was achieved by rs233448 (log10BF = 3.38,P= 2.1 × 10⁻⁵). We concluded that there are three distinct common variant association signals mapping to the
KCNQ1locus. Subsequentfine-mapping analyses for distinct as-sociation signals at this locus were thus based on: (i) conditional analysis after adjustment for genotypes at rs2237896 and rs231353 as additional covariates (index variant rs233448); (ii) conditional analysis after adjustment for genotypes at rs2237896 and rs234864 (index variant rs231353) and (iii) condi-tional analysis after adjustment for genotypes at rs231353 and rs234864 (index variant rs2237897).
Credible set construction
We calculated the posterior probability that thejth variant,πCj, is driving a distinct association signal by
πCj¼ Λj P
kΛk;
where the summation is over all variants in the locus. In this ex-pression,Λjis the MANTRA BF in favour of association from the transancestral meta-analysis. In loci with multiple distinct sig-nals of association (KCNQ1andCDKN2A-B), results are presented from conditional meta-analysis as described above. In loci with a single association signal (IGF2BP2andCDKAL1), results are pre-sented from unconditional meta-analysis. A 99% credible set (27) was then constructed by: (i) ranking all variants according to their BF,Λjand (ii) including ranked variants until their cumu-lative posterior probability exceeds 0.99.
For each association signal, credible sets were constructed on the basis of the MANTRA BF in favour of association on the basis of the following meta-analyses: (i) studies within the EAsia cestral clade only; (ii) studies within the Eur-MexAm-SAsia an-cestral clade only and (iii) all studies across ancestry groups.
Genomic annotation and functional study of credible set variants
common and rare genotype of the associated variants and to re-produce risk and protective haplotypes. Correct mutagenesis was confirmed by Sanger sequencing.
Mouseβ-cells (MIN6) were co-transfected in triplicate wells with pGL4.23-regulatory region and pRL using Lipofectamine 2000 (Invitrogen), and luciferase activity was measured after 48 h. Results were expressed as luciferase:renilla ratios in vectors carrying putative regulatory regions, relative to the ratio in empty PGL4.23 vector. Statistical significance was assessed using a two-sided Student’st-test across all experiments.
EMSA was performed with mouse MIN6β-cell nuclear extracts as previously described (45). The sequences of oligonucleotides used in this assay to test both genotypes of the credible set vari-ant rs231362 were:
rs231362: A 5′-GATCTTTGACCCTGCACATGACGGGCGAG-3́; and
rs231362: G 5′-GATCTTTGACCCTGCACGTGACGGGCGAG-3́.
Supplementary Material
Supplementary Material is available atHMGonline.
Acknowledgements
L.P. is a recipient of a Ramon y Cajal contract from the Spanish Ministry of Economy and Competitiveness (RYC 2014-0069) and a Rising Star Award from the European Foundation for the Study of Diabetes (EFSD). J.C.F. is a Massachusetts General Hospital Research Scholar. N.K. is a recipient of the Okinga Scholarship, and thanks Dr Shoichi Okinaga, Dr Hiroko Okinaga and other staff at Teikyo University, Japan. M.I.M. is a Wellcome Trust Senior Investigator and NIHR Senior Investigator. A.P.M. is a Wellcome Trust Senior Research Fellow in Basic Biomedical Science.
The BBJ study thanks all the participants and the staff of the BioBank Japan project. The CAGE study thanks Dr Eitaro Nakashi-ma, Dr Jiro Nakamura, Dr Mitsuhiro Yokota and Dr Masato Isono for their assistance in collecting the DNA samples and the ac-companying clinical information, and genotyping. The DGDG study thanks C. Petit, J-P. Riveline and S. Franc for recruitment, and S. Brunet, F. Bacot, R. Frechette, V. Catudal, M. Deweirder, F. Allegaert, P. Laflamme, P. Lepage, W. Astle, M. Leboeuf and S. Leroux for technical assistance. The DGDG study also thanks K. Shazand and N. Foisset for organizational guidance, and thanks Rob Sladek for his contribution to the study design. The work for the LOLIPOP study was carried out in part at the NIHR/ Wellcome Trust Imperial Clinical Research Facility. The LOLIPOP study also thanks the participants and research staff who made the study possible. The LONGENITY study thanks Professor Aviv Bergman for providing genotypes. We thank Javier Garcia-Hurtado (IDIBAPS) and Helena Raurell (IGTP) for technical support.
Conflict of Interest statement. J.C.F. has received consulting honor-aria from Pfizer and PanGenX.
Funding
This work was supported by Action on Hearing Loss (G51); Ameri-can Federation for Aging; Einstein Glenn Center; Association Francaise des Diabetiques; British Heart Foundation (SP/04/002); CARDIOMED BSC0122(6)-CSIR, India; Centre Hospitalier Universi-taire Poitiers; CNAMTS; Endocrinology-Diabetology Department of the Corbeil-Essonnes Hospital; European Union (FP7
EpiMigrant, 279143); Focused Investment Scheme of the Chinese University of Hong Kong; Fondation de France; Hong Kong Foundation for Research and Development in Diabetes; Genome Canada; Génome Quebec; Hong Kong Government Research Grant Committee Central Allocation Scheme (CUHK 1/04C), In-novation and Technology Fund (ITS/487/09FP and ITS/130/11), and the Research Grants Council Theme-based Research Scheme (T12-402/13N); Japan Society for the Promotion of Science (KAKENHI 23710228); Medical Research Council (G0601966, G0700931); Ministerio de Economía y Competitividad (BFU2014-58150-R); Ministry of Education, Culture, Sports, Science and Technology of Japan; National Center for Global Health and Medicine (NCGM); National Institute of Aging (PO1AG027734, R01AG046949, 1R01AG042188, P30AG038072, R014AG028872); National Institutes of Health (K24-DK080140, U01-DK085526, R01-MH101820, P60-DK20595, U01-DK085501, R01-HL102830, U01-HG005773, R01-MH090937, R01-HL102830, R01-HG000376, R01-DK062370, R01-DK073541, U01-DK085524, U01-DK085545, U01-DK085584, U01- DK105535); National Institute for Health Research (RP-PG-0407-10371); National Institute for Health Research (NIHR) Comprehensive Biomedical Research Centre, Imperial College Healthcare NHS Trust; National Medical Research Program, Singapore; National Research Foundation of Korea (NRF-2012R1A2A1A03006155, 2012R1A3A2026438, 2013M3A9C4078158, 2015R1A5A6001906); Program for Promotion of Fundamental Studies in Health Sciences, National Institute of Biomedical Innovation Organization (NIBIO); Wellcome Trust (WT084723, WT090532, WT098017, WT098051). The Jackson Heart Study is supported by contracts HHSN268201300046C, HHSN268201300047C, HHSN268201300048C, HHSN268201300049C, HHSN268201300050C from the National Heart, Lung, and Blood In-stitute and the National InIn-stitute on Minority Health and Health Disparities. Funding to pay the Open Access publication charges for this article was provided by the Wellcome Trust.
References
1. Parra, E.J., Below, J.E., Krithika, S., Valladares, A., Barta, J.L., Cox, N.J., Hanis, C.L., Wacher, N., Garcia-Mena, J., Hu, P.et al.
(2011) Genome-wide association study of type 2 diabetes in a sample from Mexico City and a meta-analysis of a Mexican American sample from Starr County, Texas.Diabetologia,54, 2038–2046.
2. Kooner, J.S., Saleheen, D., Sim, X., Sehmi, J., Zhang, W., Fros-sard, P., Been, L.F., Chia, K.S., Dimas, A.S., Hassanali, N.et al.
(2011) Genome-wide association study in individuals of South Asian ancestry identifies six new type 2 diabetes sus-ceptibility loci.Nat. Genet.,43, 984–989.
3. Cho, Y.S., Chen, C.H., Hu, C., Long, J., Ong, R.T., Sim, X., Takeu-chi, F., Wu, Y., Go, M.J., YamauTakeu-chi, T.et al.(2012) Meta-analysis of genome-wide association studies identifies eight new loci for type 2 diabetes in East Asians.Nat. Genet.,44, 67–72. 4. Morris, A.P., Voight, B.F., Teslovich, T.M., Ferreira, T., Segre, A.
V., Steinthorsdottir, V., Strawbridge, R.J., Khan, H., Grallert, H., Mahajan, A.et al.(2012) Large-scale association analysis pro-vides insights into the genetic architecture and pathophysi-ology of type 2 diabetes.Nat. Genet.,44, 981–990.
5. Ng, M.C.Y., Shriner, D., Chen, B.H., Li, J., Chen, W.-M., Guo, X., Liu, J., Bielinski, S.J., Yanek, L.R., Nalls, M.A.et al.(2014) Meta-analysis of genome-wide association studies in African Americans provides insights into the genetic architecture of type 2 diabetes.PLoS Genet.,10, e1004517.
Altshuler, D., Henderson, B.E.et al.(2010) Consistent associ-ation of type 2 diabetes risk variants found in Europeans in diverse racial and ethnic groups.PLoS Genet.,6, e1001078. 7. Saxena, R., Elbers, C.C., Guo, Y., Peter, I., Gaunt, T.R., Mega, J.L.,
Lanktree, M.B., Tare, A., Castillo, B.A., Li, Y.R.et al.(2012) Large-scale gene-centric meta-analysis across 39 studies identifies type 2 diabetes loci.Am. J. Hum. Genet.,90, 410–425. 8. Ng, M.C., Saxena, R., Li, J., Palmer, N.D., Dimitrov, L., Xu, J., Rasmussen-Torvik, L.J., Zmuda, J.M., Siscovick, D.S., Patel, S. R.et al.(2013) Transferability andfine-mapping of type 2 dia-betes loci in African Americans: the Candidate Gene Associ-ation Resource Plus Study.Diabetes,62, 965–976.
9. Xim, S., Ong, R.T., Suo, C., Tay, W.T., Liu, J., Ng, D.P., Boehnke, M., Wong, T.Y., Seielstad, M., Teo, Y.Y.et al.(2011) Transfer-ability of type 2 diabetes implicated loci in multi-ethnic co-horts from Southeast Asia.PLoS Genet.,7, e1001363.
10. Mahajan, A., Go, M.J., Zhang, W., Below, J.E., Gaulton, K.J., Fer-reira, T., Horikoshi, M., Johnson, A.D., Ng, M.C., Prokopenko, I.
et al.(2014) Genome-wide trans-ancestry meta-analysis pro-vides insight into the genetic architecture of type 2 diabetes susceptibility.Nat. Genet.,46, 234–244.
11. Cooper, R.S., Tayo, B. and Zhu, X. (2008) Genome-wide associ-ation studies: implicassoci-ations for multi-ethnic samples.Hum. Mol. Genet.,17, R151–R155.
12. Zaitlen, N., Pasaniuc, B., Gur, T., Ziv, E. and Halperin, E. (2010) Leveraging genetic variability across populations for the identification of causal variants.Am. J. Hum. Genet.,86, 23–33. 13. Rosenberg, N.A., Huang, L., Jewett, E.M., Szpiech, Z.A., Janko-vic, I. and Boehnke, M. (2010) Genome-wide association stud-ies in diverse populations.Nat. Rev. Genet.,11, 356–366. 14. The International HapMap Consortium (2007) A second
generation human haplotype map of over 3.1 million SNPs.
Nature,449, 851–861.
15. The 1000 Genomes Project Consortium (2012) An integrated map of genetic variation from 1,092 human genomes.Nature,
491, 56–65.
16. Howie, B.N., Donnelly, P. and Marchini, J. (2009) Aflexible and accurate genotype imputation method for the next gener-ation of genome-wide associgener-ation studies.PLoS Genet.,5, e1000529.
17. Howie, B., Fuchsberger, C., Stephens, M., Marchini, J. and Abe-casis, A.R. (2012) Fast and accurate genotype imputation in genome-wide association studies through pre-phasing.Nat. Genet.,44, 955–959.
18. Winkler, T.W., Day, F.R., Croteau-Chonka, D.C., Wood, A.R., Locke, A.E., Magi, R., Ferreira, T., Fall, T., Graff, M., Justice, A. E.et al.(2014) Quality control and conduct of genome-wide association meta-analyses.Nat. Protoc.,9, 1192–1212. 19. Morris, A.P. (2011) Transethnic meta-analysis of
genome-wide association studies.Genet. Epidemiol.,35, 809–822. 20. Wang, X., Chua, H.X., Chen, P., Ong, R.T., Sim, X., Zhang, W.,
Takeuchi, F., Liu, X., Khor, C.C., Tay, W.T.et al.(2013) Compar-ing methods for performCompar-ing transancestral meta-analysis of genome-wide association studies.Hum. Mol. Genet.,22, 2303– 2311.
21. Yasuda, K., Miyake, K., Horikawa, Y., Hara, K., Osawa, H., Fur-uta, H., Hirota, Y., Mori, H., Jonsson, A., Sato, Y.et al.(2008) Variants inKCNQ1are associated with susceptibility to type 2 diabetes mellitus.Nat. Genet.,40, 1092–1097.
22. Unoki, H., Takahashi, A., Kawaguchi, T., Hara, K., Horikoshi, M., Andersen, G., Ng, D.P., Holmkvist, J., Borch-Johnsen, K., Jorgensen, T.et al.(2008) SNPs inKCNQ1are associated with susceptibility to type 2 diabetes in East Asian and European populations.Nat. Genet.,40, 1098–1102.
23. Voight, B.F., Scott, L.J., Steinthorsdottir, V., Morris, A.P., Dina, C., Welch, R.P., Zeggini, E., Huth, C., Aulchenko, Y.S., Thor-leifsson, G.et al.(2010) Twelve type 2 diabetes susceptibility loci identified through large scale association analysis.Nat. Genet.,42, 579–589.
24. Fitzpatrick, G.V., Soloway, P.D. and Higgins, M.J. (2002) Region-al loss of imprinting and growth deficiency in mice with a tar-geted deletion of KvDMR1.Nat. Genet.,32, 426–431.
25. Zeggini, E., Weedon, M.N., Lindgren, C.M., Frayling, T.M., Elliott, K.S., Lango, H., Timpson, N.J., Perry, J.R., Rayner, N. W., Freathy, R.M.et al.(2008) Replication of genome-wide as-sociation signals in UK samples reveals risk loci for type 2 diabetes.Science,316, 1336–1339.
26. Shea, J., Agarwala, V., Philippakis, A.A., Magure, J., Banks, E., Depristo, M., Thomson, B., Guiducci, C., Onofrio, R.C., Kathiresan, S.et al.(2011) Comparing strategies tofi ne-map the association of common SNPs at chromosome 9p21 with type 2 diabetes and myocardial infarction.Nat. Genet.,43, 801–805.
27. Maller, J.B., McVean, G., Byrnes, J., Vukcevic, D., Palin, K., Su, Z., Howson, J.M., Auton, A., Myers, S., Morris, A.et al.(2012) Bayesian refinement of association signals for 14 loci in 3 common diseases.Nat. Genet.,44, 1294–1301.
28. Ong, R.T.-H., Wang, X., Liu, X. and Teo, Y.-Y. (2012) Efficiency of transancestral genome-wide meta-analysis andfi ne-map-ping.Eur. J. Hum. Genet.,20, 1300–1307.
29. The ENCODE Project Consortium (2012) An integrated en-cyclopedia of DNA elements in the human genome.Nature,
489, 57–74.
30. Gusev, A., Lee, S.H., Trynka, G., Finucane, H., Vilhjalmsson, B. J., Xu, H., Zhang, C., Ripke, S., Bulik-Sullivan, B. and Stahl, E. (2014) Partitioning heritability of regulatory and cell-type-specific variants across 11 common diseases.Am. J. Hum. Genet.,95, 535–552.
31. Parker, S.C.J., Stitzel, M.L., Taylor, D.L., Orozco, J.M., Erdos, M. R., Akiyama, J.A., van Bueren, K.L., Chines, P.S., Narisu, N., N.I.S.C. Comparative Sequencing Program, et al.(2013) Chro-matin stretch enhancer states drive cell-specific gene regulation and harbour human disease risk variants.Proc. Natl Acad. Sci. USA,110, 17921–17926.
32. Pasquali, L., Gaulton, K.J., Rodriguez-Sequi, S.A., Mularoni, L., Miguel-Escalada, I., Akerman, I., Tena, J.J., Moran, I., Gomez-Marin, C., van de Bunt, M.et al.(2014) Pancreatic islet enhan-cer clusters enriched in type 2 diabetes risk-associated var-iants.Nat. Genet.,46, 136–143.
33. Schultz, B.M., Gallicio, G.A., Cesaroni, M., Lupey, L.N. and Engel, N. (2015) Enhancers compete with a long non-coding RNA for regulation of the Kcnq1 domain.Nucleic Acids Res.,
43, 745–759.
34. Servitja, J.M. and Ferrer, J. (2004) Transcriptional networks controlling pancreatic development and beta cell function.
Diabetologia,47, 597–613.
35. Oström, M., Loffler, K.A., Edfalk, S., Selander, L., Dahl, U., Ricordi, C., Jeon, J., Correa-Medina, M., Diez, J. and Edlund, H. (2008) Retinoic acid promotes the generation of pancreatic endocrine progenitor cells and their further differentiation into beta-cells.PLoS One,3, e2841.
36. Yamagata, K., Senokuchi, T., Lu, M., Takemoto, M., Fazlul Karim, M., Go, C., Sato, Y., Hatta, M., Yoshizawa, T., Araki, E.
et al.(2011) Voltage-gated K+ channel KCNQ1 regulates insu-lin secretion in MIN6 b-cell insu-line.Biochem. Biophys. Res. Com-mun.,407, 620–625.
Axelsson, A.S. et al.(2012) Reduced insulin exocytosis in human pancreatic b-cells with gene variants linked to type 2 diabetes.Diabetes,61, 1726–1733.
38. Torekov, S.S., Iepsen, E., Christiansen, M., Linneberg, A., Ped-ersen, O., Holst, J.J., Kanters, J.K. and Hansen, T. (2014) KCNQ1 long QT syndrome patients have hyperinsulinemia and symptomatic hypoglycaemia.Diabetes,63, 1315–1325. 39. Sander, J.D. and Joung, J.K. (2014) CRISPR-Cas systems for
editing, regulating and targeting genomes.Nat. Biotechnol.,
32, 347–355.
40. Mägi, R. and Morris, A.P. (2010) GWAMA: software for genome-wide association meta-analysis.BMC Bioinformatics,
11, 288.
41. Ioannidis, J., Patsopoulos, N.A. and Evangelou, E. (2007) Heterogeneity in meta-analyses of genome-wide association investigations.PLoS One,2, e0000841.
42. Quinlan, A.R. and Hall, I.M. (2010) BEDTools: aflexible suite of utilities for comparing genomic features.Bioinformatics,26, 841–842.
43. Heinz, S., Benner, C., Spann, N., Bertolino, E., Lin, Y.C., Laslo, P., Cheng, J.X., Murre, C., Singh, H. and Glass, C.K. (2010) Sim-ple combinations of lineage-determining transcription fac-tors primecis-regulatory elements required for macrophage andβ-cell identities.Mol. Cell,38, 576–589.
44. Cebola, I., Rodriguez-Segui, S.A., Cho, C.H., Bessa, J., Rovira, M., Luengo, M., Chhatriwala, M., Berry, A., Ponso-Cobas, J., Maestro, M.A.et al.(2015) TEAD and YAP regulate the enhan-cer network of human embryonic pancreatic progenitors.
Nat. Cell Biol.,17, 615–626.